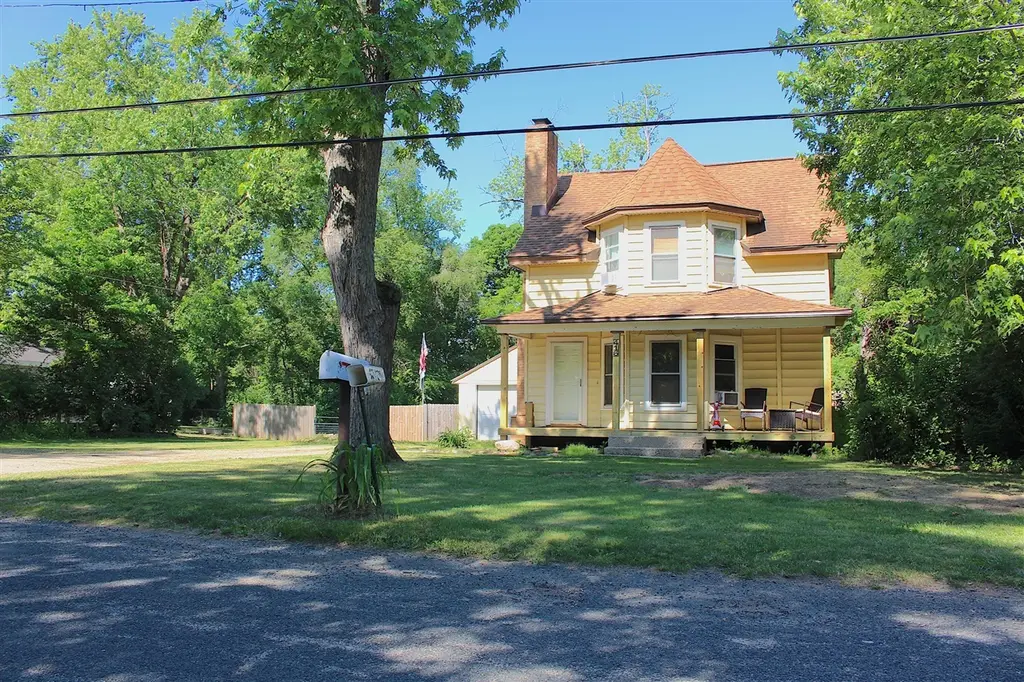
416 Frederick St · Eastwood, MI
Flood risk 8/10 · Major
- FEMA flood zone
- X (unshaded)
- Chance of flooding over 30 yrs
- 0.99%
- Est. flood insurance / yr
- $473 – $860
Fire risk 1/10 · Minimal
- Est. fire insurance / yr
- $784 – $1,456
Heat risk 2/10 · Minimal
- Hot days now (above 98°F)
- 7 days/yr
- Hot days in 30 yrs
- 16 days/yr
Wind risk 2/10 · Minimal
- Chance of severe wind over 30 yrs
- —
Air-quality risk 2/10 · Minimal
- Unhealthy air days now
- 1 days/yr
- Unhealthy air days in 30 yrs
- 2 days/yr
Risk factors via First Street. Map © Google.
Why this score? — see what drove the C+ grade
The composite is a weighted blend of 9 inputs, each scored 0–100. Each bar is that input's sub-score; the figure is the points it added to the 100-point composite (weight × sub-score).
- Cash flow +23.3/30.0
- ARV discount +12.5/15.0
- DSCR +7.5/10.0
- 1% rule +6.0/10.0
- Rent growth +4.5/5.0
- Livability +3.7/5.0
- Condition / age +2.5/5.0
- Schools +2.1/10.0
- Appreciation +0.0/10.0
$130,000
🖨 Deal sheet (PDF) 📄 Offer letter ✓ Due diligence
Listing remarks MLS
POTENTIAL is the headline at 416 Frederick Avenue. Located in the heart of Comstock, yet tucked away on a beautiful 0.61-acre lot at the end of a quiet dead-end street, this 3BD/1BA home offers 1,200 finished ft and the kind of potential buyers spend months searching for and rarely find. The main level offers a living room, dining room, kitchen, and functional breezeway entry, with all 3 bedrooms upstairs. The huge fenced backyard offers space for outdoor living, gardening, pets, or play, with a setting that feels anything but ordinary. Mature trees and a tucked-away location create a sense of privacy that's increasingly difficult to find this close to everyday conveniences. Roof replaced in 2017; new deck in 2026. First-time buyer? Investor? Landlord? Flipper? If HGTV has your number, this is the opportunity you've been waiting for! More Photos Coming Soon! Showings Begin Saturday, 6/6!
Key facts
- 0.61 acre lot
- Garage
- Built 1915
Property features AI
Exterior
- Parking: Detached garage; 1 garage space
- Utilities: Well water; Natural gas available and connected; Natural gas water heater; Cable connected
- Home design: Traditional-style single family residence; Approximately 1,200 total building area; Built in 1915
- Construction: Brick and vinyl siding; Composition roof; Full foundation (basement)
- Exterior features: Paved road access; Lot approximately 0.61 acre
Interior
- Kitchen: Oven; Range; Refrigerator
- Bedrooms: Primary bedroom; Bedroom 2; Bedroom 3; Bedroom 4; Bedroom 5; Additional rooms (Den, Recreation, Other)
- Bathrooms: 1 full bathroom; Primary bathroom
- Heating & cooling: Forced air heating; Has heating
- Interior features: Garage door opener; Wood-burning fireplace; Window treatments; 7 total rooms; Full basement
- Laundry & utility: Washer; Dryer; Laundry room
Neighborhood map
What this means for you Summary
Snapshot
- This is a 3-bed/1.0-bath single-family listed at $130k.
Deal economics
- At list price, monthly cash flow is $183 ($2k/yr) — positive.
- The deal already cash-flows at list — no discount required.
- Meets the 1% rule at list price ($1k rent vs $130k).
Location & tenants
- Location reads 74/100 on livability (#187 in MI, #4,713 nationally) — a middle-class / working-renter tenant base. Strengths: cost of living A+, housing A+, health & safety A+; Watch: schools C-, crime C-, employment D+.
- Comstock Public Schools (suburban): math 18% / reading 32% proficiency, ranked #428 of 540 in MI (top 79%) — low school quality limits family demand, transient renter base, plan for 1-2y turnover; 65% free/reduced lunch — lower-income household profile, screen leases tightly.
- Market conditions: Rents rising fast (+7.9%/yr); 154 active listings in the ZIP; 1 comparable units currently listed for rent nearby; 339 units permitted in Kalamazoo County in 2024 (22 in 5+ unit buildings).
Forward outlook
- Local home prices are declining (-3.0%/yr); year-one equity from $899 of loan paydown is wiped out by about $4k of value loss. Plan a longer hold.
- Kalamazoo County population projected at +18% by 2050 — long-run rental-demand tailwind backs the buy-and-hold thesis.
- At projected returns (-3.0% appreciation + 7.9% rent growth), your $36k cash investment doubles in ~9 years — after that, you're playing with house money.
Negotiation context
- Only 1 days on market — expect competitive offers; lowballing is unlikely to land.
- 11 sale attempts since 24y ago; this cycle's ask is 53% above the opening price — seller raised mid-cycle; expect resistance to lowballs.
- Current owner paid $82k; list at $130k implies a 59% gain — meaningful room to come down on a strong offer.
Risks & watch-outs
- Watch-outs: flood insurance adds $56/mo; built in 1915 — expect roof / HVAC / electrical / plumbing capex.
- Climate carrying-cost: severe flood risk — expect insurance premiums to compound above CPI over the hold.
Questions for the listing agent
- Built in 1915 — when were the roof, HVAC, electrical panel, plumbing, and water heater last replaced?
- What's the actual annual flood-insurance premium (NFIP or private), and is the property in a SFHA with mandatory coverage?
- Is there a deadline driving the sale (1031 exchange, divorce, estate, relocation)? That informs how much negotiation room exists.
- What's the average days-on-market for RENTAL listings here right now (not sales)? A rising rental-DOM trend means longer vacancies and softer asking-rent achievability than the comps imply.
- What's the recent tenant-quality profile in this submarket — average credit score on applications, eviction rate, late-payment / NSF rate, and stable-employment percentage? A property-management company in the area should have these aggregated.
- How much new for-sale + rental construction is in the pipeline within 1–3 miles? Heavy new supply typically softens prices + rents 12–24 months out; constrained supply supports both.
Investment metrics
- 1% rule
- 1.10% ✓
- Cap rate
- 8.49%
- Cash-on-cash
- 7.85%
- DSCR
- 1.35
- GRM
- 7.5
CMA / ARV
- ARV (on-the-fly)
- $146,400
- Comps found
- 11
Show comp detail 11 sales within ~0.75 mi
| Address | Dist | Beds/Ba | Sqft | Sold | Price | $/sf | Match |
|---|---|---|---|---|---|---|---|
| 5382 Ripley St | 0.28mi | 3/1.0 | 1,300 (+8%) | 14mo | $145,000 | $112 | 61 |
| 5875 Celery St | 0.42mi | 3/1.0 | 1,250 (+4%) | 18mo | $115,000 | $92 | 59 |
| 233 Leenhouts St | 0.42mi | 2/1.0 (-1) | 1,065 (-11%) | 6mo | $167,000 | $157 | 52 |
| 6164 Copeland Ave | 0.67mi | 2/1.0 (-1) | 1,152 (-4%) | 6mo | $170,000 | $148 | 52 |
| 5783 Neal St | 0.70mi | 3/2.0 | 1,248 (+4%) | 6mo | $179,500 | $144 | 52 |
| 778 Ferris St | 0.22mi | 3/1.5 | 1,059 (-12%) | 23mo | $145,000 | $137 | 49 |
| 717 Pingree St | 0.27mi | 3/2.0 | 1,056 (-12%) | 20mo | $110,000 | $104 | 46 |
| 5179 E Michigan Ave | 0.48mi | 2/1.0 (-1) | 1,352 (+13%) | 8mo | $190,000 | $141 | 45 |
| 6151 Abbey St | 0.63mi | 2/1.0 (-1) | 1,260 (+5%) | 15mo | $58,000 | $46 | 44 |
| 370 Leenhouts St | 0.49mi | 2/1.5 (-1) | 1,340 (+12%) | 23mo | $104,880 | $78 | 32 |
| 6160 Grange Ave | 0.66mi | 2/1.0 (-1) | 1,364 (+14%) | 14mo | $167,000 | $122 | 30 |
Match score weights: distance 35% · size 25% · config 20% · recency 20%. Top-matched comps best support the ARV.
Projected returns pro-forma
-3.0% appreciation · 7.88% rent growth · sell at horizon
- IRR
- -1.4%
- Equity multiple
- 0.95×
- Total profit
- $-1,976
- Equity at exit
- $19,383
- IRR
- 13.1%
- Equity multiple
- 2.29×
- Total profit
- $47,068
- Equity at exit
- $11,240
Cash invested: $36,400 (down + closing). Projections, not guarantees.
Landlord ↔ Tenant lean methodology
- Overall (STATE)
- 62 Landlord-Friendly
- State Michigan
- 62 Landlord-Friendly · EVEN
- County
- — inherits STATE
- City
- — inherits STATE
ZIP-level market 49048
- Rents YoY
- 7.9%
- Active inventory
- 154
- Price-to-rent
- 7.5×
Monthly cashflow live
- Estimated rent
- $1,436 medium interval (Pro) →
- Mortgage (P&I)
- −$682
- Tax from tax record
- −$160 /mo · $1,922/yr
- Insurance
- −$54
- Flood insurance flood zone
- −$56 /mo · $666/yr
- HOA
- −$0
- Vacancy / Maint / Mgmt
- −$302
- Net cashflow
- $183
Break-even live
Sensitivity live
| Price | -10% $256 | -5% $220 | +0% $183 | +5% $146 | +10% $109 |
|---|---|---|---|---|---|
| Rent | -10% $69 | -5% $126 | +0% $183 | +5% $239 | +10% $296 |
| Rate | -1.0pp $248 | -0.5pp $216 | base $183 | +0.5pp $149 | +1.0pp $115 |
UW: 25.0% down · 7.5% · 30yr · 1.5% tax · 5.0% vac · 8.0% maint · 8.0% mgmt
Financing live
Cash to close
- Down payment
- $32,500
- Closing costs
- $3,900
- Reserves months
- —
- Total cash needed
- —
Loan-product check · same deal, 3 products live
Conventional
25% down · 7.5% · 30yr
- Down + closing
- —
- Monthly P&I
- —
- Monthly cashflow
- —
- DSCR
- —
- Eligible?
- —
Personal DTI + credit; lowest rate.
DSCR
20% down · 8.5% · 30yr
- Down + closing
- —
- Monthly P&I
- —
- Monthly cashflow
- —
- DSCR
- —
- Eligible?
- —
No personal income docs; deal must DSCR.
Hard money
10% down · 12.0% · 12mo
- Down + closing
- —
- Monthly P&I
- —
- Monthly cashflow
- —
- DSCR
- —
- Eligible?
- —
Short-term bridge; refi at stabilization.
Rent comps 1 comps
| Address | Beds | Baths | Sqft | Rent | $/sqft | DOM | Units | Dist |
|---|---|---|---|---|---|---|---|---|
| 6314 E Jk Ave Kalamazoo, MI | 2.0 | 1.0 | 760 | $950 | $1.25 | 22d | 1 | 1.06mi |
Listing history 4 events
-
2026-06-08status $130,000 Pending 1 DOM
-
2026-06-07status $130,000 Active 1 DOM
-
2026-06-05remarks 694-char remark
-
2026-06-05$130,000 Coming Soon 1 DOM
ⓘ Source: listings_history table (triggers on properties + properties_extension) + one-shot
backfill from property_details.listing_events for pre-trigger history.
Tax reassessment forecast MI · Partial reset (capped growth)
- Current annual tax
- $1,922 · $160/mo
- Projected year-2 tax
- $1,962 · $163/mo
- Expected delta
- +$40/yr (+$3/mo · 2.1%)
ⓘ Screening estimate from a state-policy table — verify with the county assessor before closing.
Climate risk First Street
- Flood 8/10 Severe FEMA zone X (unshaded) · 99% chance over 30 yrs
- Wildfire 1/10 Low
- Heat 2/10 Low 7 d/yr ≥98°F today · 16 d/yr by 30 yrs out
- Wind 2/10 Low
- Air quality 2/10 Low 1 unhealthy d/yr today · 2 by 30 yrs out
Nearby sold comps map
Loading sold comps map…
Walkable amenities ~0.75 mi
Loading nearby amenities…
Taxation est. · year 1
- Rental income
- $17,230
- − Mortgage interest
- −$7,282
- − Property taxes
- −$1,922
- − Insurance
- −$1,316
- − Repairs & maintenance
- −$1,378
- − Management
- −$1,378
- − Depreciation
- −$3,782
- Taxable income
- $171
- Est. tax owed @ 24.0%
- −$41
- After-tax cash flow
- $2,152/yr
For passive investors: Depreciation is non-cash, so a rental often shows a tax loss while cash-flowing — sheltering income. Rental losses are passive: they offset passive income freely, and up to $25,000/yr can offset ordinary (W-2) income if you actively participate and your MAGI is under $100k (phasing out to $0 by $150k); unused losses carry forward. On sale, claimed depreciation is recaptured at up to 25%, and gains may owe capital-gains tax (a 1031 exchange can defer both). Figures are a year-1 estimate at your 24.0% rate — not tax advice; consult a CPA.
Schools (NCES district)
- District
- Comstock Public Schools
- NCES district ID
- 2610590
- Math proficiency
- 18% ▼ -2.00%
- Reading proficiency
- 32% ▼ -1.00%
- Median HH income
- $41,293
- Composite
- 21.17/100
- National rank
- #8423
- State rank
- #428 of 540 in MI
Livability — Eastwood
- Score
- 74/100
- State rank
- #187
- US rank
- #4713
Category grades
Schools grade is shown separately in the Schools card above.
Census & demographics
- County
- Kalamazoo County · 224,317 people
- Metro
- Kalamazoo-Portage, MI
- Population (ZIP)
- 22,791
- Household income
- $60,454
- Rent vs Own
- Severe rent burden
- 835.0
Population outlook (Kalamazoo County) Hauer SSP2
- Today (2025)
- 280,982 people
- By 2030
- 292,068 · +3.9%
- By 2040
- 312,191 · +11.1%
- By 2050
- 331,196 · +17.9%
- By 2075
- 379,021 · +34.9%
- By 2100
- 396,579 · +41.1%
Race, ethnicity, and origin ACS 2023
- Neighborhood character
- Predominantly White (67%)
- Race & ethnicity
- White 67% Black 20% Hispanic / Latino 7% Two or more races 7% Asian 2%
- Hispanic origin (detail)
- Mexican 4%
- Common ancestry
- Iranian 6% Romanian 4% Lithuanian 2%
- Foreign-born
- 4% · Canada
- Languages at home
- 94% English-only · Spanish 3% Other Indo-European 1%
Political lean MEDSL · Kalamazoo
- 2024 margin
- D (+17.7) · D 58.0% · R 40.3% · Other 1.7%
- 2008→2024 swing
- -1.8pp toward R · 2008: 19.5pp · 2024: 17.7pp
- All cycles
- 2024: D+17.7 2020: D+18.7 2016: D+12.8 2012: D+13.3 2008: D+19.5
Not yet ingested
- Civics
- —
Market trends
- HPI YoY
- ▼ -205.26%
- Current HPI
- 180.4766
- Rent YoY
- ▲ 7.88%
- Metro
- Kalamazoo-Portage, MI
- State GDP YoY
- ▲ 1.37%
- F500 in state
- 28
Industry mix (Fortune 500 HQ in MI)
| Industry | F500 HQs | Revenue |
|---|---|---|
| Automotive Parts | 3 | $48B |
|
||
| Automotive | 2 | $372B |
|
||
| Chemicals | 1 | $45B |
|
||
| Automotive Retail | 1 | $29B |
|
||
| Healthcare / Medical Devices | 1 | $23B |
|
||
| Automotive Technology | 1 | $20B |
|
||
Price history
+100.3% since first listed29 events — show timeline
- 2026-06-04 Coming Soon $130,000 MiRealSource-MiMLS
- 2026-06-04 Coming Soon $130,000 SW Michigan MLS
- 2016-08-26 Sold (Public Records) $82,000 Public Records
- 2016-07-27 Sold (MLS) $82,000 SW Michigan MLS
- 2016-07-27 Sold (MLS) $82,000 REALCOMP
- 2016-06-16 Pending — SW Michigan MLS
- 2016-05-25 Price Changed $85,000 SW Michigan MLS
- 2016-05-25 Relisted — SW Michigan MLS
- 2016-05-18 Price Changed $87,000 SW Michigan MLS
- 2016-05-18 Pending — SW Michigan MLS
- 2016-05-16 Listed $85,000 SW Michigan MLS
- 2016-05-16 Listed $85,000 REALCOMP
- 2014-09-25 Listing Removed — SW Michigan MLS
- 2013-09-17 Listing Removed — SW Michigan MLS
- 2013-09-17 Listing Removed — REALCOMP
- 2013-07-08 Listed $79,900 SW Michigan MLS
- 2013-07-08 Listed $79,900 REALCOMP
- 2007-09-12 Sold (Public Records) $66,400 Public Records
- 2007-08-24 Sold (MLS) $66,900 REALCOMP
- 2007-08-24 Sold (MLS) $66,900 SW Michigan MLS
- 2007-05-10 Listed $68,900 REALCOMP
- 2007-05-10 Listed $68,900 SW Michigan MLS
- 2005-10-24 Listing Removed — REALCOMP
- 2005-07-25 Listed $89,900 REALCOMP
- 2005-07-25 Listed $89,900 SW Michigan MLS
- 2002-07-11 Sold (MLS) $64,900 REALCOMP
- 2002-07-11 Sold (MLS) $64,900 SW Michigan MLS
- 2002-05-30 Listed $64,900 REALCOMP
- 2002-05-30 Listed $64,900 SW Michigan MLS
Property tax history
+0.8%/yrLatest (2025): $1,922 · +93.5% YoY. Source: county tax records.
Cash-flow waterfall
monthlySold comps — $/sqft
last 12 mo · ≤1 miLoading sold comps…