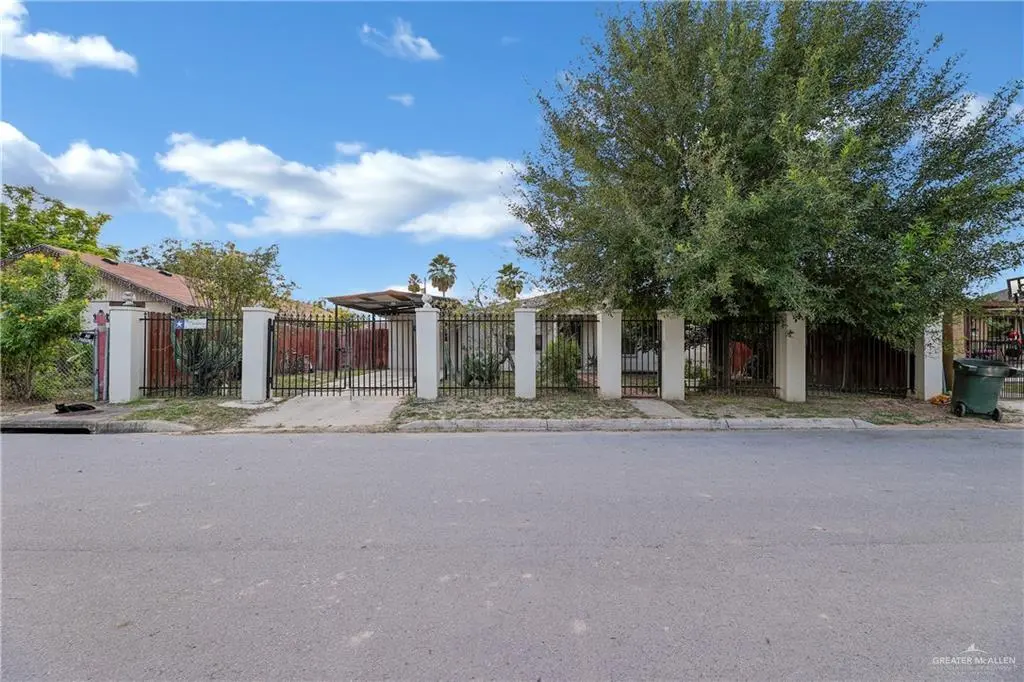
1814 Mimosa St · San Juan, TX
Flood risk 4/10 · Minor
- FEMA flood zone
- X (shaded)
- Chance of flooding over 30 yrs
- 0.2%
- Est. flood insurance / yr
- $507 – $1,088
Fire risk 2/10 · Minimal
- Est. fire insurance / yr
- $1,222 – $2,270
Heat risk 9/10 · Severe
- Hot days now (above 111°F)
- 7 days/yr
- Hot days in 30 yrs
- 23 days/yr
Wind risk 8/10 · Major
- Chance of severe wind over 30 yrs
- 99.0%
Air-quality risk 1/10 · Minimal
- Unhealthy air days now
- 0 days/yr
- Unhealthy air days in 30 yrs
- 0 days/yr
Risk factors via First Street. Map © Google.
Why this score? — see what drove the C- grade
The composite is a weighted blend of 9 inputs, each scored 0–100. Each bar is that input's sub-score; the figure is the points it added to the 100-point composite (weight × sub-score).
- Cash flow +16.5/30.0
- ARV discount +15.0/15.0
- DSCR +5.1/10.0
- 1% rule +4.3/10.0
- Livability +3.6/5.0
- Rent growth +2.5/5.0
- Condition / age +2.5/5.0
- Schools +2.0/10.0
- Appreciation +0.0/10.0
$150,000
🖨 Deal sheet 📄 Offer letter ✓ Due diligence
Listing remarks MLS
Come see this charming, cozy home with ample space for everyone to enjoy! This delightful property in San Juan, TX, offers 4 bedrooms, a versatile study/office space, a welcoming living area, dining area, and 2 bathrooms with washer and dryer connections. Surrounded by lush lime, lemon, peach, and orange trees, as well as blooming roses and other mature trees. There’s also a detached guest room in the back yard. Conveniently located within walking distance to Yzaguirre Middle School, close to the Expressway, schools, HEB, Starbucks, The Basilica of Our Lady of San Juan, Panda Express, Top Golf, Costco, Sam’s, Home Depot, hospitals, and more dining and entertainment options. Discover the incredible potential this home holds for you and your family—schedule a showing today! Have a Great & Blessed Day!
Key facts
- Detached guest room
- Close to expressway
- 7,200 sq ft lot
Tags
Neighborhood map
What this means for you Summary
Snapshot
- This is a 2-bed/1.0-bath single-family listed at $150k.
Deal economics
- At list price, monthly cash flow is $88 ($1k/yr) — positive.
- The deal already cash-flows at list — no discount required.
- To meet the 1% rule (rent ≥ 1% of price), the offer needs to be $139k (7.4% below list).
- Recommended offer: $139k (7.4% below list) — sets the bar for 1% rule.
- Cap rate 7.0% vs local median 3.4% in San Juan — top-decile yield for the area; either an underpriced asset or a hidden risk that comps aren't pricing in. Stress-test before assuming the spread holds.
Location & tenants
- Location reads 71/100 on livability (#294 in TX) — a middle-class / working-renter tenant base. Strengths: cost of living A+, housing A+, health & safety A+; Watch: schools D, amenities F, commute F.
- Pharr-San Juan-Alamo ISD (suburban): math 18% / reading 30% proficiency, ranked #740 of 826 in TX (top 90%) — low school quality limits family demand, transient renter base, plan for 1-2y turnover; 72% free/reduced lunch — lower-income household profile, screen leases tightly.
- Market conditions: 362 active listings in the ZIP; 26 comparable units currently listed for rent nearby; rentals lingering (median 44d on market — plan ~5-8 weeks vacancy on turnover, expect pricing pressure); 65% of comp listings sitting > 30 days — soft ceiling on asking rent; 7,378 units permitted in Hidalgo County in 2024 (641 in 5+ unit buildings).
Forward outlook
- Local home prices are declining (-3.0%/yr); year-one equity from $1k of loan paydown is wiped out by about $4k of value loss. Plan a longer hold.
- Hidalgo County population projected at +28% by 2050 — long-run rental-demand tailwind backs the buy-and-hold thesis.
Negotiation context
- It's been on market 79 days — a 6% lower offer ($141k) is reasonable based on typical stale-listing flexibility.
- 6 sale attempts since 2y ago with the ask held roughly flat each time — persistent listings suggest the price (not the market) is what's stuck; bring a comps-based counter.
Risks & watch-outs
- Climate carrying-cost: severe wind risk, 99% chance of damaging wind over 30y; extreme-heat days projected 7→23/yr by 2055 (HVAC capex compounding) — expect insurance premiums to compound above CPI over the hold.
Questions for the listing agent
- It's been on market 79 days. Have you received any prior offers? Is the seller open to a 7% concession, seller financing, or rate buy-down credit?
- Why hasn't it sold? Are there any deal-killer items the seller is aware of (foundation, flood, title, zoning, code violations)?
- Is there a deadline driving the sale (1031 exchange, divorce, estate, relocation)? That informs how much negotiation room exists.
- Schools are D-rated, which usually means shorter tenancies and higher turnover. Who's the typical renter profile here, and what's been the actual vacancy rate?
- What's the average days-on-market for RENTAL listings here right now (not sales)? A rising rental-DOM trend means longer vacancies and softer asking-rent achievability than the comps imply.
- What's the recent tenant-quality profile in this submarket — average credit score on applications, eviction rate, late-payment / NSF rate, and stable-employment percentage? A property-management company in the area should have these aggregated.
- How much new for-sale + rental construction is in the pipeline within 1–3 miles? Heavy new supply typically softens prices + rents 12–24 months out; constrained supply supports both.
Investment metrics
- 1% rule
- 0.93% ✗
- Cap rate
- 7.00%
- Cash-on-cash
- 2.52%
- DSCR
- 1.11
- GRM
- 9.0
CMA / ARV
- ARV (median comp)
- $239,951
- List price
- $150,000
- Delta
- -37.49%
- Verdict
- UNDERPRICED
- Comps
- 20 within 1.0 mi
Show comp detail 12 sales within ~0.75 mi
| Address | Dist | Beds/Ba | Sqft | Sold | Price | $/sf | Match |
|---|---|---|---|---|---|---|---|
| 1917 Lime St | 0.12mi | 3/2.0 (+1) | 1,324 (+6%) | 1mo | $225,000 | $170 | 75 |
| 1116 E Evergreen Ave | 0.25mi | 3/2.0 (+1) | 1,300 (+4%) | 1mo | $236,900 | $182 | 72 |
| 1200 E Evergreen St | 0.28mi | 3/2.0 (+1) | 1,321 (+6%) | 0mo | $229,900 | $174 | 68 |
| 1832 N Yellowwood St | 0.20mi | 3/2.0 (+1) | 1,335 (+7%) | 3mo | $239,999 | $180 | 68 |
| 2025 Black Hills St | 0.32mi | 3/2.0 (+1) | 1,327 (+6%) | 2mo | $229,900 | $173 | 64 |
| 1124 E Evergreen Ave | 0.27mi | 3/2.5 (+1) | 1,398 (+12%) | 3mo | $255,000 | $182 | 55 |
| 1217 E Evergreen Ave | 0.32mi | 3/2.0 (+1) | 1,403 (+12%) | 2mo | $249,900 | $178 | 54 |
| 1119 E Evergreen Ave | 0.25mi | 3/2.0 (+1) | 1,432 (+14%) | 3mo | $226,900 | $158 | 53 |
| 1809 N Mangrove St | 0.41mi | 3/2.0 (+1) | 1,392 (+11%) | 1mo | $239,999 | $172 | 52 |
| 2021 Black Hills St | 0.30mi | 3/2.0 (+1) | 1,429 (+14%) | 3mo | $236,000 | $165 | 51 |
| 1313 Evergreen St | 0.36mi | 3/2.0 (+1) | 1,430 (+14%) | 0mo | $255,900 | $179 | 50 |
| 1805 N Mangrove St | 0.41mi | 3/2.0 (+1) | 1,408 (+12%) | 2mo | $237,000 | $168 | 49 |
Match score weights: distance 35% · size 25% · config 20% · recency 20%. Top-matched comps best support the ARV.
Projected returns pro-forma
-3.0% appreciation · 3.0% rent growth · sell at horizon
- IRR
- -12.3%
- Equity multiple
- 0.56×
- Total profit
- $-18,684
- Equity at exit
- $22,365
- IRR
- -3.2%
- Equity multiple
- 0.79×
- Total profit
- $-9,019
- Equity at exit
- $12,969
Cash invested: $42,000 (down + closing). Projections, not guarantees.
Landlord ↔ Tenant lean methodology
- Overall (STATE)
- 87 Strongly Landlord-Friendly
- State Texas
- 87 Strongly Landlord-Friendly · R+5
- County
- — inherits STATE
- City
- — inherits STATE
ZIP-level market 78589
- Home prices YoY
- -12.1%
- Active inventory
- 362
- Price-to-rent
- 9.0×
Monthly cashflow live
- Estimated rent
- $1,389 high interval (Pro) →
- Mortgage (P&I)
- −$787
- Tax from tax record
- −$160 /mo · $1,921/yr
- Insurance
- −$62
- HOA
- −$0
- Vacancy / Maint / Mgmt
- −$292
- Net cashflow
- $88
Break-even live
UW: 25.0% down · 7.5% · 30yr · 1.5% tax · 5.0% vac · 8.0% maint · 8.0% mgmt
Financing live
Cash to close
- Down payment
- $37,500
- Closing costs
- $4,500
- Reserves months
- —
- Total cash needed
- —
Loan-product check · same deal, 3 products live
Conventional
25% down · 7.5% · 30yr
- Down + closing
- —
- Monthly P&I
- —
- Monthly cashflow
- —
- DSCR
- —
- Eligible?
- —
Personal DTI + credit; lowest rate.
DSCR
20% down · 8.5% · 30yr
- Down + closing
- —
- Monthly P&I
- —
- Monthly cashflow
- —
- DSCR
- —
- Eligible?
- —
No personal income docs; deal must DSCR.
Hard money
10% down · 12.0% · 12mo
- Down + closing
- —
- Monthly P&I
- —
- Monthly cashflow
- —
- DSCR
- —
- Eligible?
- —
Short-term bridge; refi at stabilization.
Rent comps 26 comps
| Address | Beds | Baths | Sqft | Rent | $/sqft | DOM | Units | Dist |
|---|---|---|---|---|---|---|---|---|
| 1809 N Mangrove St San Juan, TX | 3.0 | 2.0 | 1392 | $1,950 | $1.40 | 19d | 1 | 0.41mi |
| 418 Chula Vista Dr San Juan, TX | 3.0 | 2.0 | 1382 | $1,600 | $1.16 | 43d | 1 | 0.43mi |
| 1709 Calle Tulipan San Juan, TX | 3.0 | 2.0 | 1841 | $1,750 | $0.95 | 43d | 1 | 0.62mi |
| 1109 Del Monte Dr San Juan, TX | 3.0 | 2.0 | 989 | $1,300 | $1.31 | 43d | 1 | 0.65mi |
| 1309 Valle Vista St Unit 3 Alamo, TX | 3.0 | 2.0 | 1050 | $1,250 | $1.19 | 43d | 1 | 0.82mi |
| 1225 Valle Vista St Unit 3 Alamo, TX | 3.0 | 2.0 | 1050 | $1,250 | $1.19 | 43d | 1 | 0.82mi |
| 203 Encino Dr San Juan, TX | 3.0 | 2.0 | 969 | $1,500 | $1.55 | 23d | 1 | 0.91mi |
| 1305 Valle Vista St Unit 4 Alamo, TX | 3.0 | 2.0 | 1050 | $1,300 | $1.24 | 43d | 1 | 0.93mi |
| 204 E Gomez Dr San Juan, TX | 3.0 | 1.5 | 1464 | $1,650 | $1.13 | 14d | 1 | 0.98mi |
| 1225 Valle Vista St Unit 2 Alamo, TX | 3.0 | 2.0 | 1040 | $1,300 | $1.25 | 43d | 1 | 0.99mi |
| 103 E Segment Leonel Trevino Rd Unit C San Juan, TX | 2.0 | 2.0 | 962 | $1,075 | $1.12 | 43d | 1 | 1.04mi |
| 234 W Jaime St San Juan, TX | 2.0 | 1.0 | 1012 | $1,150 | $1.14 | 23d | 1 | 1.12mi |
| 300 W Amy Dr Unit C San Juan, TX | 2.0 | 2.0 | 958 | $995 | $1.04 | 43d | 1 | 1.20mi |
| 1126 Grandeur Dr Alamo, TX | 3.0 | 2.0 | 1482 | $1,800 | $1.21 | 14d | 1 | 1.21mi |
| 1236 N Alamo Rd Alamo, TX | 3.0 | 1.0 | 1368 | $1,250 | $0.91 | 43d | 1 | 1.28mi |
| 217 Rafael Dr Unit 4 San Juan, TX | 2.0 | 2.0 | 1078 | $1,100 | $1.02 | 43d | 1 | 1.32mi |
| 221 Rafael Dr Unit 1 San Juan, TX | 2.0 | 2.0 | 1200 | $1,150 | $0.96 | 43d | 1 | 1.34mi |
| 1203 W Jasmine Ave Alamo, TX | 3.0 | 2.0 | 1588 | $1,500 | $0.94 | 21d | 1 | 1.34mi |
| 400 Rafael Dr Unit 3 San Juan, TX | 2.0 | 2.0 | 969 | $1,100 | $1.14 | 21d | 1 | 1.42mi |
| 404 Rafael Dr Unit 4 San Juan, TX | 3.0 | 2.0 | 1044 | $1,270 | $1.22 | 23d | 1 | 1.42mi |
| 404 Rafael Dr Unit 1 San Juan, TX | 2.0 | 2.0 | 1044 | $1,080 | $1.03 | 43d | 1 | 1.42mi |
| 405 Rafael Dr Apt 2 San Juan, TX | 3.0 | 2.0 | 1200 | $1,250 | $1.04 | 43d | 1 | 1.43mi |
| 740 N Alamo Rd Unit 2 Alamo, TX | 2.0 | 2.0 | 956 | $1,075 | $1.12 | 23d | 1 | 1.44mi |
| 740 N Alamo Rd Unit 2 Alamo, TX | 2.0 | 2.0 | 956 | $1,075 | $1.12 | 43d | 1 | 1.44mi |
| 740 N Alamo Rd Unit 1 Alamo, TX | 2.0 | 2.0 | 956 | $1,200 | $1.26 | 43d | 1 | 1.44mi |
| 1106 Cooper Ln Unit 3 San Juan, TX | 2.0 | 2.0 | 1000 | $1,125 | $1.12 | 43d | 1 | 1.47mi |
Listing history 27 events
-
2026-06-18days on market $150,000 Active 79 DOM
-
2026-06-17days on market $150,000 Active 78 DOM
-
2026-06-16days on market $150,000 Active 77 DOM
-
2026-06-15days on market $150,000 Active 76 DOM
-
2026-06-14days on market $150,000 Active 74 DOM
-
2026-06-13days on market $150,000 Active 73 DOM
-
2026-06-10days on market $150,000 Active 71 DOM
-
2026-06-09days on market $150,000 Active 70 DOM
-
2026-06-08days on market $150,000 Active 69 DOM
-
2026-06-07days on market $150,000 Active 68 DOM
-
2026-06-03days on market $150,000 Active 64 DOM
-
2026-06-02days on market $150,000 Active 63 DOM
-
2026-06-01days on market $150,000 Active 62 DOM
-
2026-05-31days on market $150,000 Active 61 DOM
-
2026-05-31days on market $150,000 Active 60 DOM
-
2026-03-30historical $1,400
Show marketing remark (833 chars)
Come see this charming, cozy home with ample space for everyone to enjoy! This delightful property in San Juan, TX, offers 4 bedrooms, a versatile study/office space, a welcoming living area, dining area, and 2 bathrooms with washer and dryer connections. Surrounded by lush lime, lemon, peach, and orange trees, as well as blooming roses and other mature trees. There’s also a detached guest room in the back yard. Conveniently located within walking distance to Yzaguirre Middle School, close to the Expressway, schools, HEB, Starbucks, The Basilica of Our Lady of San Juan, Panda Express, Top Golf, Costco, Sam’s, Home Depot, hospitals, and more dining and entertainment options. Discover the incredible potential this home holds for you and your family—schedule a showing today! Have a Great & Blessed Day!
-
2026-03-30$150,000 Active 833-char remark
Show marketing remark (833 chars)
Come see this charming, cozy home with ample space for everyone to enjoy! This delightful property in San Juan, TX, offers 4 bedrooms, a versatile study/office space, a welcoming living area, dining area, and 2 bathrooms with washer and dryer connections. Surrounded by lush lime, lemon, peach, and orange trees, as well as blooming roses and other mature trees. There’s also a detached guest room in the back yard. Conveniently located within walking distance to Yzaguirre Middle School, close to the Expressway, schools, HEB, Starbucks, The Basilica of Our Lady of San Juan, Panda Express, Top Golf, Costco, Sam’s, Home Depot, hospitals, and more dining and entertainment options. Discover the incredible potential this home holds for you and your family—schedule a showing today! Have a Great & Blessed Day!
-
2026-02-20$1,400
-
2026-02-14$164,900 Active
-
2025-12-01historical $1,350
-
2025-09-20price $1,350
-
2025-08-18$1,400
-
2025-06-04$164,900 Active
-
2025-04-25price $164,900
-
2025-04-08price $169,900
-
2025-03-14price $174,900
-
2024-11-01$179,000 Active
ⓘ Source: listings_history table (triggers on properties + properties_extension) + one-shot
backfill from property_details.listing_events for pre-trigger history.
Tax reassessment forecast TX · Resets to sale price
- Current annual tax
- $1,921 · $160/mo
- Projected year-2 tax
- $2,745 · $229/mo
- Expected delta
- +$824/yr (+$69/mo · 42.9%)
ⓘ Screening estimate from a state-policy table — verify with the county assessor before closing.
Climate risk First Street
- Flood 4/10 Moderate FEMA zone X (shaded) · 20% chance over 30 yrs
- Wildfire 2/10 Low
- Heat 9/10 Extreme 7 d/yr ≥111°F today · 23 d/yr by 30 yrs out
- Wind 8/10 Severe 99% chance of damaging wind over 30 yrs
- Air quality 1/10 Low 0 unhealthy d/yr today · 0 by 30 yrs out
Nearby sold comps map
Loading sold comps map…
Walkable amenities ~0.75 mi
Loading nearby amenities…
Taxation est. · year 1
- Rental income
- $16,669
- − Mortgage interest
- −$8,402
- − Property taxes
- −$1,921
- − Insurance
- −$750
- − Repairs & maintenance
- −$1,334
- − Management
- −$1,334
- − Depreciation
- −$4,364
- Taxable loss
- −$1,435
- Est. tax savings @ 24.0%
- +$344
- After-tax cash flow
- $1,403/yr
For passive investors: Depreciation is non-cash, so a rental often shows a tax loss while cash-flowing — sheltering income. Rental losses are passive: they offset passive income freely, and up to $25,000/yr can offset ordinary (W-2) income if you actively participate and your MAGI is under $100k (phasing out to $0 by $150k); unused losses carry forward. On sale, claimed depreciation is recaptured at up to 25%, and gains may owe capital-gains tax (a 1031 exchange can defer both). Figures are a year-1 estimate at your 24.0% rate — not tax advice; consult a CPA.
Schools (NCES district)
- District
- Pharr-San Juan-Alamo ISD
- NCES district ID
- 4834860
- Math proficiency
- 18% ▼ -34.00%
- Reading proficiency
- 30% ▼ -11.00%
- Median HH income
- $33,757
- Composite
- 19.63/100
- National rank
- #8744
- State rank
- #740 of 826 in TX
Livability — San Juan
- Score
- 71/100
- State rank
- #294
- US rank
- #6725
Category grades
Schools grade is shown separately in the Schools card above.
Census & demographics
- Census place
- San Juan, TX
- Population (ZIP)
- 39,958
Population outlook (Hidalgo County) Hauer SSP2
- Today (2025)
- 955,232 people
- By 2030
- 1,009,774 · +5.7%
- By 2040
- 1,120,332 · +17.3%
- By 2050
- 1,225,036 · +28.2%
- By 2075
- 1,439,189 · +50.7%
- By 2100
- 1,533,429 · +60.5%
Race, ethnicity, and origin ACS 2023
- Neighborhood character
- Predominantly Hispanic (97%)
- Race & ethnicity
- Hispanic / Latino 97% Two or more races 43% White 3%
- Hispanic origin (detail)
- Mexican 94%
- Foreign-born
- 26% · Canada
- Languages at home
- 18% English-only · Spanish 82%
Political lean MEDSL · Hidalgo
- 2024 margin
- Toss-up / Even · D 48.1% · R 51.0%
- 2008→2024 swing
- -41.6pp toward R · 2008: 38.7pp · 2024: -2.9pp
- All cycles
- 2024: R+2.9 2020: D+17.1 2016: D+40.5 2012: D+41.8 2008: D+38.7
Not yet ingested
- Civics
- —
Market trends
- HPI YoY
- ▼ -32.82%
- Current HPI
- 239.3829
- Rent YoY
- —
- Metro
- —
- State GDP YoY
- ▲ 3.95%
- F500 in state
- 110
Industry mix (Fortune 500 HQ in TX)
| Industry | F500 HQs | Revenue |
|---|---|---|
| Energy | 16 | $1,198B |
|
||
| Technology | 5 | $198B |
|
||
| Engineering / Construction | 4 | $72B |
|
||
| Energy Services | 3 | $60B |
|
||
| Utilities | 3 | $41B |
|
||
| Healthcare | 2 | $330B |
|
||
Price history
-99.2% since first listed12 events — show timeline
- 2026-03-30 Rental Removed $1,400 MCALLENMLS
- 2026-03-30 Listed $150,000 MCALLENMLS
- 2026-02-20 Listed for Rent $1,400 MCALLENMLS
- 2026-02-14 Listed $164,900 MCALLENMLS
- 2025-12-01 Rental Removed $1,350 MCALLENMLS
- 2025-09-20 Price Changed $1,350 MCALLENMLS
- 2025-08-18 Listed for Rent $1,400 MCALLENMLS
- 2025-06-04 Listed $164,900 MCALLENMLS
- 2025-04-25 Price Changed $164,900 MCALLENMLS
- 2025-04-08 Price Changed $169,900 MCALLENMLS
- 2025-03-14 Price Changed $174,900 MCALLENMLS
- 2024-11-01 Listed $179,000 MCALLENMLS
Property tax history
+6.3%/yrLatest (2025): $1,921 · +9.8% YoY. Source: county tax records.
Cash-flow waterfall
monthlySold comps — $/sqft
last 12 mo · ≤1 miLoading sold comps…