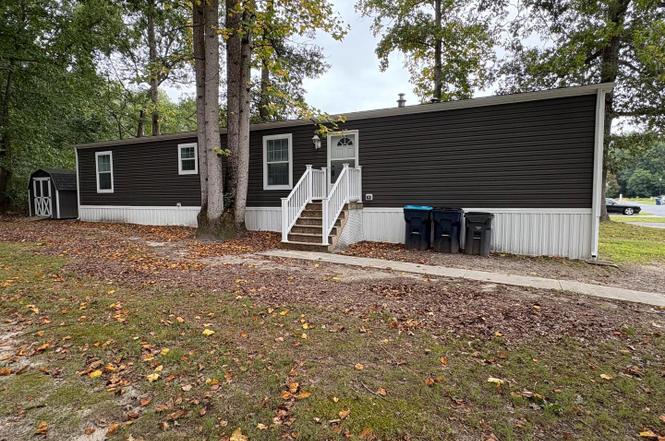
86 Longbow Ln #86 · Hartly, DE
Flood risk No data
- FEMA flood zone
- —
- Chance of flooding over 30 yrs
- —
- Est. flood insurance / yr
- —
Fire risk No data
- Est. fire insurance / yr
- —
Heat risk No data
- Hot days now (above threshold)
- —
- Hot days in 30 yrs
- —
Wind risk No data
- Chance of severe wind over 30 yrs
- —
Air-quality risk No data
- Unhealthy air days now
- —
- Unhealthy air days in 30 yrs
- —
Risk factors via First Street. Map © Google.
Why this score? — see what drove the C+ grade
The composite is a weighted blend of 9 inputs, each scored 0–100. Each bar is that input's sub-score; the figure is the points it added to the 100-point composite (weight × sub-score).
- Cash flow +30.0/30.0
- 1% rule +10.0/10.0
- DSCR +10.0/10.0
- ARV discount +3.4/15.0
- Livability +3.3/5.0
- Rent growth +2.5/5.0
- Condition / age +2.5/5.0
- Schools +2.0/10.0
- Appreciation +0.0/10.0
$84,900
🖨 Deal sheet 📄 Offer letter ✓ Due diligence
Listing remarks
Back to Active, no fault of the seller!! No Rear Neighbors and Excellently maintained this 2-bedroom, 2-bathroom home is located in the quiet wooded setting of Forest Grove in Hartly. This home features an open concept living, dining, kitchen area as well as well as a split floor plan providing ample privacy to both bedrooms. The home also features a full appliance package including the washer and dryer and vinyl flooring throughout. Buyers will need to apply for the community lot lease of $655 per month that includes sewer, trash, recycling, bulk item removal, yard waste removal, and snow plowing. The community also offers a $30 discount every month on the lot lease for prompt, online paym
Key facts
- Vinyl flooring
- No rear neighbors
- Split floor plan
Tags
Neighborhood map
What this means for you Summary
Snapshot
- This is a 2-bed/2.0-bath single-family listed at $85k.
Deal economics
- At list price, monthly cash flow is $579 ($7k/yr) — positive.
- The deal already cash-flows at list — no discount required.
- Meets the 1% rule at list price ($1k rent vs $85k).
- Recommended offer: $75k (12.0% below list) — sets the bar for market timing.
Location & tenants
- Location reads 66/100 on livability (#42 in DE) — a middle-class / working-renter tenant base. Strengths: employment A+, cost of living A+; Watch: crime D+, housing D, amenities F.
- Capital School District (urban): math 14% / reading 31% proficiency, ranked #24 of 26 in DE (top 92%) — low school quality limits family demand, transient renter base, plan for 1-2y turnover.
- Market conditions: 17 active listings in the ZIP; 2 comparable units currently listed for rent nearby; 1,201 units permitted in Kent County in 2024 (116 in 5+ unit buildings).
Forward outlook
- Local home prices are declining (-3.0%/yr); year-one equity from $587 of loan paydown is wiped out by about $3k of value loss. Plan a longer hold.
- Kent County population projected at +22% by 2050 — long-run rental-demand tailwind backs the buy-and-hold thesis.
- At projected returns (-3.0% appreciation + 3.0% rent growth), your $24k cash investment doubles in ~5 years — after that, you're playing with house money.
Negotiation context
- It's been on market 197 days — a 12% lower offer ($75k) is reasonable based on typical stale-listing flexibility.
- 2 sale attempts; this cycle's ask is 5656% above the opening price — seller raised mid-cycle; expect resistance to lowballs.
Questions for the listing agent
- It's been on market 197 days. Have you received any prior offers? Is the seller open to a 12% concession, seller financing, or rate buy-down credit?
- Why hasn't it sold? Are there any deal-killer items the seller is aware of (foundation, flood, title, zoning, code violations)?
- Is there a deadline driving the sale (1031 exchange, divorce, estate, relocation)? That informs how much negotiation room exists.
- Crime grade is D in this area — have there been break-ins, vandalism, or insurance claims at this property in the last 3 years? What carrier currently insures it and at what premium?
- What's the average days-on-market for RENTAL listings here right now (not sales)? A rising rental-DOM trend means longer vacancies and softer asking-rent achievability than the comps imply.
- What's the recent tenant-quality profile in this submarket — average credit score on applications, eviction rate, late-payment / NSF rate, and stable-employment percentage? A property-management company in the area should have these aggregated.
- How much new for-sale + rental construction is in the pipeline within 1–3 miles? Heavy new supply typically softens prices + rents 12–24 months out; constrained supply supports both.
Investment metrics
- 1% rule
- 1.74% ✓
- Cap rate
- 14.47%
- Cash-on-cash
- 29.20%
- DSCR
- 2.30
- GRM
- 4.8
CMA / ARV
- ARV (on-the-fly)
- $77,824
- Comps found
- 7
Show comp detail 7 sales within ~0.75 mi
| Address | Dist | Beds/Ba | Sqft | Sold | Price | $/sf | Match |
|---|---|---|---|---|---|---|---|
| 74 Longbow Ln | 0.07mi | 2/2.0 | 1,024 (0%) | 15mo | $78,000 | $76 | 84 |
| 75 Longbow Dr | 0.03mi | 2/2.0 | 1,024 (0%) | 20mo | $77,500 | $76 | 82 |
| 5 Sherwood Forest Way #5 | 0.31mi | 2/2.0 | 1,024 (0%) | 8mo | $89,000 | $87 | 78 |
| 117 Sherwood Forest Way | 0.26mi | 2/2.0 | 1,024 (0%) | 14mo | $76,000 | $74 | 76 |
| 27 Loxley Ln #27 | 0.16mi | 2/2.0 | 1,024 (0%) | 22mo | $65,000 | $63 | 74 |
| 107 Longbow Ln #107 | 0.01mi | 3/2.0 (+1) | 1,056 (+3%) | 24mo | $75,000 | $71 | 70 |
| 161 Blue Bird Dr | 0.11mi | 3/1.0 (+1) | 937 (-8%) | 16mo | $223,000 | $238 | 58 |
Match score weights: distance 35% · size 25% · config 20% · recency 20%. Top-matched comps best support the ARV.
Projected returns pro-forma
-3.0% appreciation · 3.0% rent growth · sell at horizon
- IRR
- 23.6%
- Equity multiple
- 1.97×
- Total profit
- $23,111
- Equity at exit
- $12,659
- IRR
- 31.5%
- Equity multiple
- 3.85×
- Total profit
- $67,661
- Equity at exit
- $7,341
Cash invested: $23,772 (down + closing). Projections, not guarantees.
Landlord ↔ Tenant lean methodology
- Overall (STATE)
- 70 Landlord-Friendly
- State Delaware
- 70 Landlord-Friendly · D+7
- County
- — inherits STATE
- City
- — inherits STATE
ZIP-level market 19953
- Home prices YoY
- -22.6%
- Active inventory
- 17
- Price-to-rent
- 4.8×
Monthly cashflow live
- Estimated rent
- $1,475 medium interval (Pro) →
- Mortgage (P&I)
- −$445
- Tax est. 1.5%
- −$106 /mo · $1,274/yr
- Insurance
- −$35
- HOA
- −$0
- Vacancy / Maint / Mgmt
- −$310
- Net cashflow
- $579
Break-even live
UW: 25.0% down · 7.5% · 30yr · 1.5% tax · 5.0% vac · 8.0% maint · 8.0% mgmt
Financing live
Cash to close
- Down payment
- $21,225
- Closing costs
- $2,547
- Reserves months
- —
- Total cash needed
- —
Loan-product check · same deal, 3 products live
Conventional
25% down · 7.5% · 30yr
- Down + closing
- —
- Monthly P&I
- —
- Monthly cashflow
- —
- DSCR
- —
- Eligible?
- —
Personal DTI + credit; lowest rate.
DSCR
20% down · 8.5% · 30yr
- Down + closing
- —
- Monthly P&I
- —
- Monthly cashflow
- —
- DSCR
- —
- Eligible?
- —
No personal income docs; deal must DSCR.
Hard money
10% down · 12.0% · 12mo
- Down + closing
- —
- Monthly P&I
- —
- Monthly cashflow
- —
- DSCR
- —
- Eligible?
- —
Short-term bridge; refi at stabilization.
Rent comps 2 comps
| Address | Beds | Baths | Sqft | Rent | $/sqft | DOM | Units | Dist |
|---|---|---|---|---|---|---|---|---|
| 80 Longbow Ln Hartly, DE | 2.0 | 2.0 | 1024 | $1,475 | $1.44 | 1d | 1 | 0.05mi |
| 22 Loxley Ln Unit 22 Hartly, DE | 2.0 | 2.0 | 1056 | $1,475 | $1.40 | 12d | 1 | 0.15mi |
Listing history 9 events
-
2026-06-19days on market $84,900 Active 197 DOM
-
2026-06-18days on market $84,900 Active 196 DOM
-
2026-06-17days on market $84,900 Active 195 DOM
-
2026-06-17status $84,900 Active 194 DOM
-
2026-03-23status Pending
-
2026-01-14historical $1,475
-
2026-01-13price $84,900
-
2025-11-11$1,475
-
2025-09-10$85,000 Active
ⓘ Source: listings_history table (triggers on properties + properties_extension) + one-shot
backfill from property_details.listing_events for pre-trigger history.
Nearby sold comps map
Loading sold comps map…
Walkable amenities ~0.75 mi
Loading nearby amenities…
Taxation est. · year 1
- Rental income
- $17,700
- − Mortgage interest
- −$4,756
- − Property taxes
- −$1,274
- − Insurance
- −$424
- − Repairs & maintenance
- −$1,416
- − Management
- −$1,416
- − Depreciation
- −$2,470
- Taxable income
- $5,944
- Est. tax owed @ 24.0%
- −$1,427
- After-tax cash flow
- $5,516/yr
For passive investors: Depreciation is non-cash, so a rental often shows a tax loss while cash-flowing — sheltering income. Rental losses are passive: they offset passive income freely, and up to $25,000/yr can offset ordinary (W-2) income if you actively participate and your MAGI is under $100k (phasing out to $0 by $150k); unused losses carry forward. On sale, claimed depreciation is recaptured at up to 25%, and gains may owe capital-gains tax (a 1031 exchange can defer both). Figures are a year-1 estimate at your 24.0% rate — not tax advice; consult a CPA.
Schools (NCES district)
- District
- Capital School District
- NCES district ID
- 1000190
- Math proficiency
- 14% ▼ -17.00%
- Reading proficiency
- 31% ▼ -12.00%
- Median HH income
- $48,499
- Composite
- 19.78/100
- National rank
- #8703
- State rank
- #24 of 26 in DE
Livability — Hartly
- Score
- 66/100
- State rank
- #42
- US rank
- #11882
Category grades
Schools grade is shown separately in the Schools card above.
Census & demographics
- Population (ZIP)
- 4,614
Population outlook (Kent County) Hauer SSP2
- Today (2025)
- 194,477 people
- By 2030
- 204,351 · +5.1%
- By 2040
- 222,135 · +14.2%
- By 2050
- 236,483 · +21.6%
- By 2075
- 266,327 · +36.9%
- By 2100
- 275,335 · +41.6%
Race, ethnicity, and origin ACS 2023
- Neighborhood character
- Predominantly White (78%)
- Race & ethnicity
- White 78% Two or more races 15% Hispanic / Latino 7% Black 5% Native American 1%
- Hispanic origin (detail)
- Salvadoran 6%
- Common ancestry
- Romanian 8% Polish 5% Lithuanian 5%
- Foreign-born
- 4% · Canada, Dominican Republic
- Languages at home
- 81% English-only · German/W. Germanic 10% Spanish 9% Korean 1%
Political lean MEDSL · Kent
- 2024 margin
- Toss-up / Even · D 50.2% · R 48.2% · Other 1.7%
- 2008→2024 swing
- -7.8pp toward R · 2008: 9.8pp · 2024: 2.0pp
- All cycles
- 2024: D+2.0 2020: D+4.1 2016: R+4.9 2012: D+4.9 2008: D+9.8
Not yet ingested
- Civics
- —
Market trends
- HPI YoY
- ▼ -62.76%
- Current HPI
- 215.3065
- Rent YoY
- —
- Metro
- —
- State GDP YoY
- —
- F500 in state
- 0
Price history
-98.3% since first listed5 events — show timeline
- 2026-03-23 Pending — BRIGHT MLS
- 2026-01-14 Rental Removed $1,475 BRIGHTMLS
- 2026-01-13 Price Changed $84,900 BRIGHT MLS
- 2025-11-11 Listed for Rent $1,475 BRIGHTMLS
- 2025-09-10 Listed $85,000 BRIGHT MLS
Cash-flow waterfall
monthlySold comps — $/sqft
last 12 mo · ≤1 miLoading sold comps…