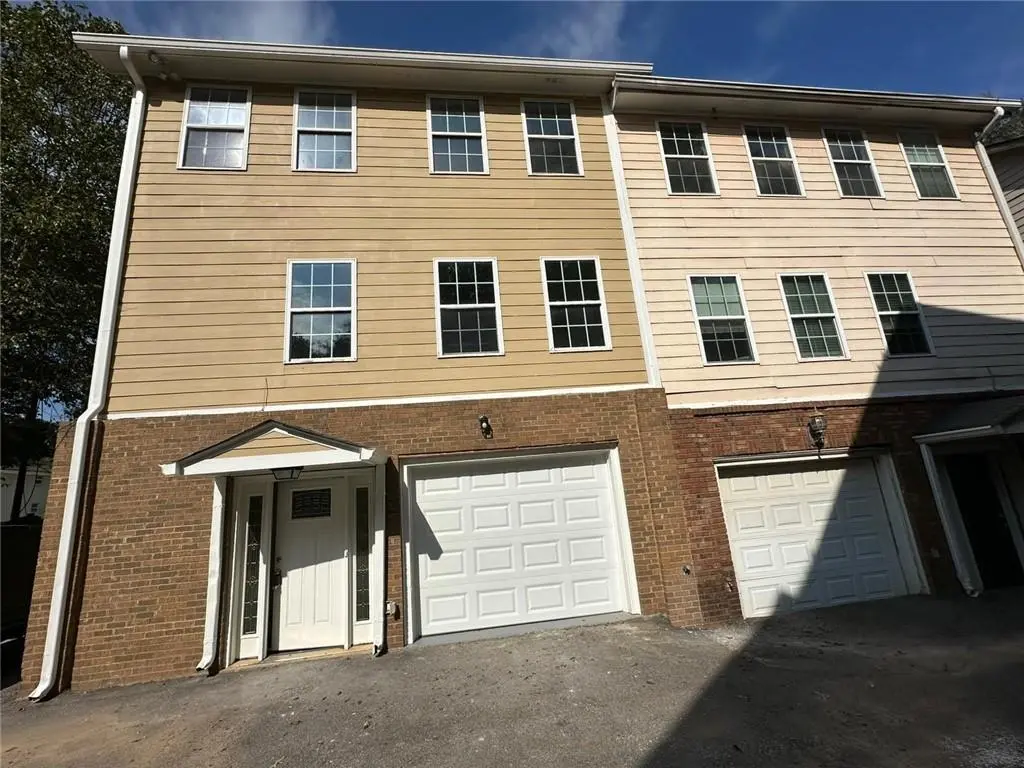
2417 Perry Blvd NW #1 · Atlanta, GA
Flood risk 5/10 · Moderate
- FEMA flood zone
- X (unshaded)
- Chance of flooding over 30 yrs
- 0.24%
- Est. flood insurance / yr
- $473 – $860
Fire risk 3/10 · Minor
- Est. fire insurance / yr
- $963 – $1,789
Heat risk 5/10 · Moderate
- Hot days now (above 104°F)
- 7 days/yr
- Hot days in 30 yrs
- 17 days/yr
Wind risk 5/10 · Moderate
- Chance of severe wind over 30 yrs
- 25.0%
Air-quality risk 4/10 · Minor
- Unhealthy air days now
- 3 days/yr
- Unhealthy air days in 30 yrs
- 5 days/yr
Risk factors via First Street. Map © Google.
Why this score? — see what drove the C- grade
The composite is a weighted blend of 9 inputs, each scored 0–100. Each bar is that input's sub-score; the figure is the points it added to the 100-point composite (weight × sub-score).
- ARV discount +15.0/15.0
- Cash flow +14.6/30.0
- DSCR +4.5/10.0
- Livability +4.2/5.0
- 1% rule +3.5/10.0
- Rent growth +3.3/5.0
- Schools +2.7/10.0
- Condition / age +2.5/5.0
- Appreciation +0.0/10.0
$349,900
🖨 Deal sheet 📄 Offer letter ✓ Due diligence
Listing remarks MLS
*NEW INTERIOR PAINT*NEW WHITE KITCHEN WITH STAINLESS STEEL APPLIANCES *FULL BASEMENT* ALL NEW UPGRADED LIGHT FIXTURES*NEW FLOORING*END UNIT* A MUST SEE!!!
Key facts
- New white kitchen
- New flooring
- Full basement
Tags
Neighborhood map
What this means for you Summary
Snapshot
- This is a 3-bed/3.5-bath condo listed at $350k.
Deal economics
- At list price, monthly cash flow is $85 ($1k/yr) — positive.
- The deal already cash-flows at list — no discount required.
- To meet the 1% rule (rent ≥ 1% of price), the offer needs to be $296k (15.4% below list).
- Recommended offer: $296k (15.4% below list) — sets the bar for 1% rule.
- Cap rate 6.6% vs local median 3.1% in Atlanta — top-decile yield for the area; either an underpriced asset or a hidden risk that comps aren't pricing in. Stress-test before assuming the spread holds.
Location & tenants
- Location reads 83/100 on livability (#6 in GA, #919 nationally) — a professional / high-income tenant draw. Strengths: amenities A+, commute A+, housing A+; Watch: schools C-, cost of living C-.
- Atlanta Public Schools (urban): math 28% / reading 35% proficiency, ranked #80 of 174 in GA (top 46%) — families likely to look elsewhere, expect single-tenant / working-renter base with shorter leases; 71% free/reduced lunch — lower-income household profile, screen leases tightly.
- Market conditions: Rents rising (+3.3%/yr); 722 active listings in the ZIP; 27 comparable units currently listed for rent nearby; rentals leasing fast (median 8d on market — plan ~1-2 weeks tenant-placement turnaround); solid renter incomes; 11,565 units permitted in Fulton County in 2024 (8,159 in 5+ unit buildings).
- This rent runs 43% of the median local income ($83k/yr) — at the standard rent-burdened threshold; future hikes will face affordability resistance.
Forward outlook
- Local home prices are declining (-3.0%/yr); year-one equity from $2k of loan paydown is wiped out by about $10k of value loss. Plan a longer hold.
- Fulton County population projected at +38% by 2050 — long-run rental-demand tailwind backs the buy-and-hold thesis.
Negotiation context
- It's been on market 282 days — a 12% lower offer ($308k) is reasonable based on typical stale-listing flexibility.
- 2 sale attempts with the ask held roughly flat each time — persistent listings suggest the price (not the market) is what's stuck; bring a comps-based counter.
Risks & watch-outs
- Climate carrying-cost: moderate flood risk; moderate wind risk, 25% chance of damaging wind over 30y; extreme-heat days projected 7→17/yr by 2055 (HVAC capex compounding) — expect insurance premiums to compound above CPI over the hold.
Questions for the listing agent
- It's been on market 282 days. Have you received any prior offers? Is the seller open to a 15% concession, seller financing, or rate buy-down credit?
- Any open or pending special assessments — roof, HVAC, plumbing, elevator, façade? What's the per-unit balance and payoff schedule, and is the seller paying it off at close or rolling it to the buyer?
- Why hasn't it sold? Are there any deal-killer items the seller is aware of (foundation, flood, title, zoning, code violations)?
- Is there a deadline driving the sale (1031 exchange, divorce, estate, relocation)? That informs how much negotiation room exists.
- What's the average days-on-market for RENTAL listings here right now (not sales)? A rising rental-DOM trend means longer vacancies and softer asking-rent achievability than the comps imply.
- What's the recent tenant-quality profile in this submarket — average credit score on applications, eviction rate, late-payment / NSF rate, and stable-employment percentage? A property-management company in the area should have these aggregated.
- How much new apartment / multifamily construction is in the pipeline within 1–3 miles? Heavy new supply (>2% of stock underway) typically softens rents 12–24 months out; light construction supports rent growth.
Investment metrics
- 1% rule
- 0.85% ✗
- Cap rate
- 6.58%
- Cash-on-cash
- 1.04%
- DSCR
- 1.05
- GRM
- 9.9
CMA / ARV
- ARV (median comp)
- $494,920
- List price
- $349,900
- Delta
- -29.30%
- Verdict
- UNDERPRICED
- Comps
- 20 within 1.0 mi
Projected returns pro-forma
-3.0% appreciation · 3.26% rent growth · sell at horizon
- IRR
- -14.4%
- Equity multiple
- 0.48×
- Total profit
- $-50,560
- Equity at exit
- $52,171
- IRR
- -5.3%
- Equity multiple
- 0.65×
- Total profit
- $-34,076
- Equity at exit
- $30,253
Cash invested: $97,972 (down + closing). Projections, not guarantees.
Landlord ↔ Tenant lean methodology
- Overall (STATE)
- 90 Strongly Landlord-Friendly
- State Georgia
- 90 Strongly Landlord-Friendly · R+3
- County
- — inherits STATE
- City
- — inherits STATE
ZIP-level market 30318
- Rents YoY
- 3.3%
- Active inventory
- 722
- Price-to-rent
- 9.9×
Monthly cashflow live
- Estimated rent
- $2,960 high interval (Pro) →
- Mortgage (P&I)
- −$1,835
- Tax from tax record
- −$273 /mo · $3,273/yr
- Insurance
- −$146
- HOA
- −$0
- Vacancy / Maint / Mgmt
- −$622
- Net cashflow
- $85
Break-even live
UW: 25.0% down · 7.5% · 30yr · 1.5% tax · 5.0% vac · 8.0% maint · 8.0% mgmt
Financing live
Cash to close
- Down payment
- $87,475
- Closing costs
- $10,497
- Reserves months
- —
- Total cash needed
- —
Loan-product check · same deal, 3 products live
Conventional
25% down · 7.5% · 30yr
- Down + closing
- —
- Monthly P&I
- —
- Monthly cashflow
- —
- DSCR
- —
- Eligible?
- —
Personal DTI + credit; lowest rate.
DSCR
20% down · 8.5% · 30yr
- Down + closing
- —
- Monthly P&I
- —
- Monthly cashflow
- —
- DSCR
- —
- Eligible?
- —
No personal income docs; deal must DSCR.
Hard money
10% down · 12.0% · 12mo
- Down + closing
- —
- Monthly P&I
- —
- Monthly cashflow
- —
- DSCR
- —
- Eligible?
- —
Short-term bridge; refi at stabilization.
Rent comps 27 comps
| Address | Beds | Baths | Sqft | Rent | $/sqft | DOM | Units | Dist |
|---|---|---|---|---|---|---|---|---|
| 2591 Ocean Walk Dr NW Atlanta, GA | 2.0 | 3.5 | 1998 | $2,650 | $1.33 | 24d | 1 | 0.41mi |
| 2585 Ocean Dr NW Atlanta, GA | 2.0 | 3.5 | 1998 | $2,550 | $1.28 | 24d | 1 | 0.48mi |
| 2493 Sycamore Rd NW #4 Atlanta, GA | 3.0 | 3.5 | 1848 | $3,400 | $1.84 | 7d | 1 | 0.53mi |
| 2011 Oak Ln NW Atlanta, GA | 3.0 | 3.5 | 1848 | $3,200 | $1.73 | 17d | 1 | 0.54mi |
| 1673 Jackson Sq NW Atlanta, GA | 3.0 | 3.0 | 2088 | $2,300 | $1.10 | 7d | 1 | 0.74mi |
| 1422 Creekside Cir NW Unit 211 Atlanta, GA | 2.0 | 2.5 | 1573 | $2,500 | $1.59 | 2d | 1 | 0.92mi |
| 2635 Creekside Dr NW Atlanta, GA | 2.0 | 2.5 | 1573 | $2,635 | $1.68 | 1d | 1 | 0.94mi |
| 1445 Creekside Cir NW Atlanta, GA | 4.0 | 3.5 | 2425 | $6,500 | $2.68 | 3d | 1 | 0.95mi |
| 1445 Creekside Cir NW Atlanta, GA | 4.0 | 3.5 | 2425 | $6,500 | $2.68 | 5d | 1 | 0.95mi |
| 1359 Creek View Ln NW Atlanta, GA | 3.0 | 2.5 | 2129 | $3,000 | $1.41 | 24d | 1 | 0.98mi |
| 2011 Springfield Rd Atlanta, GA | 3.0 | 2.5 | 1528 | $3,000 | $1.96 | 5d | 1 | 1.01mi |
| 2713 Creek View Ter NW Atlanta, GA | 4.0 | 3.5 | 2129 | $2,999 | $1.41 | 7d | 1 | 1.04mi |
| 1740 Bolton Rd NW Atlanta, GA | 3.0 | 3.0 | 2208 | $2,900 | $1.31 | 24d | 1 | 1.06mi |
| 2676 Creek View Ter NW Atlanta, GA | 3.0 | 2.5 | 2383 | $3,100 | $1.30 | 4d | 1 | 1.06mi |
| 1763 Stone Hedge Dr NW Atlanta, GA | 3.0 | 2.5 | 2108 | $3,173 | $1.51 | 24d | 1 | 1.19mi |
| 1769 Sanford Dr NW Atlanta, GA | 3.0 | 2.5 | 2200 | $3,200 | $1.45 | 24d | 1 | 1.21mi |
| 1409 Northwest Dr NW Unit 1 Atlanta, GA | 4.0 | 2.5 | 2500 | $2,599 | $1.04 | 2d | 1 | 1.21mi |
| 1409 Northwest Dr NW Atlanta, GA | 4.0 | 2.5 | 2000 | $2,998 | $1.50 | 24d | 1 | 1.21mi |
| 2456 Spring St NW Apt A Atlanta, GA | 4.0 | 2.5 | 1650 | $1,450 | $0.88 | 24d | 1 | 1.22mi |
| 1127 2nd NW Atlanta, GA | 4.0 | 2.5 | 2000 | $3,240 | $1.62 | 24d | 1 | 1.33mi |
| 1127 2nd NW Atlanta, GA | 4.0 | 2.5 | 2000 | $3,240 | $1.62 | 14d | 1 | 1.33mi |
| 2265 Marietta Blvd NW Atlanta, GA | 3.0 | 1.0–2.0 | 1018 | $2,585 | $2.54 | 2d | 28 | 1.41mi |
| 2711 Stream Valley Ln NW Atlanta, GA | 4.0 | 3.5 | 2445 | $3,200 | $1.31 | 7d | 1 | 1.42mi |
| 1120 Wedgewood Dr NW Atlanta, GA | 4.0 | 2.5 | 1904 | $3,100 | $1.63 | 7d | 1 | 1.43mi |
| 903 Proctor Ranch Dr Unit 903 Atlanta, GA | 4.0 | 3.5 | 2470 | $2,800 | $1.13 | 12d | 1 | 1.44mi |
| 2367 Summit Ave NW Atlanta, GA | 4.0 | 2.5 | 1887 | $2,800 | $1.48 | 1d | 1 | 1.45mi |
| 821 Westmoreland Cir NW Atlanta, GA | 2.0 | 2.5 | 2090 | $2,850 | $1.36 | 24d | 1 | 1.49mi |
HOA detail condo
- Monthly dues
- $0 · $0/yr
- Assessments
- None detected in remarks — confirm with the listing agent.
Listing history 16 events
-
2026-06-18days on market $349,900 Active 282 DOM
-
2026-06-17days on market $349,900 Active 281 DOM
-
2026-06-16days on market $349,900 Active 280 DOM
-
2026-06-15days on market $349,900 Active 279 DOM
-
2026-06-13days on market $349,900 Active 277 DOM
-
2026-06-13days on market $349,900 Active 276 DOM
-
2026-06-09days on market $349,900 Active 273 DOM
-
2026-06-08days on market $349,900 Active 272 DOM
-
2026-06-07days on market $349,900 Active 271 DOM
-
2026-06-04days on market $349,900 Active 268 DOM
-
2026-06-03days on market $349,900 Active 267 DOM
-
2026-06-02days on market $349,900 Active 266 DOM
-
2026-06-01days on market $349,900 Active 265 DOM
-
2026-05-31days on market $349,900 Active 264 DOM
-
2025-09-09$349,900 New 154-char remark
Show marketing remark (154 chars)
*NEW INTERIOR PAINT*NEW WHITE KITCHEN WITH STAINLESS STEEL APPLIANCES *FULL BASEMENT* ALL NEW UPGRADED LIGHT FIXTURES*NEW FLOORING*END UNIT* A MUST SEE!!!
-
2025-09-09$349,900 Active 154-char remark
Show marketing remark (154 chars)
*NEW INTERIOR PAINT*NEW WHITE KITCHEN WITH STAINLESS STEEL APPLIANCES *FULL BASEMENT* ALL NEW UPGRADED LIGHT FIXTURES*NEW FLOORING*END UNIT* A MUST SEE!!!
ⓘ Source: listings_history table (triggers on properties + properties_extension) + one-shot
backfill from property_details.listing_events for pre-trigger history.
Tax reassessment forecast GA · Resets to sale price
- Current annual tax
- $3,273 · $273/mo
- Projected year-2 tax
- $3,273 · $273/mo
- Expected delta
- $0/yr ($0/mo · 0.0%)
ⓘ Screening estimate from a state-policy table — verify with the county assessor before closing.
Climate risk First Street
- Flood 5/10 Major FEMA zone X (unshaded) · 24% chance over 30 yrs
- Wildfire 3/10 Moderate
- Heat 5/10 Major 7 d/yr ≥104°F today · 17 d/yr by 30 yrs out
- Wind 5/10 Major 25% chance of damaging wind over 30 yrs
- Air quality 4/10 Moderate 3 unhealthy d/yr today · 5 by 30 yrs out
Nearby sold comps map
Loading sold comps map…
Walkable amenities ~0.75 mi
Loading nearby amenities…
Taxation est. · year 1
- Rental income
- $35,522
- − Mortgage interest
- −$19,600
- − Property taxes
- −$3,273
- − Insurance
- −$1,750
- − Repairs & maintenance
- −$2,842
- − Management
- −$2,842
- − Depreciation
- −$10,179
- Taxable loss
- −$4,963
- Est. tax savings @ 24.0%
- +$1,191
- After-tax cash flow
- $2,212/yr
For passive investors: Depreciation is non-cash, so a rental often shows a tax loss while cash-flowing — sheltering income. Rental losses are passive: they offset passive income freely, and up to $25,000/yr can offset ordinary (W-2) income if you actively participate and your MAGI is under $100k (phasing out to $0 by $150k); unused losses carry forward. On sale, claimed depreciation is recaptured at up to 25%, and gains may owe capital-gains tax (a 1031 exchange can defer both). Figures are a year-1 estimate at your 24.0% rate — not tax advice; consult a CPA.
Schools (NCES district)
- District
- Atlanta Public Schools
- NCES district ID
- 1300120
- Math proficiency
- 28% ▼ -6.00%
- Reading proficiency
- 35% ▼ -2.00%
- Median HH income
- $48,306
- Composite
- 27.27/100
- National rank
- #7006
- State rank
- #80 of 174 in GA
Livability — Atlanta
- Score
- 83/100
- State rank
- #6
- US rank
- #919
Category grades
Schools grade is shown separately in the Schools card above.
Census & demographics
- Census place
- Atlanta, GA
- County
- Fulton County · 1,094,430 people
- City population
- 629,525
- Metro
- Atlanta-Sandy Springs-Alpharetta, GA
- Population (ZIP)
- 59,609
- Household income
- $83,116
- Rent vs Own
- Severe rent burden
- 4182.0
Population outlook (Fulton County) Hauer SSP2
- Today (2025)
- 1,203,707 people
- By 2030
- 1,299,706 · +8.0%
- By 2040
- 1,488,256 · +23.6%
- By 2050
- 1,664,580 · +38.3%
- By 2075
- 2,036,072 · +69.2%
- By 2100
- 2,222,402 · +84.6%
Race, ethnicity, and origin ACS 2023
- Neighborhood character
- Diverse neighborhood (Simpson 0.63)
- Race & ethnicity
- Black 49% White 35% Hispanic / Latino 7% Two or more races 6% Asian 5%
- Hispanic origin (detail)
- Mexican 2% Puerto Rican 1%
- Common ancestry
- Lithuanian 2% Slovak 2% Romanian 1%
- Foreign-born
- 8% · Canada, China, South Korea
- Languages at home
- 88% English-only · Spanish 4% Other Indo-European 2% Other Asian/Pacific 1%
Political lean MEDSL · Fulton
- 2024 margin
- Solid D (+44.9) · D 71.9% · R 27.0% · Other 1.1%
- 2008→2024 swing
- +9.8pp toward D · 2008: 35.0pp · 2024: 44.9pp
- All cycles
- 2024: D+44.9 2020: D+46.4 2016: D+42.1 2012: D+29.6 2008: D+35.0
Not yet ingested
- Civics
- —
Market trends
- HPI YoY
- ▼ -470.82%
- Current HPI
- 224.1493
- Rent YoY
- ▲ 3.26%
- Metro
- Atlanta-Sandy Springs-Alpharetta, GA
- State GDP YoY
- ▲ 2.66%
- F500 in state
- 28
Industry mix (Fortune 500 HQ in GA)
| Industry | F500 HQs | Revenue |
|---|---|---|
| Paper / Packaging | 2 | $29B |
|
||
| Retail | 1 | $160B |
|
||
| Transportation / Logistics | 1 | $91B |
|
||
| Airlines | 1 | $62B |
|
||
| Consumer Goods | 1 | $47B |
|
||
| Utilities | 1 | $25B |
|
||
Price history
+0.0% since first listed2 events — show timeline
- 2025-09-09 Listed $349,900 FMLS
- 2025-09-09 Listed $349,900 GAMLS
Property tax history
-1.9%/yrLatest (2025): $3,273 · +182.9% YoY. Source: county tax records.
Cash-flow waterfall
monthlySold comps — $/sqft
last 12 mo · ≤1 miLoading sold comps…