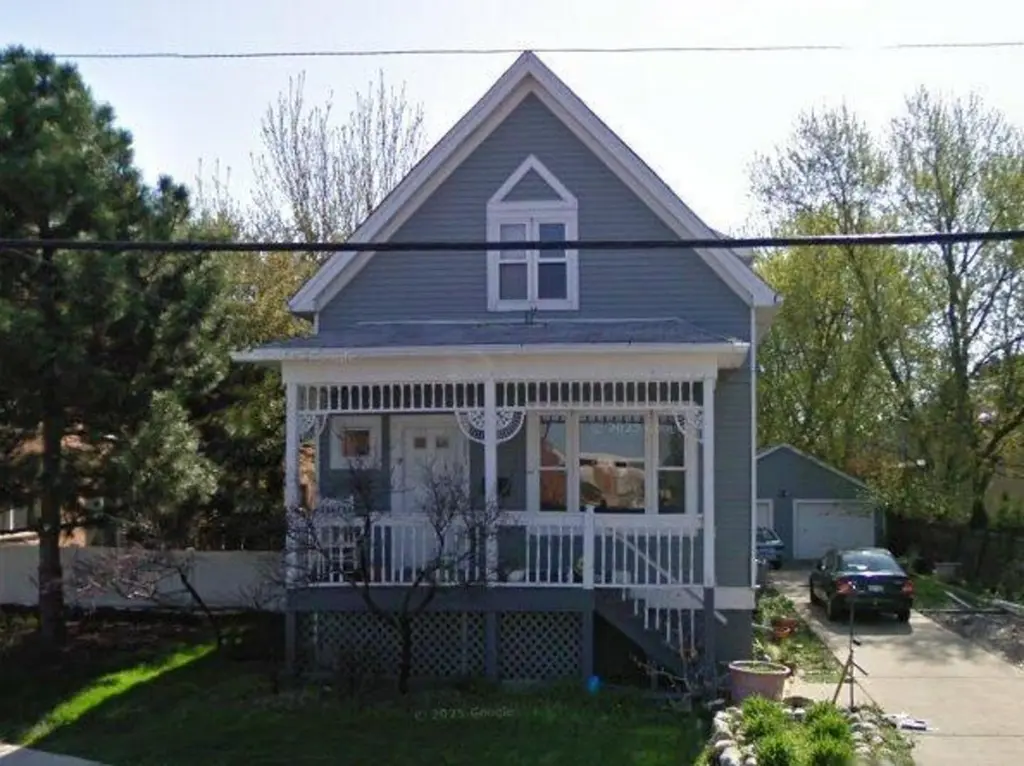
7001 Carpenter Rd · Skokie, IL
Flood risk 1/10 · Minimal
- FEMA flood zone
- X (unshaded)
- Chance of flooding over 30 yrs
- 0.0%
- Est. flood insurance / yr
- $507 – $1,088
Fire risk 1/10 · Minimal
- Est. fire insurance / yr
- $804 – $1,492
Heat risk 3/10 · Minor
- Hot days now (above 99°F)
- 7 days/yr
- Hot days in 30 yrs
- 14 days/yr
Wind risk 2/10 · Minimal
- Chance of severe wind over 30 yrs
- —
Air-quality risk 4/10 · Minor
- Unhealthy air days now
- 6 days/yr
- Unhealthy air days in 30 yrs
- 7 days/yr
Risk factors via First Street. Map © Google.
Why this score? — see what drove the C- grade
The composite is a weighted blend of 9 inputs, each scored 0–100. Each bar is that input's sub-score; the figure is the points it added to the 100-point composite (weight × sub-score).
- ARV discount +15.0/15.0
- Cash flow +14.0/30.0
- Schools +5.0/10.0
- 1% rule +4.4/10.0
- DSCR +4.2/10.0
- Livability +4.1/5.0
- Rent growth +3.6/5.0
- Condition / age +2.5/5.0
- Appreciation +0.0/10.0
$350,000
🖨 Deal sheet (PDF) 📄 Offer letter ✓ Due diligence
Listing remarks
Spacious 4 bedroom, 2 bath home in Skokie with tons of potential! Ideal for investors or rehab buyers-bring your vision and make it your own. Property is being sold AS-IS, WHERE-IS.
Key facts
- 6,250 sq ft lot
- 2 garage spots
- Built 1912
Property features AI
Finance
- Other: Ownership: Fee simple; Possession at closing; Holds earnest money
- HOA & community: No master association fee required
Exterior
- Parking: Detached garage (2 spaces, 2 total parking)
- Utilities: Public water; Public sewer
- Home design: Detached single-family home; 2-story
- Construction: Frame construction; Built over 100 years ago; Built before 1978
- Exterior features: Lot dimensions approximately 50 x 125; Lot under 0.25 acre; Directions: From Dempster St, head north on Carpenter Rd; property is on the east side of the street at 7001 Carpenter Rd.
Interior
- Kitchen: Kitchen on main level (12 x 14)
- Bedrooms: 4 bedrooms; Master bedroom on second level (12 x 10); Second bedroom on second level (12 x 12); Third bedroom on second level (12 x 12); Fourth bedroom on second level (25 x 40)
- Bathrooms: 2 full bathrooms
- Heating & cooling: Natural gas heating; Central air conditioning
- Interior features: 6 total rooms; Unfinished full basement
- Laundry & utility: Laundry room
Neighborhood map
What this means for you Summary
Snapshot
- This is a 4-bed/1.5-bath single-family listed at $350k.
Deal economics
- At list price, monthly cash flow is $45 ($542/yr) — positive.
- The deal already cash-flows at list — no discount required.
- To meet the 1% rule (rent ≥ 1% of price), the offer needs to be $327k (6.5% below list).
- Recommended offer: $327k (6.5% below list) — sets the bar for 1% rule.
- Cap rate 6.4% vs local median 3.2% in Skokie — top-decile yield for the area; either an underpriced asset or a hidden risk that comps aren't pricing in. Stress-test before assuming the spread holds.
Location & tenants
- Location reads 82/100 on livability (#74 in IL, #1,213 nationally) — a professional / high-income tenant draw. Strengths: amenities A+, commute A+, employment A+; Watch: health & safety C-, cost of living D.
- Market conditions: Rents rising fast (+4.4%/yr); 1 active listings in the ZIP; 1 comparable units currently listed for rent nearby; solid renter incomes; 6,272 units permitted in Cook County in 2024 (4,658 in 5+ unit buildings).
- At $3,273/mo this rent would consume 50% of the median local household income ($79k/yr) (locally 1316% of renters already pay >50% of income on rent) — very limited rent-growth headroom before tenants either downsize or default.
Forward outlook
- Local home prices are declining (-3.0%/yr); year-one equity from $2k of loan paydown is wiped out by about $10k of value loss. Plan a longer hold.
Negotiation context
- It's been on market 32 days — a 3% lower offer ($340k) is reasonable based on typical stale-listing flexibility.
- Current owner paid $250k; 40% above their basis — modest negotiation headroom, anchor on the comps not their cost.
Risks & watch-outs
- Watch-outs: built in 1912 — expect roof / HVAC / electrical / plumbing capex.
Questions for the listing agent
- It's been on market 32 days. Have you received any prior offers? Is the seller open to a 6% concession, seller financing, or rate buy-down credit?
- Built in 1912 — when were the roof, HVAC, electrical panel, plumbing, and water heater last replaced?
- Is there a deadline driving the sale (1031 exchange, divorce, estate, relocation)? That informs how much negotiation room exists.
- What's the average days-on-market for RENTAL listings here right now (not sales)? A rising rental-DOM trend means longer vacancies and softer asking-rent achievability than the comps imply.
- What's the recent tenant-quality profile in this submarket — average credit score on applications, eviction rate, late-payment / NSF rate, and stable-employment percentage? A property-management company in the area should have these aggregated.
- How much new for-sale + rental construction is in the pipeline within 1–3 miles? Heavy new supply typically softens prices + rents 12–24 months out; constrained supply supports both.
Investment metrics
- 1% rule
- 0.94% ✗
- Cap rate
- 6.45%
- Cash-on-cash
- 0.55%
- DSCR
- 1.02
- GRM
- 8.9
CMA / ARV
- ARV (median comp)
- $515,015
- List price
- $350,000
- Delta
- -32.04%
- Verdict
- UNDERPRICED
- Comps
- 20 within 1.0 mi
Show comp detail 12 sales within ~0.75 mi
| Address | Dist | Beds/Ba | Sqft | Sold | Price | $/sf | Match |
|---|---|---|---|---|---|---|---|
| 5131 Touhy Ave | 0.34mi | 3/2.0 (-1) | 1,459 (-1%) | 8mo | $465,000 | $319 | 68 |
| 5049 Lunt Ave | 0.34mi | 3/2.0 (-1) | 1,500 (+1%) | 13mo | $449,000 | $299 | 64 |
| 5148 Coyle Ave | 0.22mi | 3/2.0 (-1) | 1,600 (+8%) | 6mo | $555,000 | $347 | 64 |
| 4940 Coyle Ave | 0.48mi | 3/2.5 (-1) | 1,544 (+4%) | 0mo | $675,000 | $437 | 61 |
| 5037 Fargo Ave | 0.65mi | 3/2.0 (-1) | 1,500 (+1%) | 4mo | $425,000 | $283 | 57 |
| 4939 Fargo Ave | 0.73mi | 4/2.0 | 1,521 (+3%) | 8mo | $410,000 | $270 | 53 |
| 6955 N Dowagiac Ave | 0.28mi | 3/2.0 (-1) | 1,699 (+15%) | 7mo | $485,000 | $285 | 49 |
| 6623 N Sioux Ave | 0.50mi | 3/2.0 (-1) | 1,596 (+8%) | 11mo | $575,000 | $360 | 48 |
| 4943 Fairview Ln | 0.48mi | 3/1.5 (-1) | 1,675 (+13%) | 10mo | $570,000 | $340 | 43 |
| 7081 N Mason Ave | 0.65mi | 3/1.5 (-1) | 1,300 (-12%) | 2mo | $485,000 | $373 | 42 |
| 6700 N Sioux Ave | 0.49mi | 3/2.0 (-1) | 1,676 (+13%) | 9mo | $615,000 | $367 | 40 |
| 4915 Farwell Ave | 0.57mi | 4/3.0 | 1,683 (+14%) | 12mo | $630,000 | $374 | 35 |
Match score weights: distance 35% · size 25% · config 20% · recency 20%. Top-matched comps best support the ARV.
Projected returns pro-forma
-3.0% appreciation · 4.41% rent growth · sell at horizon
- IRR
- -13.7%
- Equity multiple
- 0.50×
- Total profit
- $-49,004
- Equity at exit
- $52,186
- IRR
- -2.6%
- Equity multiple
- 0.81×
- Total profit
- $-18,577
- Equity at exit
- $30,262
Cash invested: $98,000 (down + closing). Projections, not guarantees.
Landlord ↔ Tenant lean methodology
- Overall (STATE)
- 43 Moderately Tenant-Leaning
- State Illinois
- 43 Moderately Tenant-Leaning · D+7
- County
- — inherits STATE
- City
- — inherits STATE
ZIP-level market 60077
- Rents YoY
- 4.4%
- Active inventory
- 1
- Price-to-rent
- 8.9×
Monthly cashflow live
- Estimated rent
- $3,273 medium interval (Pro) →
- Mortgage (P&I)
- −$1,835
- Tax from tax record
- −$559 /mo · $6,709/yr
- Insurance
- −$146
- HOA
- −$0
- Vacancy / Maint / Mgmt
- −$687
- Net cashflow
- $45
Break-even live
Sensitivity live
| Price | -10% $243 | -5% $144 | +0% $45 | +5% $-54 | +10% $-153 |
|---|---|---|---|---|---|
| Rent | -10% $-213 | -5% $-84 | +0% $45 | +5% $174 | +10% $304 |
| Rate | -1.0pp $221 | -0.5pp $134 | base $45 | +0.5pp $-45 | +1.0pp $-138 |
UW: 25.0% down · 7.5% · 30yr · 1.5% tax · 5.0% vac · 8.0% maint · 8.0% mgmt
Financing live
Cash to close
- Down payment
- $87,500
- Closing costs
- $10,500
- Reserves months
- —
- Total cash needed
- —
Loan-product check · same deal, 3 products live
Conventional
25% down · 7.5% · 30yr
- Down + closing
- —
- Monthly P&I
- —
- Monthly cashflow
- —
- DSCR
- —
- Eligible?
- —
Personal DTI + credit; lowest rate.
DSCR
20% down · 8.5% · 30yr
- Down + closing
- —
- Monthly P&I
- —
- Monthly cashflow
- —
- DSCR
- —
- Eligible?
- —
No personal income docs; deal must DSCR.
Hard money
10% down · 12.0% · 12mo
- Down + closing
- —
- Monthly P&I
- —
- Monthly cashflow
- —
- DSCR
- —
- Eligible?
- —
Short-term bridge; refi at stabilization.
Rent comps 1 comps
| Address | Beds | Baths | Sqft | Rent | $/sqft | DOM | Units | Dist |
|---|---|---|---|---|---|---|---|---|
| 8000 Lincoln Ave Skokie, IL | 3.0 | 1.0–2.0 | 992 | $4,897 | $4.94 | 0d | 15 | 1.32mi |
Listing history 4 events
-
2026-04-23$350,000 Active 181-char remark
-
2022-07-27soldstatus $220,000
-
1991-07-10soldstatus $152,000
-
1989-02-21soldstatus $85,000
ⓘ Source: listings_history table (triggers on properties + properties_extension) + one-shot
backfill from property_details.listing_events for pre-trigger history.
Tax reassessment forecast IL · Partial reset (capped growth)
- Current annual tax
- $6,709 · $559/mo
- Projected year-2 tax
- $7,327 · $611/mo
- Expected delta
- +$618/yr (+$52/mo · 9.2%)
ⓘ Screening estimate from a state-policy table — verify with the county assessor before closing.
Climate risk First Street
- Flood 1/10 Low FEMA zone X (unshaded) · 0% chance over 30 yrs
- Wildfire 1/10 Low
- Heat 3/10 Moderate 7 d/yr ≥99°F today · 14 d/yr by 30 yrs out
- Wind 2/10 Low
- Air quality 4/10 Moderate 6 unhealthy d/yr today · 7 by 30 yrs out
Nearby sold comps map
Loading sold comps map…
Walkable amenities ~0.75 mi
Loading nearby amenities…
Taxation est. · year 1
- Rental income
- $39,274
- − Mortgage interest
- −$19,605
- − Property taxes
- −$6,709
- − Insurance
- −$1,750
- − Repairs & maintenance
- −$3,142
- − Management
- −$3,142
- − Depreciation
- −$10,182
- Taxable loss
- −$5,256
- Est. tax savings @ 24.0%
- +$1,261
- After-tax cash flow
- $1,804/yr
For passive investors: Depreciation is non-cash, so a rental often shows a tax loss while cash-flowing — sheltering income. Rental losses are passive: they offset passive income freely, and up to $25,000/yr can offset ordinary (W-2) income if you actively participate and your MAGI is under $100k (phasing out to $0 by $150k); unused losses carry forward. On sale, claimed depreciation is recaptured at up to 25%, and gains may owe capital-gains tax (a 1031 exchange can defer both). Figures are a year-1 estimate at your 24.0% rate — not tax advice; consult a CPA.
Schools (NCES district)
No district data.
Livability — Skokie
- Score
- 82/100
- State rank
- #74
- US rank
- #1213
Category grades
Schools grade is shown separately in the Schools card above.
Census & demographics
- Census place
- Skokie, IL
- County
- Cook County · 4,486,803 people
- City population
- 61,454
- Metro
- Chicago-Naperville-Elgin, IL-IN-WI
- Population (ZIP)
- 28,501
- Household income
- $78,523
- Rent vs Own
- Severe rent burden
- 1316.0
Population outlook (Cook County) Hauer SSP2
- Today (2025)
- 5,347,519 people
- By 2030
- 5,357,703 · +0.2%
- By 2040
- 5,324,924 · -0.4%
- By 2050
- 5,230,762 · -2.2%
- By 2075
- 4,785,735 · -10.5%
- By 2100
- 4,188,836 · -21.7%
Race, ethnicity, and origin ACS 2023
- Neighborhood character
- Diverse neighborhood (Simpson 0.69)
- Race & ethnicity
- White 45% Asian 29% Hispanic / Latino 12% Black 10% Two or more races 8%
- Hispanic origin (detail)
- Mexican 8% Puerto Rican 3%
- Common ancestry
- Romanian 2% Scotch-Irish 2% American 2%
- Foreign-born
- 43% · Canada, China, Vietnam
- Languages at home
- 48% English-only · Other Indo-European 16% Spanish 8% Tagalog/Filipino 5%
Political lean MEDSL · Cook
- 2024 margin
- Solid D (+42.0) · D 70.4% · R 28.4% · Other 1.2%
- 2008→2024 swing
- -11.4pp toward R · 2008: 53.4pp · 2024: 42.0pp
- All cycles
- 2024: D+42.0 2020: D+50.3 2016: D+53.0 2012: D+49.4 2008: D+53.4
Not yet ingested
- Civics
- —
Market trends
- HPI YoY
- ▼ -185.81%
- Current HPI
- 182.9687
- Rent YoY
- ▲ 4.41%
- Metro
- Chicago-Naperville-Elgin, IL-IN-WI
- State GDP YoY
- ▲ 1.59%
- F500 in state
- 60
Industry mix (Fortune 500 HQ in IL)
| Industry | F500 HQs | Revenue |
|---|---|---|
| Insurance | 4 | $201B |
|
||
| Consumer Goods | 4 | $87B |
|
||
| Industrial Machinery | 3 | $64B |
|
||
| Healthcare | 2 | $55B |
|
||
| Retail / Pharmacy | 1 | $148B |
|
||
| Agriculture / Food | 1 | $86B |
|
||
Price history
+194.1% since first listed6 events — show timeline
- 2026-05-27 Sold (Public Records) $250,000 Public Records
- 2026-05-27 Listing Removed — MRED as Distributed by MLS Grid
- 2026-04-23 Listed — MRED as Distributed by MLS Grid
- 2022-07-27 Sold (Public Records) $220,000 Public Records
- 1991-07-10 Sold (Public Records) $152,000 Public Records
- 1989-02-21 Sold (Public Records) $85,000 Public Records
Property tax history
+2.1%/yrLatest (2023): $6,709 · -16.5% YoY. Source: county tax records.
Cash-flow waterfall
monthlySold comps — $/sqft
last 12 mo · ≤1 miLoading sold comps…