 🏷️ Likely Rental
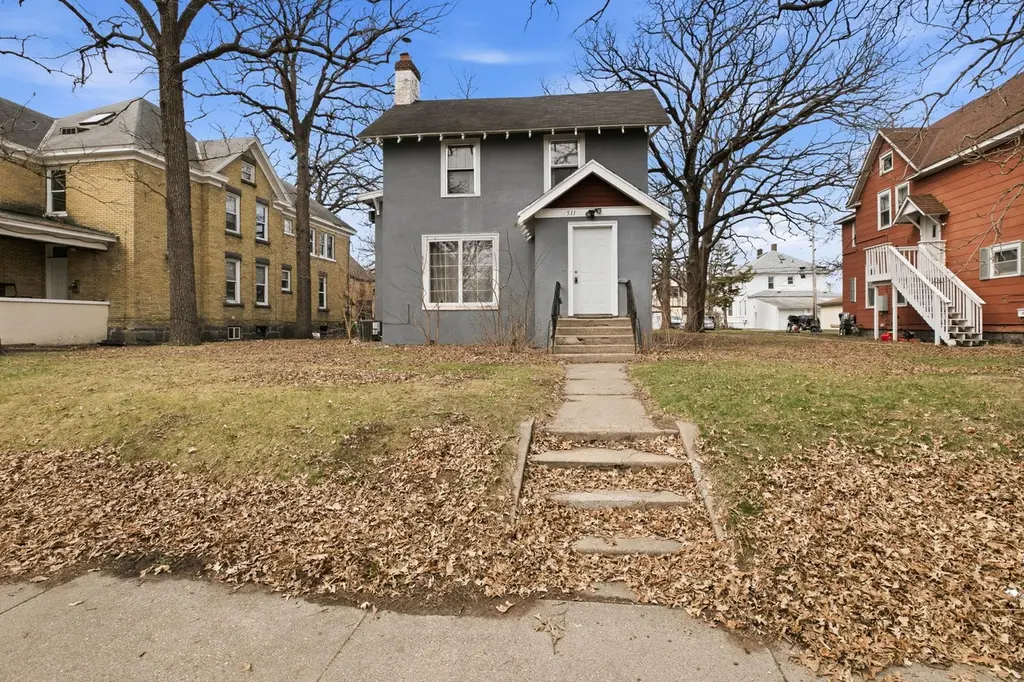
511 6th Ave S · St. Cloud, MN
Flood risk 1/10 · Minimal
- FEMA flood zone
- X (unshaded)
- Chance of flooding over 30 yrs
- 0.0%
- Est. flood insurance / yr
- $473 – $860
Fire risk 1/10 · Minimal
- Est. fire insurance / yr
- $888 – $1,650
Heat risk 2/10 · Minimal
- Hot days now (above 97°F)
- 7 days/yr
- Hot days in 30 yrs
- 13 days/yr
Wind risk 2/10 · Minimal
- Chance of severe wind over 30 yrs
- —
Air-quality risk 3/10 · Minor
- Unhealthy air days now
- 3 days/yr
- Unhealthy air days in 30 yrs
- 3 days/yr
Risk factors via First Street. Map © Google.
Why this score? — see what drove the B grade
The composite is a weighted blend of 9 inputs, each scored 0–100. Each bar is that input's sub-score; the figure is the points it added to the 100-point composite (weight × sub-score).
- Cash flow +30.0/30.0
- ARV discount +15.0/15.0
- DSCR +10.0/10.0
- 1% rule +8.3/10.0
- Rent growth +3.3/5.0
- Schools +2.8/10.0
- Livability +2.5/5.0
- Condition / age +2.5/5.0
- Appreciation +0.0/10.0
$169,900
🖨 Deal sheet 📄 Offer letter ✓ Due diligence
Listing remarks MLS
Prime Rental Opportunity Near SCSU 5 Bed | 2 Bath | Licensed for 4 Bedrooms Excellent opportunity to own a well-located rental property just minutes from St. Cloud State University. This 5-bedroom, 2-bath home is currently licensed for 4 bedrooms and generates $1,875 per month in rental income. The home features four upper-level bedrooms, a spacious living room with hardwood floors, and newer flooring in the kitchen and dining area. A separate basement entrance adds flexibility for tenants or future use. Outside, the property offers ample off-street parking plus a large detached garage with a loft area, providing abundant storage space. Tenants are responsible for gas and electric, while the owner pays water, sewer, and garbage, keeping operating expenses manageable. With its layout and location, this property also offers the potential to transition back to a single-family home once the current lease expires. Current Lease in place until April 2027.
Key facts
- Newer flooring
- Hardwood floors
- Spacious living room
Tags
Neighborhood map
What this means for you Summary
Snapshot
- This is a 5-bed/2.0-bath single-family listed at $170k.
Deal economics
- At list price, monthly cash flow is $638 ($8k/yr) — positive.
- The deal already cash-flows at list — no discount required.
- Meets the 1% rule at list price ($2k rent vs $170k).
- Recommended offer: $160k (6.0% below list) — sets the bar for market timing.
- Cap rate 10.8% vs local median 3.9% in St. Cloud — top-decile yield for the area; either an underpriced asset or a hidden risk that comps aren't pricing in. Stress-test before assuming the spread holds.
Location & tenants
- Location reads: area grade B — affects rentability + tenant quality, not the cash-flow math above.
- St. Cloud Public School District (urban): math 27% / reading 38% proficiency, ranked #264 of 301 in MN (top 88%) — families likely to look elsewhere, expect single-tenant / working-renter base with shorter leases.
- Market conditions: Rents rising (+3.4%/yr); 218 active listings in the ZIP; 5 comparable units currently listed for rent nearby; rentals lingering (median 44d on market — plan ~5-8 weeks vacancy on turnover, expect pricing pressure); 80% of comp listings sitting > 30 days — soft ceiling on asking rent; 661 units permitted in Stearns County in 2024 (291 in 5+ unit buildings).
- This rent runs 37% of the median local income ($73k/yr) — at the standard rent-burdened threshold; future hikes will face affordability resistance.
Forward outlook
- Local home prices are declining (-3.0%/yr); year-one equity from $1k of loan paydown is wiped out by about $5k of value loss. Plan a longer hold.
- Stearns County population projected at +9% by 2050 — modest demand growth; plan on rents tracking national, not racing it.
- At projected returns (-3.0% appreciation + 3.4% rent growth), your $48k cash investment doubles in ~8 years — after that, you're playing with house money.
Negotiation context
- It's been on market 65 days — a 6% lower offer ($160k) is reasonable based on typical stale-listing flexibility.
- 4 sale attempts since 11y ago with the ask held roughly flat each time — persistent listings suggest the price (not the market) is what's stuck; bring a comps-based counter.
- Current owner paid $126k; 35% above their basis — modest negotiation headroom, anchor on the comps not their cost.
Risks & watch-outs
- Watch-outs: built in 1916 — expect roof / HVAC / electrical / plumbing capex.
Questions for the listing agent
- It's been on market 65 days. Have you received any prior offers? Is the seller open to a 6% concession, seller financing, or rate buy-down credit?
- Built in 1916 — when were the roof, HVAC, electrical panel, plumbing, and water heater last replaced?
- Why hasn't it sold? Are there any deal-killer items the seller is aware of (foundation, flood, title, zoning, code violations)?
- Is there a deadline driving the sale (1031 exchange, divorce, estate, relocation)? That informs how much negotiation room exists.
- What's the average days-on-market for RENTAL listings here right now (not sales)? A rising rental-DOM trend means longer vacancies and softer asking-rent achievability than the comps imply.
- What's the recent tenant-quality profile in this submarket — average credit score on applications, eviction rate, late-payment / NSF rate, and stable-employment percentage? A property-management company in the area should have these aggregated.
- How much new for-sale + rental construction is in the pipeline within 1–3 miles? Heavy new supply typically softens prices + rents 12–24 months out; constrained supply supports both.
Investment metrics
- 1% rule
- 1.33% ✓
- Cap rate
- 10.80%
- Cash-on-cash
- 16.10%
- DSCR
- 1.72
- GRM
- 6.2
CMA / ARV
- ARV (median comp)
- $217,487
- List price
- $169,900
- Delta
- -21.88%
- Verdict
- UNDERPRICED
- Comps
- 7 within 2.0 mi
Projected returns pro-forma
-3.0% appreciation · 3.38% rent growth · sell at horizon
- IRR
- 7.5%
- Equity multiple
- 1.29×
- Total profit
- $14,011
- Equity at exit
- $25,333
- IRR
- 17.1%
- Equity multiple
- 2.43×
- Total profit
- $68,231
- Equity at exit
- $14,690
Cash invested: $47,572 (down + closing). Projections, not guarantees.
Landlord ↔ Tenant lean methodology
- Overall (STATE)
- 46 Balanced
- State Minnesota
- 46 Balanced · D+2
- County
- — inherits STATE
- City
- — inherits STATE
ZIP-level market 56301
- Rents YoY
- 3.4%
- Active inventory
- 218
- Price-to-rent
- 6.2×
Monthly cashflow live
- Estimated rent
- $2,268 medium interval (Pro) →
- Mortgage (P&I)
- −$891
- Tax from tax record
- −$192 /mo · $2,300/yr
- Insurance
- −$71
- HOA
- −$0
- Vacancy / Maint / Mgmt
- −$476
- Net cashflow
- $638
Break-even live
UW: 25.0% down · 7.5% · 30yr · 1.5% tax · 5.0% vac · 8.0% maint · 8.0% mgmt
Financing live
Cash to close
- Down payment
- $42,475
- Closing costs
- $5,097
- Reserves months
- —
- Total cash needed
- —
Loan-product check · same deal, 3 products live
Conventional
25% down · 7.5% · 30yr
- Down + closing
- —
- Monthly P&I
- —
- Monthly cashflow
- —
- DSCR
- —
- Eligible?
- —
Personal DTI + credit; lowest rate.
DSCR
20% down · 8.5% · 30yr
- Down + closing
- —
- Monthly P&I
- —
- Monthly cashflow
- —
- DSCR
- —
- Eligible?
- —
No personal income docs; deal must DSCR.
Hard money
10% down · 12.0% · 12mo
- Down + closing
- —
- Monthly P&I
- —
- Monthly cashflow
- —
- DSCR
- —
- Eligible?
- —
Short-term bridge; refi at stabilization.
Rent comps 5 comps
| Address | Beds | Baths | Sqft | Rent | $/sqft | DOM | Units | Dist |
|---|---|---|---|---|---|---|---|---|
| 723 5th Ave S Saint Cloud, MN | 4.0 | 2.5 | 2300 | $1,500 | $0.65 | 43d | 1 | 0.15mi |
| 801 15th Ave S Unit 1 St Cloud, MN | 4.0 | 2.0 | 1525 | $1,900 | $1.25 | 43d | 1 | 0.65mi |
| 1205 11th St SE Saint Cloud, MN | 4.0 | 2.0 | 1416 | $2,450 | $1.73 | 43d | 1 | 1.00mi |
| 1225 13th St SE Saint Cloud, MN | 4.0 | 3.0 | 1500 | $2,450 | $1.63 | 43d | 1 | 1.04mi |
| 1615 15th Ave SE St Cloud, MN | 2.0–4.0 | 1.0–3.0 | 1312 | $2,722 | $2.07 | 1d | 8 | 1.26mi |
Listing history 31 events
-
2026-06-19days on market $169,900 Active 65 DOM
-
2026-06-18days on market $169,900 Active 64 DOM
-
2026-06-17days on market $169,900 Active 63 DOM
-
2026-06-16days on market $169,900 Active 62 DOM
-
2026-06-15days on market $169,900 Active 61 DOM
-
2026-06-14days on market $169,900 Active 59 DOM
-
2026-06-13days on market $169,900 Active 58 DOM
-
2026-06-10pricedays on market $169,900 Active 56 DOM
-
2026-06-09days on market $175,000 Active 55 DOM
-
2026-06-08days on market $175,000 Active 54 DOM
-
2026-06-07days on market $175,000 Active 53 DOM
-
2026-06-03days on market $175,000 Active 49 DOM
-
2026-06-02days on market $175,000 Active 48 DOM
-
2026-06-01days on market $175,000 Active 47 DOM
-
2026-05-31days on market $175,000 Active 46 DOM
-
2026-05-30days on market $175,000 Active 45 DOM
-
2026-04-15$175,000 Active 964-char remark
Show marketing remark (964 chars)
Prime Rental Opportunity Near SCSU 5 Bed | 2 Bath | Licensed for 4 Bedrooms Excellent opportunity to own a well-located rental property just minutes from St. Cloud State University. This 5-bedroom, 2-bath home is currently licensed for 4 bedrooms and generates $1,875 per month in rental income. The home features four upper-level bedrooms, a spacious living room with hardwood floors, and newer flooring in the kitchen and dining area. A separate basement entrance adds flexibility for tenants or future use. Outside, the property offers ample off-street parking plus a large detached garage with a loft area, providing abundant storage space. Tenants are responsible for gas and electric, while the owner pays water, sewer, and garbage, keeping operating expenses manageable. With its layout and location, this property also offers the potential to transition back to a single-family home once the current lease expires. Current Lease in place until April 2027.
-
2021-12-29historical
-
2021-11-05historical Contingent - Inspection
-
2021-08-01$179,900 Active
-
2020-06-03soldstatus $126,000
-
2020-05-29soldstatus $126,000 Sold
-
2020-02-25status Pending
-
2020-02-18historical Contingent - Inspection
-
2020-01-31price $129,898
-
2020-01-10$134,898 Active
-
2015-10-02soldstatus $122,500 Sold
-
2015-10-02soldstatus $122,500
-
2015-09-12status Pending
-
2015-09-10historical Contingent - Inspection
-
2015-08-25$122,900 Active
ⓘ Source: listings_history table (triggers on properties + properties_extension) + one-shot
backfill from property_details.listing_events for pre-trigger history.
Tax reassessment forecast MN · Partial reset (capped growth)
- Current annual tax
- $2,300 · $192/mo
- Projected year-2 tax
- $2,300 · $192/mo
- Expected delta
- $0/yr ($0/mo · 0.0%)
ⓘ Screening estimate from a state-policy table — verify with the county assessor before closing.
Climate risk First Street
- Flood 1/10 Low FEMA zone X (unshaded) · 0% chance over 30 yrs
- Wildfire 1/10 Low
- Heat 2/10 Low 7 d/yr ≥97°F today · 13 d/yr by 30 yrs out
- Wind 2/10 Low
- Air quality 3/10 Moderate 3 unhealthy d/yr today · 3 by 30 yrs out
Nearby sold comps map
Loading sold comps map…
Walkable amenities ~0.75 mi
Loading nearby amenities…
Taxation est. · year 1
- Rental income
- $27,215
- − Mortgage interest
- −$9,517
- − Property taxes
- −$2,300
- − Insurance
- −$850
- − Repairs & maintenance
- −$2,177
- − Management
- −$2,177
- − Depreciation
- −$4,943
- Taxable income
- $5,252
- Est. tax owed @ 24.0%
- −$1,260
- After-tax cash flow
- $6,399/yr
For passive investors: Depreciation is non-cash, so a rental often shows a tax loss while cash-flowing — sheltering income. Rental losses are passive: they offset passive income freely, and up to $25,000/yr can offset ordinary (W-2) income if you actively participate and your MAGI is under $100k (phasing out to $0 by $150k); unused losses carry forward. On sale, claimed depreciation is recaptured at up to 25%, and gains may owe capital-gains tax (a 1031 exchange can defer both). Figures are a year-1 estimate at your 24.0% rate — not tax advice; consult a CPA.
Schools (NCES district)
- District
- St. Cloud Public School District
- NCES district ID
- 2733510
- Math proficiency
- 27% ▼ -9.00%
- Reading proficiency
- 38% ▼ -5.00%
- Median HH income
- $46,638
- Composite
- 27.91/100
- National rank
- #6866
- State rank
- #264 of 301 in MN
Livability — St. Cloud
No livability data for this city. (Only ~50 U.S. cities are tracked.)
Census & demographics
- Census place
- St. Cloud, MN
- County
- Stearns County · 90,226 people
- City population
- 60,914
- Metro
- St. Cloud, MN
- Population (ZIP)
- 35,580
- Household income
- $73,142
- Rent vs Own
- Severe rent burden
- 1831.0
Population outlook (Stearns County) Hauer SSP2
- Today (2025)
- 162,629 people
- By 2030
- 166,495 · +2.4%
- By 2040
- 172,661 · +6.2%
- By 2050
- 177,480 · +9.1%
- By 2075
- 192,907 · +18.6%
- By 2100
- 206,274 · +26.8%
Race, ethnicity, and origin ACS 2023
- Neighborhood character
- Predominantly White (66%)
- Race & ethnicity
- White 66% Black 20% Hispanic / Latino 6% Two or more races 6% Asian 4%
- Hispanic origin (detail)
- Mexican 2% Puerto Rican 1%
- Common ancestry
- Portuguese 6% Romanian 4% Lithuanian 2%
- Foreign-born
- 16% · Canada, Vietnam
- Languages at home
- 77% English-only · Spanish 4% Other Asian/Pacific 2% Other Indo-European 1%
Political lean MEDSL · Stearns
- 2024 margin
- Strong R (+26.8) · D 35.7% · R 62.5% · Other 1.9%
- 2008→2024 swing
- -19.8pp toward R · 2008: -7.0pp · 2024: -26.8pp
- All cycles
- 2024: R+26.8 2020: R+22.5 2016: R+27.9 2012: R+12.1 2008: R+7.0
Not yet ingested
- Civics
- —
Market trends
- HPI YoY
- ▼ -102.70%
- Current HPI
- 148.6882
- Rent YoY
- ▲ 3.38%
- Metro
- St. Cloud, MN
- State GDP YoY
- ▲ 2.41%
- F500 in state
- 34
Industry mix (Fortune 500 HQ in MN)
| Industry | F500 HQs | Revenue |
|---|---|---|
| Healthcare | 2 | $407B |
|
||
| Retail | 2 | $150B |
|
||
| Consumer Goods | 2 | $32B |
|
||
| Industrial Machinery | 2 | $6B |
|
||
| Agriculture | 1 | $40B |
|
||
| Healthcare / Medical Devices | 1 | $32B |
|
||
Price history
+42.4% since first listed15 events — show timeline
- 2026-04-15 Listed $175,000 NORTHSTARMLS as Distributed by MLS Grid
- 2021-12-29 Listing Removed — NORTHSTARMLS as Distributed by MLS Grid
- 2021-11-05 Contingent — NORTHSTARMLS as Distributed by MLS Grid
- 2021-08-01 Listed $179,900 NORTHSTARMLS as Distributed by MLS Grid
- 2020-06-03 Sold (Public Records) $126,000 Public Records
- 2020-05-29 Sold (MLS) $126,000 NORTHSTARMLS as Distributed by MLS Grid
- 2020-02-25 Pending — NORTHSTARMLS as Distributed by MLS Grid
- 2020-02-18 Contingent — NORTHSTARMLS as Distributed by MLS Grid
- 2020-01-31 Price Changed $129,898 NORTHSTARMLS as Distributed by MLS Grid
- 2020-01-10 Listed $134,898 NORTHSTARMLS as Distributed by MLS Grid
- 2015-10-02 Sold (Public Records) $122,500 Public Records
- 2015-10-02 Sold (MLS) $122,500 NORTHSTARMLS as Distributed by MLS Grid
- 2015-09-12 Pending — NORTHSTARMLS as Distributed by MLS Grid
- 2015-09-10 Contingent — NORTHSTARMLS as Distributed by MLS Grid
- 2015-08-25 Listed $122,900 NORTHSTARMLS as Distributed by MLS Grid
Property tax history
+1.6%/yrLatest (2025): $2,300 · +1.7% YoY. Source: county tax records.
Cash-flow waterfall
monthlySold comps — $/sqft
last 12 mo · ≤1 miLoading sold comps…