 🌊 Lakefront
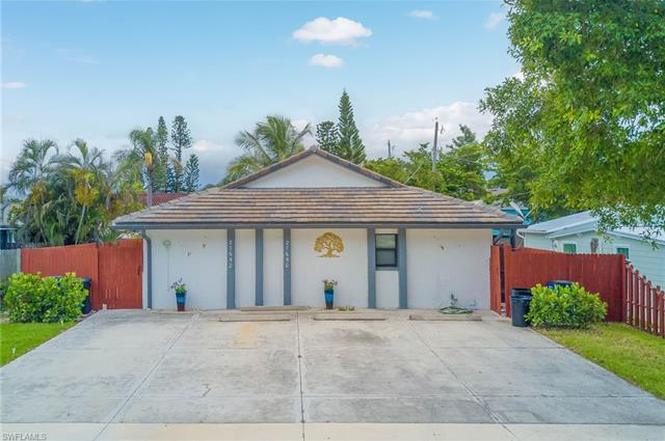
27650 Imperial Shores Blvd #652 · Bonita Springs, FL
Flood risk 9/10 · Severe
- FEMA flood zone
- AE
- Chance of flooding over 30 yrs
- 0.99%
- Est. flood insurance / yr
- $1,737 – $8,500
Fire risk 1/10 · Minimal
- Est. fire insurance / yr
- $947 – $1,759
Heat risk 10/10 · Severe
- Hot days now (above 107°F)
- 7 days/yr
- Hot days in 30 yrs
- 32 days/yr
Wind risk 10/10 · Severe
- Chance of severe wind over 30 yrs
- 99.0%
Air-quality risk 2/10 · Minimal
- Unhealthy air days now
- 1 days/yr
- Unhealthy air days in 30 yrs
- 1 days/yr
Risk factors via First Street. Map © Google.
Why this score? — see what drove the D- grade
The composite is a weighted blend of 9 inputs, each scored 0–100. Each bar is that input's sub-score; the figure is the points it added to the 100-point composite (weight × sub-score).
- Cash flow +11.9/30.0
- ARV discount +7.5/15.0
- Schools +4.1/10.0
- DSCR +3.5/10.0
- Livability +3.5/5.0
- Rent growth +3.2/5.0
- 1% rule +2.6/10.0
- Condition / age +2.5/5.0
- Appreciation +0.0/10.0
$599,000
🖨 Deal sheet 📄 Offer letter ✓ Due diligence
Listing remarks
Charming Beachside Duplex – Negotiable Turnkey Investment Opportunity Located just a short walk from the beach, this beautifully updated duplex offers both style and flexibility. Renovated within the last few years with tasteful, modern-classic finishes, the property is move-in ready and ideal for investors or owner-occupants alike. The back unit is currently rented, generating immediate income, and has incoming Airbnb bookings for peak season—nearly fully reserved from January through March at approximately $4,000/month. However, arrangements can be adjusted or cancelled. Both AC units are new, and a brand-new irrigation system has been installed. The property sits in a vibr
Key facts
- Updated duplex
- Ample parking
- New ac units
Tags
Property features AI
Finance
- Other: Zoning: TFC-2; Lot dimensions approx. 60 x 120 (property appraiser source); Lot acreage approximately 0.166; Irrigation: Central; No canal/dock (none); # of units in building: 2
- HOA & community: Sidewalks; Streetlights; Underground utilities; Non-gated community
Exterior
- Utilities: Central water; Central sewer; Cable available
- Home design: Residential income property; Duplex building; Concrete block construction; Built in 1984; Located in BONITA SHORES development
- Construction: Tile roof; Concrete block construction; Stucco exterior
- Exterior features: Stucco exterior finish; Impact resistant windows; City sprinkler source; Across from waterfront
Interior
- Flooring: Vinyl
- Bathrooms: 2 full bathrooms
- Heating & cooling: Solar heating; Ceiling fans; Central electric cooling
- Interior features: Vinyl flooring
Neighborhood map
What this means for you Summary
Snapshot
- This is a 4-bed/2.0-bath condo listed at $599k.
Deal economics
- At list price, monthly cash flow is $-581 ($-7k/yr) — negative.
- To cash-flow at today's rent, offer at most $496k (17.1% below list).
- To meet the 1% rule (rent ≥ 1% of price), the offer needs to be $455k (24.1% below list).
- Recommended offer: $455k (24.1% below list) — sets the bar for 1% rule.
- Cap rate 6.0% vs local median 1.7% in Bonita Springs — top-decile yield for the area; either an underpriced asset or a hidden risk that comps aren't pricing in. Stress-test before assuming the spread holds.
Location & tenants
- Location reads 70/100 on livability (#428 in FL) — a middle-class / working-renter tenant base. Strengths: crime A+, housing A+, employment A; Watch: schools C-, cost of living C-, health & safety D.
- Lee (suburban): math 47% / reading 50% proficiency, ranked #42 of 73 in FL (top 58%) — families likely to look elsewhere, expect single-tenant / working-renter base with shorter leases.
- Market conditions: Rents rising (+2.9%/yr); 699 active listings in the ZIP; 40 comparable units currently listed for rent nearby; rentals at typical pace (median 24d on market — plan ~3-4 weeks tenant-placement turnaround); high-income renter base; 15,411 units permitted in Lee County in 2024 (4,686 in 5+ unit buildings).
- This rent runs 42% of the median local income ($131k/yr) — at the standard rent-burdened threshold; future hikes will face affordability resistance.
Forward outlook
- Local home prices are declining (-3.0%/yr); year-one equity from $4k of loan paydown is wiped out by about $18k of value loss. Plan a longer hold.
- Lee County population projected at +44% by 2050 — long-run rental-demand tailwind backs the buy-and-hold thesis.
Negotiation context
- It's been on market 271 days — a 12% lower offer ($527k) is reasonable based on typical stale-listing flexibility.
- 3 sale attempts; this cycle's ask is 14894% above the opening price — seller raised mid-cycle; expect resistance to lowballs.
- Current owner paid $350k; list at $599k implies a 71% gain — meaningful room to come down on a strong offer.
Risks & watch-outs
- Watch-outs: flood insurance adds $427/mo.
- Climate carrying-cost: in FEMA flood zone AE (mandatory federal flood insurance); severe wind risk, 99% chance of damaging wind over 30y; extreme-heat days projected 7→32/yr by 2055 (HVAC capex compounding) — expect insurance premiums to compound above CPI over the hold.
Questions for the listing agent
- What do current leases actually rent for vs. the listed asking? Can we see a recent rent roll and the last 12 months of T-12 income?
- It's been on market 271 days. Have you received any prior offers? Is the seller open to a 24% concession, seller financing, or rate buy-down credit?
- What's the actual annual flood-insurance premium (NFIP or private), and is the property in a SFHA with mandatory coverage?
- Any open or pending special assessments — roof, HVAC, plumbing, elevator, façade? What's the per-unit balance and payoff schedule, and is the seller paying it off at close or rolling it to the buyer?
- Why hasn't it sold? Are there any deal-killer items the seller is aware of (foundation, flood, title, zoning, code violations)?
- Is there a deadline driving the sale (1031 exchange, divorce, estate, relocation)? That informs how much negotiation room exists.
- The area grade is low — what's the realistic commute time and amenity access for the typical tenant pool here? Any planned neighborhood developments (good or bad) we should know about?
- This sits on a lake — are riparian / water-frontage rights deeded with the parcel? Any dock permits, shoreline easements, or HOA water-use restrictions?
- What's the documented flood / surge / shoreline-erosion history here (FEMA AND non-FEMA — e.g., storm surge, creek backup, septic-field saturation)?
- Any water-quality or seasonal algae-bloom issues that affect tenant satisfaction or short-term-rental demand?
- What's the average days-on-market for RENTAL listings here right now (not sales)? A rising rental-DOM trend means longer vacancies and softer asking-rent achievability than the comps imply.
- What's the recent tenant-quality profile in this submarket — average credit score on applications, eviction rate, late-payment / NSF rate, and stable-employment percentage? A property-management company in the area should have these aggregated.
- How much new apartment / multifamily construction is in the pipeline within 1–3 miles? Heavy new supply (>2% of stock underway) typically softens rents 12–24 months out; light construction supports rent growth.
Investment metrics
- 1% rule
- 0.76% ✗
- Cap rate
- 5.98%
- Cash-on-cash
- -1.11%
- DSCR
- 0.95
- GRM
- 11.0
CMA / ARV
No comps found within radius.
Projected returns pro-forma
-3.0% appreciation · 2.85% rent growth · sell at horizon
- IRR
- -23.5%
- Equity multiple
- 0.20×
- Total profit
- $-134,692
- Equity at exit
- $89,313
- IRR
- -18.6%
- Equity multiple
- 0.00×
- Total profit
- $-167,413
- Equity at exit
- $51,791
Cash invested: $167,720 (down + closing). Projections, not guarantees.
Landlord ↔ Tenant lean methodology
- Overall (STATE)
- 87 Strongly Landlord-Friendly
- State Florida
- 87 Strongly Landlord-Friendly · R+3
- County
- — inherits STATE
- City
- — inherits STATE
ZIP-level market 34134
- Rents YoY
- 2.9%
- Active inventory
- 699
- Price-to-rent
- 11.0×
Monthly cashflow live
- Estimated rent
- $4,545 medium interval (Pro) →
- Mortgage (P&I)
- −$3,141
- Tax from tax record
- −$355 /mo · $4,259/yr
- Insurance
- −$250
- Flood insurance flood zone
- −$427 /mo · $5,118/yr
- HOA
- −$0
- Vacancy / Maint / Mgmt
- −$955
- Net cashflow
- $-581
Break-even live
UW: 25.0% down · 7.5% · 30yr · 1.5% tax · 5.0% vac · 8.0% maint · 8.0% mgmt
Financing live
Cash to close
- Down payment
- $149,750
- Closing costs
- $17,970
- Reserves months
- —
- Total cash needed
- —
Loan-product check · same deal, 3 products live
Conventional
25% down · 7.5% · 30yr
- Down + closing
- —
- Monthly P&I
- —
- Monthly cashflow
- —
- DSCR
- —
- Eligible?
- —
Personal DTI + credit; lowest rate.
DSCR
20% down · 8.5% · 30yr
- Down + closing
- —
- Monthly P&I
- —
- Monthly cashflow
- —
- DSCR
- —
- Eligible?
- —
No personal income docs; deal must DSCR.
Hard money
10% down · 12.0% · 12mo
- Down + closing
- —
- Monthly P&I
- —
- Monthly cashflow
- —
- DSCR
- —
- Eligible?
- —
Short-term bridge; refi at stabilization.
Rent comps 40 comps
| Address | Beds | Baths | Sqft | Rent | $/sqft | DOM | Units | Dist |
|---|---|---|---|---|---|---|---|---|
| 4412 Vanda Dr Bonita Springs, FL | 3.0 | 2.0 | 1800 | $2,800 | $1.56 | 23d | 1 | 0.11mi |
| 4860 Gary Rd Unit 4 Bonita Springs, FL | 3.0 | 2.0 | 1875 | $2,900 | $1.55 | 23d | 1 | 0.23mi |
| 27585 Imperial Shores Blvd Bonita Springs, FL | 3.0 | 3.0 | 1576 | $8,000 | $5.08 | 23d | 1 | 0.24mi |
| 27579 Big Bend Rd Bonita Springs, FL | 3.0 | 2.0 | 1512 | $2,700 | $1.79 | 23d | 1 | 0.24mi |
| 4879 Esplanade St Bonita Springs, FL | 3.0 | 2.5 | 1888 | $16,000 | $8.47 | 11d | 1 | 0.29mi |
| 75 3rd St Bonita Springs, FL | 3.0 | 3.0 | 1630 | $8,900 | $5.46 | 23d | 1 | 0.43mi |
| 4895 Bonita Beach Rd #208 Bonita Springs, FL | 3.0 | 2.0 | 1288 | $3,250 | $2.52 | 23d | 1 | 0.46mi |
| 27594 Shore Dr Bonita Springs, FL | 3.0 | 2.0 | 1426 | $5,500 | $3.86 | 23d | 1 | 0.49mi |
| 27921 Bonita Village Blvd Bonita Springs, FL | 2.0–3.0 | 2.0 | 1429 | $3,745 | $2.62 | 23d | 3 | 0.52mi |
| 11 2nd St Bonita Springs, FL | 3.0 | 2.0 | 1595 | $9,500 | $5.96 | 23d | 1 | 0.54mi |
| 4975 Bonita Beach Rd #106 Bonita Springs, FL | 3.0 | 2.0 | 1875 | $11,000 | $5.87 | 23d | 1 | 0.54mi |
| 211 6th St Bonita Springs, FL | 3.0 | 2.0 | 2000 | $11,900 | $5.95 | 23d | 1 | 0.54mi |
| 60 4th St Bonita Springs, FL | 3.0 | 2.0 | 1860 | $11,400 | $6.13 | 23d | 1 | 0.54mi |
| 74 7th St Bonita Springs, FL | 3.0 | 2.0 | 1124 | $3,150 | $2.80 | 23d | 1 | 0.68mi |
| 999 E Valley Dr Unit 1073522P Bonita Springs, FL | 3.0 | 2.5 | 1668 | $9,929 | $5.95 | 21d | 1 | 0.73mi |
| 27080 Lake Harbor Ct #201 Bonita Springs, FL | 3.0 | 2.0 | 1764 | $7,500 | $4.25 | 23d | 1 | 0.86mi |
| 27080 Lake Harbor Ct #202 Bonita Springs, FL | 3.0 | 2.0 | 1654 | $7,200 | $4.35 | 23d | 1 | 0.86mi |
| 3620 Bailes St Bonita Springs, FL | 3.0 | 3.0 | 1992 | $12,000 | $6.02 | 23d | 1 | 0.98mi |
| 27190 Oakwood Lake Dr #102 Bonita Springs, FL | 3.0 | 2.0 | 1603 | $7,500 | $4.68 | 23d | 1 | 1.03mi |
| 28450 Winthrop Cir Unit 1546014P Bonita Springs, FL | 3.0 | 2.0 | 1894 | $7,804 | $4.12 | 14d | 1 | 1.04mi |
| 4140 Bayhead Dr #106 Bonita Springs, FL | 3.0 | 2.0 | 1583 | $8,200 | $5.18 | 23d | 1 | 1.07mi |
| 28712 Carmel Way Bonita Springs, FL | 3.0 | 2.5 | 1626 | $9,250 | $5.69 | 23d | 1 | 1.09mi |
| 27038 Oakwood Lake Dr Bonita Springs, FL | 3.0 | 3.0 | 1818 | $8,500 | $4.68 | 23d | 1 | 1.11mi |
| 26968 Montego Pointe Ct #201 Bonita Springs, FL | 3.0 | 2.0 | 2008 | $4,100 | $2.04 | 23d | 1 | 1.11mi |
| 26926 Montego Pointe Ct #201 Bonita Springs, FL | 3.0 | 2.0 | 2008 | $9,500 | $4.73 | 23d | 1 | 1.12mi |
| 27121 Oakwood Lake Dr Bonita Springs, FL | 3.0 | 2.5 | 1892 | $8,900 | $4.70 | 3d | 1 | 1.15mi |
| 27119 Oakwood Lake Dr Bonita Springs, FL | 3.0 | 2.5 | 1812 | $7,500 | $4.14 | 23d | 1 | 1.15mi |
| 27113 Oakwood Lake Dr Bonita Springs, FL | 3.0 | 2.5 | 1879 | $7,500 | $3.99 | 23d | 1 | 1.17mi |
| 26881 Wedgewood Dr #201 Bonita Springs, FL | 3.0 | 2.0 | 1640 | $8,000 | $4.88 | 23d | 1 | 1.17mi |
| 26850 Wedgewood Dr #202 Bonita Springs, FL | 3.0 | 3.0 | 1781 | $8,500 | $4.77 | 23d | 1 | 1.18mi |
| 3561 Imperial Crossing Dr Bonita Springs, FL | 1.0–3.0 | 1.0–2.0 | 1122 | $3,650 | $3.25 | 2d | 19 | 1.22mi |
| 28327 Hidden Lake Dr Bonita Springs, FL | 3.0 | 2.0 | 1567 | $8,950 | $5.71 | 23d | 1 | 1.25mi |
| 28211 Winthrop Cir Bonita Springs, FL | 3.0 | 2.0 | 1918 | $10,500 | $5.47 | 23d | 1 | 1.25mi |
| 255 Barefoot Beach Blvd #4 Bonita Springs, FL | 3.0 | 3.5 | 2003 | $25,000 | $12.48 | 13d | 1 | 1.30mi |
| 255 Barefoot Beach Blvd Bonita Springs, FL | 2.0–3.0 | 2.0–3.5 | 1864 | $25,000 | $13.41 | 13d | 2 | 1.30mi |
| 5731 Marimin Dr Unit 1073514P Bonita Springs, FL | 3.0 | 2.0 | 2249 | $5,637 | $2.51 | 3d | 1 | 1.31mi |
| 28070 Winthrop Cir Bonita Springs, FL | 3.0 | 3.0 | 2008 | $12,000 | $5.98 | 23d | 1 | 1.37mi |
| 262 Barefoot Beach Blvd Bonita Springs, FL | 3.0 | 2.0–3.0 | 1864 | $10,500 | $5.63 | 23d | 2 | 1.41mi |
| 28650 Carriage Home Dr Unit 1049692P Bonita Springs, FL | 3.0 | 2.0 | 1528 | $3,980 | $2.60 | 16d | 1 | 1.42mi |
| 265 Barefoot Beach Blvd #203 Bonita Springs, FL | 3.0 | 2.0 | 1604 | $13,000 | $8.10 | 13d | 1 | 1.49mi |
HOA detail condo
- Monthly dues
- $0 · $0/yr
- Assessments
- None detected in remarks — confirm with the listing agent.
Listing history 11 events
-
2026-06-07status $599,000 Pending 271 DOM
-
2026-05-11status Pending With Contingencies
-
2026-03-18$3,995
-
2026-01-08status Active
-
2025-12-15historical
-
2025-07-29price $599,000
-
2025-07-20$625,000 Active
-
2021-08-26soldstatus $350,000
-
2014-05-01soldstatus $174,900
-
2012-04-18soldstatus $104,000
-
1988-02-08soldstatus $89,000
ⓘ Source: listings_history table (triggers on properties + properties_extension) + one-shot
backfill from property_details.listing_events for pre-trigger history.
Tax reassessment forecast FL · Resets to sale price
- Current annual tax
- $4,259 · $355/mo
- Projected year-2 tax
- $4,972 · $414/mo
- Expected delta
- +$713/yr (+$59/mo · 16.7%)
ⓘ Screening estimate from a state-policy table — verify with the county assessor before closing.
Climate risk First Street
- Flood 9/10 Extreme FEMA zone AE · 99% chance over 30 yrs
- Wildfire 1/10 Low
- Heat 10/10 Extreme 7 d/yr ≥107°F today · 32 d/yr by 30 yrs out
- Wind 10/10 Extreme 99% chance of damaging wind over 30 yrs
- Air quality 2/10 Low 1 unhealthy d/yr today · 1 by 30 yrs out
Nearby sold comps map
Loading sold comps map…
Walkable amenities ~0.75 mi
Loading nearby amenities…
Taxation est. · year 1
- Rental income
- $54,544
- − Mortgage interest
- −$33,553
- − Property taxes
- −$4,259
- − Insurance
- −$8,114
- − Repairs & maintenance
- −$4,364
- − Management
- −$4,364
- − Depreciation
- −$17,425
- Taxable loss
- −$17,534
- Est. tax savings @ 24.0%
- +$4,208
- After-tax cash flow
- $-2,769/yr
For passive investors: Depreciation is non-cash, so a rental often shows a tax loss while cash-flowing — sheltering income. Rental losses are passive: they offset passive income freely, and up to $25,000/yr can offset ordinary (W-2) income if you actively participate and your MAGI is under $100k (phasing out to $0 by $150k); unused losses carry forward. On sale, claimed depreciation is recaptured at up to 25%, and gains may owe capital-gains tax (a 1031 exchange can defer both). Figures are a year-1 estimate at your 24.0% rate — not tax advice; consult a CPA.
Schools (NCES district)
- District
- Lee
- NCES district ID
- 1201080
- Math proficiency
- 47% ▼ -11.00%
- Reading proficiency
- 50% ▼ -4.00%
- Median HH income
- $49,518
- Composite
- 41.49/100
- National rank
- #3458
- State rank
- #42 of 73 in FL
Livability — Bonita Springs
- Score
- 70/100
- State rank
- #428
- US rank
- #7576
Category grades
Schools grade is shown separately in the Schools card above.
Census & demographics
- Census place
- Bonita Springs, FL
- County
- Lee County · 788,662 people
- City population
- 64,727
- Metro
- Cape Coral-Fort Myers, FL
- Population (ZIP)
- 16,475
- Household income
- $130,719
- Rent vs Own
- Severe rent burden
- 554.0
Population outlook (Lee County) Hauer SSP2
- Today (2025)
- 871,946 people
- By 2030
- 955,468 · +9.6%
- By 2040
- 1,113,587 · +27.7%
- By 2050
- 1,256,891 · +44.1%
- By 2075
- 1,560,270 · +78.9%
- By 2100
- 1,726,848 · +98.0%
Race, ethnicity, and origin ACS 2023
- Neighborhood character
- Predominantly White (91%)
- Race & ethnicity
- White 91% Hispanic / Latino 5% Two or more races 3% Asian 1%
- Common ancestry
- Slovak 5% Romanian 4% Serbian 2%
- Foreign-born
- 10% · Canada, Jamaica
- Languages at home
- 91% English-only · Spanish 4% German/W. Germanic 1% Other Indo-European 1%
Political lean MEDSL · Lee
- 2024 margin
- Strong R (+28.4) · D 35.5% · R 63.9%
- 2008→2024 swing
- -18.0pp toward R · 2008: -10.4pp · 2024: -28.4pp
- All cycles
- 2024: R+28.4 2020: R+19.2 2016: R+20.4 2012: R+16.6 2008: R+10.4
Not yet ingested
- Civics
- —
Market trends
- HPI YoY
- ▼ -236.48%
- Current HPI
- 237.4416
- Rent YoY
- ▲ 2.85%
- Metro
- Cape Coral-Fort Myers, FL
- State GDP YoY
- ▲ 3.28%
- F500 in state
- 36
Industry mix (Fortune 500 HQ in FL)
| Industry | F500 HQs | Revenue |
|---|---|---|
| Industrial Technology | 2 | $29B |
|
||
| Insurance | 2 | $17B |
|
||
| Retail | 1 | $60B |
|
||
| Technology Distribution | 1 | $58B |
|
||
| Homebuilding | 1 | $35B |
|
||
| Technology Manufacturing | 1 | $35B |
|
||
Price history
-95.5% since first listed10 events — show timeline
- 2026-05-11 Pending — NAPLESMLS
- 2026-03-18 Listed for Rent $3,995 NAPLESMLS
- 2026-01-08 Relisted — NAPLESMLS
- 2025-12-15 Listing Removed — NAPLESMLS
- 2025-07-29 Price Changed $599,000 NAPLESMLS
- 2025-07-20 Listed $625,000 NAPLESMLS
- 2021-08-26 Sold (Public Records) $350,000 Public Records
- 2014-05-01 Sold (Public Records) $174,900 Public Records
- 2012-04-18 Sold (Public Records) $104,000 Public Records
- 1988-02-08 Sold (Public Records) $89,000 Public Records
Property tax history
+7.1%/yrLatest (2025): $4,259 · -5.4% YoY. Source: county tax records.
Cash-flow waterfall
monthlySold comps — $/sqft
last 12 mo · ≤1 miLoading sold comps…