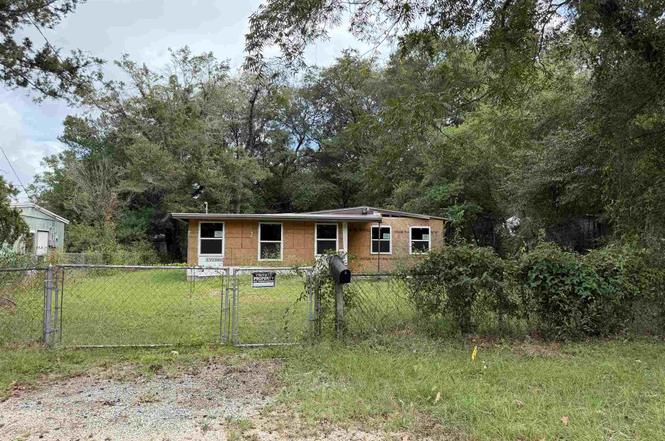
6158 Syrcle Ave · Milton, FL
Flood risk 1/10 · Minimal
- FEMA flood zone
- X (unshaded)
- Chance of flooding over 30 yrs
- 0.0%
- Est. flood insurance / yr
- $507 – $1,088
Fire risk 3/10 · Minor
- Est. fire insurance / yr
- $947 – $1,759
Heat risk 9/10 · Severe
- Hot days now (above 106°F)
- 7 days/yr
- Hot days in 30 yrs
- 20 days/yr
Wind risk 9/10 · Severe
- Chance of severe wind over 30 yrs
- 99.0%
Air-quality risk 1/10 · Minimal
- Unhealthy air days now
- 0 days/yr
- Unhealthy air days in 30 yrs
- 0 days/yr
Risk factors via First Street. Map © Google.
Why this score? — see what drove the B+ grade
The composite is a weighted blend of 9 inputs, each scored 0–100. Each bar is that input's sub-score; the figure is the points it added to the 100-point composite (weight × sub-score).
- Cash flow +30.0/30.0
- ARV discount +15.0/15.0
- 1% rule +10.0/10.0
- DSCR +10.0/10.0
- Schools +5.3/10.0
- Livability +3.9/5.0
- Rent growth +3.2/5.0
- Condition / age +2.5/5.0
- Appreciation +0.0/10.0
$105,000
🖨 Deal sheet 📄 Offer letter ✓ Due diligence
Listing remarks MLS
Investment Special - This home needs serious remodeling. After Repair Value approximately $120,000. The tear out has been started. This is a great 2022 project. Seller has requested cash only offers. Oversized Lot. Great single family home or rental home. Property Management available.
Key facts
- Wood repaired
- Public water
- 8,712 sq ft lot
Tags
Property features AI
Finance
- HOA & community: No association
Exterior
- Parking: Driveway with open parking; Two total parking spaces
- Utilities: Public water; Public sewer; Circuit breaker electrical service
- Home design: Single-story (one level); Detached property; Resale home
- Construction: Frame construction; Slab foundation
- Exterior features: Chain link backyard fence; Interior lot; Rolled/hot mop roof; Paved, county-maintained road access
Interior
- Kitchen: Refrigerator included; Eat-in kitchen; Kitchen currently under construction
- Bedrooms: Master bedroom on the first floor; Additional bedrooms on the first floor
- Flooring: Tile
- Bathrooms: Two full bathrooms (both on the first floor); Bathroom currently under construction
- Heating & cooling: Wall/window cooling units
- Interior features: Tile flooring; Double-pane windows; Some blinds
- Laundry & utility: Electric water heater
Neighborhood map
What this means for you Summary
Snapshot
- This is a 3-bed/1.0-bath single-family listed at $105k.
Deal economics
- At list price, monthly cash flow is $829 ($10k/yr) — positive.
- The deal already cash-flows at list — no discount required.
- Meets the 1% rule at list price ($2k rent vs $105k).
- Recommended offer: $92k (12.0% below list) — sets the bar for market timing.
- Cap rate 15.8% vs local median 4.6% in Milton — top-decile yield for the area; either an underpriced asset or a hidden risk that comps aren't pricing in. Stress-test before assuming the spread holds.
Location & tenants
- Location reads 78/100 on livability (#166 in FL, #2,480 nationally) — a middle-class / working-renter tenant base. Strengths: cost of living A+, housing A+, health & safety A+; Watch: amenities D-, commute F.
- Santa Rosa (suburban): math 63% / reading 60% proficiency, ranked #8 of 73 in FL (top 11%) — acceptable for families but not a draw, mixed tenant base, ~2y average lease.
- Market conditions: Rents rising (+2.7%/yr); 360 active listings in the ZIP; 2 comparable units currently listed for rent nearby; solid renter incomes; 1,983 units permitted in Santa Rosa County in 2024 (128 in 5+ unit buildings).
Forward outlook
- Local home prices are declining (-3.0%/yr); year-one equity from $726 of loan paydown is wiped out by about $3k of value loss. Plan a longer hold.
- Santa Rosa County population projected at +31% by 2050 — long-run rental-demand tailwind backs the buy-and-hold thesis.
- At projected returns (-3.0% appreciation + 2.7% rent growth), your $29k cash investment doubles in ~4 years — after that, you're playing with house money.
Negotiation context
- It's been on market 255 days — a 12% lower offer ($92k) is reasonable based on typical stale-listing flexibility.
- 3 sale attempts since 6y ago; this cycle's ask has dropped $11k (9%) from the opening price — seller is motivated, your offer sets the floor, not the list.
- Current owner paid $48k; list at $105k implies a 116% gain — meaningful room to come down on a strong offer.
Risks & watch-outs
- Watch-outs: built in 1958 — expect roof / HVAC / electrical / plumbing capex.
- Climate carrying-cost: severe wind risk, 99% chance of damaging wind over 30y; extreme-heat days projected 7→20/yr by 2055 (HVAC capex compounding) — expect insurance premiums to compound above CPI over the hold.
Questions for the listing agent
- It's been on market 255 days. Have you received any prior offers? Is the seller open to a 12% concession, seller financing, or rate buy-down credit?
- Built in 1958 — when were the roof, HVAC, electrical panel, plumbing, and water heater last replaced?
- Why hasn't it sold? Are there any deal-killer items the seller is aware of (foundation, flood, title, zoning, code violations)?
- Is there a deadline driving the sale (1031 exchange, divorce, estate, relocation)? That informs how much negotiation room exists.
- Schools are B-rated — typically a magnet for longer-tenancy family renters. What's the average tenant stay here, and is there a school-zone premium baked into asking?
- What's the average days-on-market for RENTAL listings here right now (not sales)? A rising rental-DOM trend means longer vacancies and softer asking-rent achievability than the comps imply.
- What's the recent tenant-quality profile in this submarket — average credit score on applications, eviction rate, late-payment / NSF rate, and stable-employment percentage? A property-management company in the area should have these aggregated.
- How much new for-sale + rental construction is in the pipeline within 1–3 miles? Heavy new supply typically softens prices + rents 12–24 months out; constrained supply supports both.
Investment metrics
- 1% rule
- 1.81% ✓
- Cap rate
- 15.77%
- Cash-on-cash
- 33.86%
- DSCR
- 2.51
- GRM
- 4.6
CMA / ARV
- ARV (on-the-fly)
- $201,600
- Comps found
- 12
Show comp detail 12 sales within ~0.75 mi
| Address | Dist | Beds/Ba | Sqft | Sold | Price | $/sf | Match |
|---|---|---|---|---|---|---|---|
| 6456 Gaynell Ave | 0.08mi | 3/1.0 | 1,152 (+3%) | 5mo | $178,000 | $155 | 87 |
| 6094 Syrcle Ave | 0.15mi | 3/2.0 | 1,120 (0%) | 10mo | $233,000 | $208 | 80 |
| 6098 Syrcle Ave | 0.14mi | 3/2.0 | 1,152 (+3%) | 15mo | $185,000 | $161 | 72 |
| 6400 Gaynell Ave | 0.21mi | 3/2.0 | 1,167 (+4%) | 12mo | $229,000 | $196 | 69 |
| 6439 Kennington Cir | 0.37mi | 3/2.0 | 1,215 (+8%) | 4mo | $219,000 | $180 | 61 |
| 6017 Syrcle Ave | 0.32mi | 3/1.5 | 1,050 (-6%) | 15mo | $170,000 | $162 | 60 |
| 6415 Julia Dr | 0.40mi | 3/1.0 | 1,252 (+12%) | 4mo | $190,000 | $152 | 58 |
| 5996 Savannah Dr | 0.65mi | 3/2.0 | 1,144 (+2%) | 7mo | $199,900 | $175 | 56 |
| 6635 Wesdon Ct | 0.53mi | 3/1.5 | 1,008 (-10%) | 1mo | $185,000 | $184 | 55 |
| 6409 Julia Dr | 0.39mi | 3/1.0 | 1,000 (-11%) | 12mo | $191,000 | $191 | 54 |
| 6003 Savannah Dr | 0.63mi | 3/2.0 | 1,153 (+3%) | 11mo | $249,000 | $216 | 53 |
| 5910 Independence Dr | 0.65mi | 2/1.0 (-1) | 995 (-11%) | 14mo | $167,000 | $168 | 34 |
Match score weights: distance 35% · size 25% · config 20% · recency 20%. Top-matched comps best support the ARV.
Projected returns pro-forma
-3.0% appreciation · 2.7% rent growth · sell at horizon
- IRR
- 28.9%
- Equity multiple
- 2.20×
- Total profit
- $35,237
- Equity at exit
- $15,656
- IRR
- 36.1%
- Equity multiple
- 4.28×
- Total profit
- $96,358
- Equity at exit
- $9,078
Cash invested: $29,400 (down + closing). Projections, not guarantees.
Landlord ↔ Tenant lean methodology
- Overall (STATE)
- 87 Strongly Landlord-Friendly
- State Florida
- 87 Strongly Landlord-Friendly · R+3
- County
- — inherits STATE
- City
- — inherits STATE
ZIP-level market 32570
- Home prices YoY
- -15.1%
- Rents YoY
- 2.7%
- Active inventory
- 360
- Price-to-rent
- 4.6×
Monthly cashflow live
- Estimated rent
- $1,900 medium interval (Pro) →
- Mortgage (P&I)
- −$551
- Tax from tax record
- −$77 /mo · $929/yr
- Insurance
- −$44
- HOA
- −$0
- Vacancy / Maint / Mgmt
- −$399
- Net cashflow
- $829
Break-even live
UW: 25.0% down · 7.5% · 30yr · 1.5% tax · 5.0% vac · 8.0% maint · 8.0% mgmt
Financing live
Cash to close
- Down payment
- $26,250
- Closing costs
- $3,150
- Reserves months
- —
- Total cash needed
- —
Loan-product check · same deal, 3 products live
Conventional
25% down · 7.5% · 30yr
- Down + closing
- —
- Monthly P&I
- —
- Monthly cashflow
- —
- DSCR
- —
- Eligible?
- —
Personal DTI + credit; lowest rate.
DSCR
20% down · 8.5% · 30yr
- Down + closing
- —
- Monthly P&I
- —
- Monthly cashflow
- —
- DSCR
- —
- Eligible?
- —
No personal income docs; deal must DSCR.
Hard money
10% down · 12.0% · 12mo
- Down + closing
- —
- Monthly P&I
- —
- Monthly cashflow
- —
- DSCR
- —
- Eligible?
- —
Short-term bridge; refi at stabilization.
Rent comps 2 comps
| Address | Beds | Baths | Sqft | Rent | $/sqft | DOM | Units | Dist |
|---|---|---|---|---|---|---|---|---|
| 6460 Stewart St Milton, FL | 1.0–3.0 | 1.0–2.0 | 872 | $1,500 | $1.72 | 23d | 1 | 0.35mi |
| 6593 Lee St Unit B Milton, FL | 2.0 | 1.0 | 750 | $1,300 | $1.73 | 21d | 1 | 1.03mi |
Listing history 29 events
-
2026-06-18days on market $105,000 Active 255 DOM
-
2026-06-17days on market $105,000 Active 254 DOM
-
2026-06-16days on market $105,000 Active 253 DOM
-
2026-06-15days on market $105,000 Active 252 DOM
-
2026-06-14days on market $105,000 Active 250 DOM
-
2026-06-10days on market $105,000 Active 247 DOM
-
2026-06-09days on market $105,000 Active 246 DOM
-
2026-06-09price $105,000 Active 245 DOM
-
2026-06-08days on market $109,500 Active 245 DOM
-
2026-06-07days on market $109,500 Active 244 DOM
-
2026-06-05days on market $109,500 Active 241 DOM
-
2026-06-03days on market $109,500 Active 240 DOM
-
2026-06-02days on market $109,500 Active 239 DOM
-
2026-06-01days on market $109,500 Active 238 DOM
-
2026-05-31days on market $109,500 Active 237 DOM
-
2026-05-31days on market $109,500 Active 236 DOM
-
2025-11-24price $109,500
-
2025-10-06$115,777 Active
-
2023-10-03soldstatus $48,500
-
2022-04-01soldstatus $65,000 Sold 289-char remark
Show marketing remark (289 chars)
Investment Special - This home needs serious remodeling. After Repair Value approximately $120,000. The tear out has been started. This is a great 2022 project. Seller has requested cash only offers. Oversized Lot. Great single family home or rental home. Property Management available.
-
2022-04-01soldstatus $65,000
Show marketing remark (289 chars)
Investment Special - This home needs serious remodeling. After Repair Value approximately $120,000. The tear out has been started. This is a great 2022 project. Seller has requested cash only offers. Oversized Lot. Great single family home or rental home. Property Management available.
-
2022-02-26status Pending 289-char remark
Show marketing remark (289 chars)
Investment Special - This home needs serious remodeling. After Repair Value approximately $120,000. The tear out has been started. This is a great 2022 project. Seller has requested cash only offers. Oversized Lot. Great single family home or rental home. Property Management available.
-
2022-01-31price $65,000 289-char remark
Show marketing remark (289 chars)
Investment Special - This home needs serious remodeling. After Repair Value approximately $120,000. The tear out has been started. This is a great 2022 project. Seller has requested cash only offers. Oversized Lot. Great single family home or rental home. Property Management available.
-
2022-01-22price $69,900 289-char remark
Show marketing remark (289 chars)
Investment Special - This home needs serious remodeling. After Repair Value approximately $120,000. The tear out has been started. This is a great 2022 project. Seller has requested cash only offers. Oversized Lot. Great single family home or rental home. Property Management available.
-
2022-01-14$72,000 Active 289-char remark
Show marketing remark (289 chars)
Investment Special - This home needs serious remodeling. After Repair Value approximately $120,000. The tear out has been started. This is a great 2022 project. Seller has requested cash only offers. Oversized Lot. Great single family home or rental home. Property Management available.
-
2020-11-02soldstatus $55,000
-
2020-10-30soldstatus $55,000 218-char remark
Show marketing remark (218 chars)
Attention Investors - 3 BR/1 BA with some updates already completed, Newer double paned windows ~ roof in 2014 - chain link fenced yard. Only window units, no heat, will a little more updates, this could a great home.
-
2020-10-02$68,000 218-char remark
Show marketing remark (218 chars)
Attention Investors - 3 BR/1 BA with some updates already completed, Newer double paned windows ~ roof in 2014 - chain link fenced yard. Only window units, no heat, will a little more updates, this could a great home.
-
1975-01-01soldstatus $6,800
ⓘ Source: listings_history table (triggers on properties + properties_extension) + one-shot
backfill from property_details.listing_events for pre-trigger history.
Tax reassessment forecast FL · Resets to sale price
- Current annual tax
- $929 · $77/mo
- Projected year-2 tax
- $929 · $77/mo
- Expected delta
- $0/yr ($0/mo · 0.0%)
ⓘ Screening estimate from a state-policy table — verify with the county assessor before closing.
Climate risk First Street
- Flood 1/10 Low FEMA zone X (unshaded) · 0% chance over 30 yrs
- Wildfire 3/10 Moderate
- Heat 9/10 Extreme 7 d/yr ≥106°F today · 20 d/yr by 30 yrs out
- Wind 9/10 Extreme 99% chance of damaging wind over 30 yrs
- Air quality 1/10 Low 0 unhealthy d/yr today · 0 by 30 yrs out
Nearby sold comps map
Loading sold comps map…
Walkable amenities ~0.75 mi
Loading nearby amenities…
Taxation est. · year 1
- Rental income
- $22,804
- − Mortgage interest
- −$5,882
- − Property taxes
- −$929
- − Insurance
- −$525
- − Repairs & maintenance
- −$1,824
- − Management
- −$1,824
- − Depreciation
- −$3,055
- Taxable income
- $8,765
- Est. tax owed @ 24.0%
- −$2,104
- After-tax cash flow
- $7,850/yr
For passive investors: Depreciation is non-cash, so a rental often shows a tax loss while cash-flowing — sheltering income. Rental losses are passive: they offset passive income freely, and up to $25,000/yr can offset ordinary (W-2) income if you actively participate and your MAGI is under $100k (phasing out to $0 by $150k); unused losses carry forward. On sale, claimed depreciation is recaptured at up to 25%, and gains may owe capital-gains tax (a 1031 exchange can defer both). Figures are a year-1 estimate at your 24.0% rate — not tax advice; consult a CPA.
Schools (NCES district)
- District
- Santa Rosa
- NCES district ID
- 1201650
- Math proficiency
- 63% ▼ -6.00%
- Reading proficiency
- 60% ▼ -5.00%
- Median HH income
- $58,161
- Composite
- 53.12/100
- National rank
- #1511
- State rank
- #8 of 73 in FL
Livability — Milton
- Score
- 78/100
- State rank
- #166
- US rank
- #2480
Category grades
Schools grade is shown separately in the Schools card above.
Census & demographics
- County
- Santa Rosa County · 194,764 people
- City population
- 69,025
- Metro
- Pensacola-Ferry Pass-Brent, FL
- Population (ZIP)
- 37,197
- Household income
- $77,222
- Rent vs Own
- Severe rent burden
- 590.0
Population outlook (Santa Rosa County) Hauer SSP2
- Today (2025)
- 195,978 people
- By 2030
- 209,782 · +7.0%
- By 2040
- 235,293 · +20.1%
- By 2050
- 256,408 · +30.8%
- By 2075
- 298,074 · +52.1%
- By 2100
- 303,216 · +54.7%
Race, ethnicity, and origin ACS 2023
- Neighborhood character
- Predominantly White (80%)
- Race & ethnicity
- White 80% Two or more races 7% Black 6% Hispanic / Latino 6% Asian 1%
- Hispanic origin (detail)
- Mexican 2% Puerto Rican 2%
- Common ancestry
- Italian 4% Lithuanian 3% Portuguese 2%
- Foreign-born
- 4% · Canada
- Languages at home
- 94% English-only · Spanish 4% Other Asian/Pacific 1%
Political lean MEDSL · Santa Rosa
- 2024 margin
- Solid R (+51.0) · D 24.1% · R 75.0%
- 2008→2024 swing
- -3.0pp toward R · 2008: -47.9pp · 2024: -51.0pp
- All cycles
- 2024: R+51.0 2020: R+46.5 2016: R+53.5 2012: R+52.6 2008: R+47.9
Not yet ingested
- Civics
- —
Market trends
- HPI YoY
- ▼ -51.06%
- Current HPI
- 287.7469
- Rent YoY
- ▲ 2.70%
- Metro
- Pensacola-Ferry Pass-Brent, FL
- State GDP YoY
- ▲ 3.28%
- F500 in state
- 36
Industry mix (Fortune 500 HQ in FL)
| Industry | F500 HQs | Revenue |
|---|---|---|
| Industrial Technology | 2 | $29B |
|
||
| Insurance | 2 | $17B |
|
||
| Retail | 1 | $60B |
|
||
| Technology Distribution | 1 | $58B |
|
||
| Homebuilding | 1 | $35B |
|
||
| Technology Manufacturing | 1 | $35B |
|
||
Price history
+1510.3% since first listed13 events — show timeline
- 2025-11-24 Price Changed $109,500 PARMLS
- 2025-10-06 Listed $115,777 PARMLS
- 2023-10-03 Sold (Public Records) $48,500 Public Records
- 2022-04-01 Sold (Public Records) $65,000 Public Records
- 2022-04-01 Sold (MLS) $65,000 PARMLS
- 2022-02-26 Pending — PARMLS
- 2022-01-31 Price Changed $65,000 PARMLS
- 2022-01-22 Price Changed $69,900 PARMLS
- 2022-01-14 Listed $72,000 PARMLS
- 2020-11-02 Sold (Public Records) $55,000 Public Records
- 2020-10-30 Sold (MLS) $55,000 PARMLS
- 2020-10-02 Listed $68,000 PARMLS
- 1975-01-01 Sold (Public Records) $6,800 Public Records
Property tax history
+7.8%/yrLatest (2025): $929 · +14.3% YoY. Source: county tax records.
Cash-flow waterfall
monthlySold comps — $/sqft
last 12 mo · ≤1 miLoading sold comps…