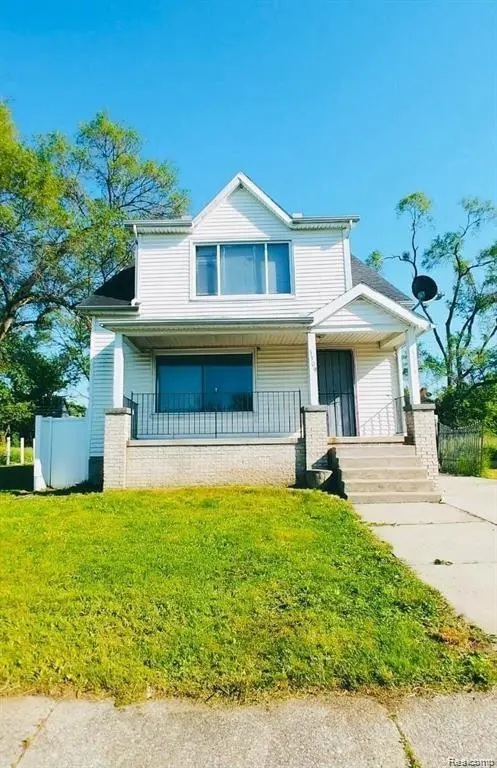
3309 Doris St · Detroit, MI
Flood risk 1/10 · Minimal
- FEMA flood zone
- X (unshaded)
- Chance of flooding over 30 yrs
- 0.0%
- Est. flood insurance / yr
- $473 – $860
Fire risk 1/10 · Minimal
- Est. fire insurance / yr
- $784 – $1,456
Heat risk 3/10 · Minor
- Hot days now (above 97°F)
- 7 days/yr
- Hot days in 30 yrs
- 15 days/yr
Wind risk 2/10 · Minimal
- Chance of severe wind over 30 yrs
- —
Air-quality risk 4/10 · Minor
- Unhealthy air days now
- 4 days/yr
- Unhealthy air days in 30 yrs
- 6 days/yr
Risk factors via First Street. Map © Google.
Why this score? — see what drove the C grade
The composite is a weighted blend of 9 inputs, each scored 0–100. Each bar is that input's sub-score; the figure is the points it added to the 100-point composite (weight × sub-score).
- Cash flow +27.3/30.0
- DSCR +9.5/10.0
- 1% rule +7.8/10.0
- Rent growth +4.0/5.0
- Livability +3.7/5.0
- Condition / age +2.5/5.0
- Schools +1.3/10.0
- ARV discount +0.0/15.0
- Appreciation +0.0/10.0
$110,000
🖨 Deal sheet (PDF) 📄 Offer letter ✓ Due diligence
Listing remarks
3309 Doris Street | Detroit, MI 48238 !!!!!! 4 Beds | 2 Baths-2-Unit Duplex Prime Investment Opportunity – Location, Income Potential, and Upside! This charming duplex is a true money maker in the desirable Oakman Boulevard Community (Robt Oakmans Livernois Ave & Dexter Ave subdivision). Perfect for investors, house hackers, or owner-occupants looking to offset their mortgage with rental income. Two separate units offering flexibility for rental income. Solid bones ready for cosmetic updates to maximize value and rents Location, Location, Location! Nestled in a quiet residential pocket with strong boulevard character, this property puts you minutes from fantastic local restauran
Key facts
- Income potential
- Two separate units
- Cosmetic updates
Tags
Property features AI
Exterior
- Parking: 1 parking space
- Utilities: Public water available; Public sewer available
- Home design: Multi-family residential income property; Two-story
- Construction: Vinyl siding; Brick/mortar foundation
- Exterior features: Paved road access; Pets allowed (contact for details)
Interior
- Bathrooms: 2 full bathrooms
- Heating & cooling: Forced air heating (natural gas); No central cooling
- Interior features: Unfinished basement
Neighborhood map
What this means for you Summary
Snapshot
- This is a 4-bed/1.5-bath single-family listed at $110k.
Deal economics
- At list price, monthly cash flow is $319 ($4k/yr) — positive.
- The deal already cash-flows at list — no discount required.
- Meets the 1% rule at list price ($1k rent vs $110k).
Location & tenants
- Location reads 73/100 on livability (#218 in MI) — a middle-class / working-renter tenant base. Strengths: amenities A+, commute A+, cost of living A+; Watch: schools F, crime F, employment F.
- Detroit Public Schools Community District (urban): math 10% / reading 24% proficiency, ranked #499 of 540 in MI (top 92%) — low school quality limits family demand, transient renter base, plan for 1-2y turnover; 90% free/reduced lunch — lower-income household profile, screen leases tightly.
- Market conditions: Rents rising fast (+6.1%/yr); 346 active listings in the ZIP; 34 comparable units currently listed for rent nearby; rentals at typical pace (median 18d on market — plan ~3-4 weeks tenant-placement turnaround); lower-income renter base — watch delinquency; 2,639 units permitted in Wayne County in 2024 (1,216 in 5+ unit buildings).
- At $1,413/mo this rent would consume 51% of the median local household income ($33k/yr) (locally 2172% of renters already pay >50% of income on rent) — very limited rent-growth headroom before tenants either downsize or default.
Forward outlook
- Local home prices are declining (-3.0%/yr); year-one equity from $761 of loan paydown is wiped out by about $3k of value loss. Plan a longer hold.
- Wayne County population projected at -17% by 2050 — secular population decline; favor cash flow + early exit over multi-decade hold.
- At projected returns (-3.0% appreciation + 6.1% rent growth), your $31k cash investment doubles in ~8 years — after that, you're playing with house money.
Negotiation context
- Only 4 days on market — expect competitive offers; lowballing is unlikely to land.
- 7 sale attempts since 8y ago with the ask held roughly flat each time — persistent listings suggest the price (not the market) is what's stuck; bring a comps-based counter.
Risks & watch-outs
- Watch-outs: built in 1927 — expect roof / HVAC / electrical / plumbing capex.
Questions for the listing agent
- Built in 1927 — when were the roof, HVAC, electrical panel, plumbing, and water heater last replaced?
- Is there a deadline driving the sale (1031 exchange, divorce, estate, relocation)? That informs how much negotiation room exists.
- Schools are F-rated, which usually means shorter tenancies and higher turnover. Who's the typical renter profile here, and what's been the actual vacancy rate?
- Crime grade is F in this area — have there been break-ins, vandalism, or insurance claims at this property in the last 3 years? What carrier currently insures it and at what premium?
- What's the average days-on-market for RENTAL listings here right now (not sales)? A rising rental-DOM trend means longer vacancies and softer asking-rent achievability than the comps imply.
- What's the recent tenant-quality profile in this submarket — average credit score on applications, eviction rate, late-payment / NSF rate, and stable-employment percentage? A property-management company in the area should have these aggregated.
- How much new for-sale + rental construction is in the pipeline within 1–3 miles? Heavy new supply typically softens prices + rents 12–24 months out; constrained supply supports both.
Investment metrics
- 1% rule
- 1.28% ✓
- Cap rate
- 9.77%
- Cash-on-cash
- 12.43%
- DSCR
- 1.55
- GRM
- 6.5
CMA / ARV
- ARV (median comp)
- $85,006
- List price
- $110,000
- Delta
- 30.58%
- Verdict
- OVERPRICED
- Comps
- 20 within 1.0 mi
Show comp detail 12 sales within ~0.75 mi
| Address | Dist | Beds/Ba | Sqft | Sold | Price | $/sf | Match |
|---|---|---|---|---|---|---|---|
| 4210 Pasadena St | 0.42mi | 4/2.0 | 1,678 (-1%) | 4mo | $239,000 | $142 | 74 |
| 2360 Oakman Blvd | 0.29mi | 3/1.5 (-1) | 1,677 (-1%) | 8mo | $249,000 | $148 | 73 |
| 3013 Waverly St | 0.50mi | 4/3.0 | 1,698 (+0%) | 6mo | $170,000 | $100 | 66 |
| 14827 Petoskey Ave | 0.40mi | 3/2.5 (-1) | 1,717 (+1%) | 6mo | $85,000 | $50 | 65 |
| 2989 Oakman Ct | 0.26mi | 4/1.5 | 1,919 (+13%) | 4mo | $60,000 | $31 | 62 |
| 2978 Doris St | 0.18mi | 4/2.0 | 1,934 (+14%) | 5mo | $33,000 | $17 | 62 |
| 4101 Pasadena St | 0.41mi | 3/1.5 (-1) | 1,778 (+5%) | 12mo | $100,000 | $56 | 58 |
| 13620 Santa Rosa Dr | 0.67mi | 3/1.0 (-1) | 1,700 (+0%) | 6mo | $85,000 | $50 | 56 |
| 4209 Pasadena St | 0.44mi | 4/2.5 | 1,901 (+12%) | 8mo | $215,000 | $113 | 48 |
| 3351 Tyler St | 0.53mi | 3/2.0 (-1) | 1,888 (+11%) | 5mo | $83,000 | $44 | 45 |
| 2325 Kendall St | 0.65mi | 4/2.0 | 1,922 (+13%) | 2mo | $135,000 | $70 | 44 |
| 15376 Parkside St | 0.60mi | 3/1.0 (-1) | 1,488 (-12%) | 11mo | $65,000 | $44 | 36 |
Match score weights: distance 35% · size 25% · config 20% · recency 20%. Top-matched comps best support the ARV.
Projected returns pro-forma
-3.0% appreciation · 6.14% rent growth · sell at horizon
- IRR
- 5.8%
- Equity multiple
- 1.23×
- Total profit
- $7,147
- Equity at exit
- $16,401
- IRR
- 17.9%
- Equity multiple
- 2.71×
- Total profit
- $52,728
- Equity at exit
- $9,511
Cash invested: $30,800 (down + closing). Projections, not guarantees.
Landlord ↔ Tenant lean methodology
- Overall (STATE)
- 62 Landlord-Friendly
- State Michigan
- 62 Landlord-Friendly · EVEN
- County
- — inherits STATE
- City
- — inherits STATE
ZIP-level market 48238
- Home prices YoY
- -14.4%
- Rents YoY
- 6.1%
- Active inventory
- 346
- Price-to-rent
- 6.5×
Monthly cashflow live
- Estimated rent
- $1,413 high interval (Pro) →
- Mortgage (P&I)
- −$577
- Tax from tax record
- −$175 /mo · $2,097/yr
- Insurance
- −$46
- HOA
- −$0
- Vacancy / Maint / Mgmt
- −$297
- Net cashflow
- $319
Break-even live
Sensitivity live
| Price | -10% $381 | -5% $350 | +0% $319 | +5% $288 | +10% $257 |
|---|---|---|---|---|---|
| Rent | -10% $207 | -5% $263 | +0% $319 | +5% $375 | +10% $431 |
| Rate | -1.0pp $374 | -0.5pp $347 | base $319 | +0.5pp $291 | +1.0pp $262 |
UW: 25.0% down · 7.5% · 30yr · 1.5% tax · 5.0% vac · 8.0% maint · 8.0% mgmt
Financing live
Cash to close
- Down payment
- $27,500
- Closing costs
- $3,300
- Reserves months
- —
- Total cash needed
- —
Loan-product check · same deal, 3 products live
Conventional
25% down · 7.5% · 30yr
- Down + closing
- —
- Monthly P&I
- —
- Monthly cashflow
- —
- DSCR
- —
- Eligible?
- —
Personal DTI + credit; lowest rate.
DSCR
20% down · 8.5% · 30yr
- Down + closing
- —
- Monthly P&I
- —
- Monthly cashflow
- —
- DSCR
- —
- Eligible?
- —
No personal income docs; deal must DSCR.
Hard money
10% down · 12.0% · 12mo
- Down + closing
- —
- Monthly P&I
- —
- Monthly cashflow
- —
- DSCR
- —
- Eligible?
- —
Short-term bridge; refi at stabilization.
Rent comps 34 comps
| Address | Beds | Baths | Sqft | Rent | $/sqft | DOM | Units | Dist |
|---|---|---|---|---|---|---|---|---|
| 3040 Kendall St Detroit, MI | 5.0 | 1.0 | 1188 | $1,386 | $1.17 | 13d | 1 | 0.13mi |
| 3209 W Grand St Detroit, MI | 3.0 | 1.0 | 1550 | $1,103 | $0.71 | 44d | 1 | 0.34mi |
| 15345 Parkside St Detroit, MI | 3.0 | 1.0 | 1152 | $1,300 | $1.13 | 44d | 1 | 0.53mi |
| 3740 Tyler St Unit 1 Detroit, MI | 3.0 | 1.0 | 1300 | $1,300 | $1.00 | 5d | 1 | 0.54mi |
| 4287 W Grand St Unit 4289 Detroit, MI | 3.0 | 1.0 | 1250 | $1,000 | $0.80 | 44d | 1 | 0.55mi |
| 4336 Buena Vista St Detroit, MI | 3.0 | 1.0 | 1300 | $1,100 | $0.85 | 44d | 1 | 0.76mi |
| 4341 Glendale St Detroit, MI | 4.0 | 2.5 | 1832 | $1,680 | $0.92 | 5d | 1 | 0.83mi |
| 13225 Santa Rosa Dr Detroit, MI | 5.0 | 2.0 | 2100 | $1,700 | $0.81 | 5d | 1 | 0.84mi |
| 13620 Tuller St Detroit, MI | 4.0 | 1.0 | 1064 | $1,374 | $1.29 | 13d | 1 | 0.87mi |
| 2474 Fullerton St Detroit, MI | 3.0 | 1.0 | 1400 | $1,300 | $0.93 | 15d | 1 | 0.93mi |
| 1926 Clements St Unit 1926 Detroit, MI | 3.0 | 1.0 | 1150 | $1,250 | $1.09 | 20d | 1 | 0.95mi |
| 1926 Clements St Detroit, MI | 3.0 | 1.0 | 1150 | $1,150 | $1.00 | 5d | 1 | 0.95mi |
| 12546 Broadstreet Ave Detroit, MI | 3.0 | 1.5 | 1899 | $1,250 | $0.66 | 45d | 1 | 0.98mi |
| 14011 Roselawn St Detroit, MI | 4.0 | 1.5 | 1300 | $1,450 | $1.12 | 18d | 1 | 1.01mi |
| 14011 Roselawn St Detroit, MI | 4.0 | 1.5 | 1300 | $1,450 | $1.12 | 2d | 1 | 1.01mi |
| Ohio St Unit 4 Detroit, MI | 4.0 | 1.5 | 1400 | $750 | $0.54 | 44d | 1 | 1.14mi |
| 14242 Ohio St Detroit, MI | 4.0 | 1.0 | 1400 | $1,000 | $0.71 | 44d | 1 | 1.15mi |
| 13979 Cherrylawn St Detroit, MI | 3.0 | 1.0 | 1296 | $1,334 | $1.03 | 21d | 1 | 1.17mi |
| 15457 Cloverlawn St Detroit, MI | 3.0 | 2.0 | 1500 | $1,275 | $0.85 | 25d | 1 | 1.19mi |
| 3322 Webb St Detroit, MI | 3.0 | 1.0 | 1600 | $1,250 | $0.78 | 17d | 1 | 1.21mi |
| 3322 Webb St Unit 1 Detroit, MI | 3.0 | 1.0 | 1656 | $1,350 | $0.82 | 44d | 1 | 1.21mi |
| 3322 Webb St Unit 2 Detroit, MI | 3.0 | 1.0 | 1656 | $1,350 | $0.82 | 44d | 1 | 1.21mi |
| 11704 Broadstreet Ave Detroit, MI | 3.0 | 1.0 | 1200 | $1,050 | $0.88 | 44d | 1 | 1.31mi |
| 16582 Santa Rosa Dr Detroit, MI | 3.0 | 1.0 | 1314 | $1,399 | $1.06 | 18d | 1 | 1.31mi |
| 16255 Lilac St Detroit, MI | 3.0 | 1.0 | 1312 | $1,394 | $1.06 | 18d | 1 | 1.33mi |
| 3031 Lawrence St Detroit, MI | 4.0 | 1.0 | 1700 | $1,600 | $0.94 | 17d | 1 | 1.37mi |
| 15756 Ohio St Detroit, MI | 5.0 | 2.0 | 1934 | $1,700 | $0.88 | 25d | 1 | 1.37mi |
| 2634 Lawrence St Detroit, MI | 3.0 | 1.5 | 1388 | $1,600 | $1.15 | 2d | 1 | 1.39mi |
| 13620 Kentucky St Detroit, MI | 3.0 | 1.0 | 1248 | $1,200 | $0.96 | 5d | 1 | 1.39mi |
| 326 Eason St Highland Park, MI | 3.0 | 1.0 | 1256 | $1,300 | $1.04 | 18d | 1 | 1.43mi |
| 3266 Calvert Ave Fl 2 Detroit, MI | 3.0 | 1.0 | 1279 | $1,300 | $1.02 | 25d | 1 | 1.46mi |
| 3226 Calvert Ave Detroit, MI | 3.0 | 1.0 | 1100 | $1,200 | $1.09 | 13d | 1 | 1.46mi |
| 3224 Calvert St Detroit, MI | 3.0 | 1.0 | 1150 | $1,150 | $1.00 | 44d | 1 | 1.46mi |
| 2655 Collingwood St Detroit, MI | 4.0 | 1.5 | 1881 | $2,700 | $1.44 | 2d | 1 | 1.47mi |
Listing history 36 events
-
2026-06-18days on market $110,000 Active 4 DOM
-
2026-06-17days on market $110,000 Active 3 DOM
-
2026-06-16days on market $110,000 Active 2 DOM
-
2026-06-15remarks 689-char remark
-
2026-06-15$110,000 Active 1 DOM
-
2026-06-15remarks 678-char remark
-
2026-06-15pricedays on market $110,000 Active 1 DOM
-
2026-06-13days on market $111,000 Active 404 DOM
-
2026-06-13days on market $111,000 Active 403 DOM
-
2026-06-09days on market $111,000 Active 400 DOM
-
2026-06-08days on market $111,000 Active 399 DOM
-
2026-06-07days on market $111,000 Active 398 DOM
-
2026-06-04days on market $111,000 Active 395 DOM
-
2026-06-03days on market $111,000 Active 394 DOM
-
2026-06-01days on market $111,000 Active 392 DOM
-
2026-05-31days on market $111,000 Active 391 DOM
-
2026-03-26price $111,000 217-char remark
-
2026-03-26price $111,000 218-char remark
-
2026-01-26price $114,000 217-char remark
-
2026-01-26price $114,000 218-char remark
-
2025-11-27price $116,000 217-char remark
-
2025-11-27price $116,000 218-char remark
-
2025-10-28price $118,000 217-char remark
-
2025-10-28price $118,000 218-char remark
-
2025-05-05$120,000 Active 218-char remark
-
2025-05-05$120,000 Active 217-char remark
-
2020-09-25soldstatus $109,000
-
2019-05-02historical
-
2018-11-25$300,000
-
2018-11-13historical
-
2018-11-13historical
-
2018-09-25$50,000 Active
-
2018-09-25$50,000 Active
-
2014-12-04soldstatus $87,100
-
2014-07-10soldstatus $85,020
-
2013-08-29soldstatus $45,000
ⓘ Source: listings_history table (triggers on properties + properties_extension) + one-shot
backfill from property_details.listing_events for pre-trigger history.
Tax reassessment forecast MI · Partial reset (capped growth)
- Current annual tax
- $2,097 · $175/mo
- Projected year-2 tax
- $2,097 · $175/mo
- Expected delta
- $0/yr ($0/mo · 0.0%)
ⓘ Screening estimate from a state-policy table — verify with the county assessor before closing.
Climate risk First Street
- Flood 1/10 Low FEMA zone X (unshaded) · 0% chance over 30 yrs
- Wildfire 1/10 Low
- Heat 3/10 Moderate 7 d/yr ≥97°F today · 15 d/yr by 30 yrs out
- Wind 2/10 Low
- Air quality 4/10 Moderate 4 unhealthy d/yr today · 6 by 30 yrs out
Nearby sold comps map
Loading sold comps map…
Walkable amenities ~0.75 mi
Loading nearby amenities…
Taxation est. · year 1
- Rental income
- $16,959
- − Mortgage interest
- −$6,162
- − Property taxes
- −$2,097
- − Insurance
- −$550
- − Repairs & maintenance
- −$1,357
- − Management
- −$1,357
- − Depreciation
- −$3,200
- Taxable income
- $2,237
- Est. tax owed @ 24.0%
- −$537
- After-tax cash flow
- $3,292/yr
For passive investors: Depreciation is non-cash, so a rental often shows a tax loss while cash-flowing — sheltering income. Rental losses are passive: they offset passive income freely, and up to $25,000/yr can offset ordinary (W-2) income if you actively participate and your MAGI is under $100k (phasing out to $0 by $150k); unused losses carry forward. On sale, claimed depreciation is recaptured at up to 25%, and gains may owe capital-gains tax (a 1031 exchange can defer both). Figures are a year-1 estimate at your 24.0% rate — not tax advice; consult a CPA.
Schools (NCES district)
- District
- Detroit Public Schools Community District
- NCES district ID
- 2601103
- Math proficiency
- 10% ▼ -2.00%
- Reading proficiency
- 24% ▲ 6.00%
- Median HH income
- $25,815
- Composite
- 13.06/100
- National rank
- #9564
- State rank
- #499 of 540 in MI
Livability — Detroit
- Score
- 73/100
- State rank
- #218
- US rank
- #5427
Category grades
Schools grade is shown separately in the Schools card above.
Census & demographics
- Census place
- Detroit, MI
- County
- Wayne County · 1,562,939 people
- City population
- 572,865
- Metro
- Detroit-Warren-Dearborn, MI
- Population (ZIP)
- 24,731
- Household income
- $33,315
- Rent vs Own
- Severe rent burden
- 2172.0
Population outlook (Wayne County) Hauer SSP2
- Today (2025)
- 1,675,273 people
- By 2030
- 1,620,300 · -3.3%
- By 2040
- 1,502,341 · -10.3%
- By 2050
- 1,384,039 · -17.4%
- By 2075
- 1,124,592 · -32.9%
- By 2100
- 881,193 · -47.4%
Race, ethnicity, and origin ACS 2023
- Neighborhood character
- Predominantly Black (94%)
- Race & ethnicity
- Black 94% Two or more races 3% White 1%
- Foreign-born
- 1%
Political lean MEDSL · Wayne
- 2024 margin
- Strong D (+29.0) · D 62.7% · R 33.7% · Other 3.6%
- 2008→2024 swing
- -20.5pp toward R · 2008: 49.5pp · 2024: 29.0pp
- All cycles
- 2024: D+29.0 2020: D+38.1 2016: D+37.3 2012: D+46.9 2008: D+49.5
Not yet ingested
- Civics
- —
Market trends
- HPI YoY
- ▼ -31.96%
- Current HPI
- 189.6227
- Rent YoY
- ▲ 6.14%
- Metro
- Detroit-Warren-Dearborn, MI
- State GDP YoY
- ▲ 1.37%
- F500 in state
- 28
Industry mix (Fortune 500 HQ in MI)
| Industry | F500 HQs | Revenue |
|---|---|---|
| Automotive Parts | 3 | $48B |
|
||
| Automotive | 2 | $372B |
|
||
| Chemicals | 1 | $45B |
|
||
| Automotive Retail | 1 | $29B |
|
||
| Healthcare / Medical Devices | 1 | $23B |
|
||
| Automotive Technology | 1 | $20B |
|
||
Price history
+144.4% since first listed24 events — show timeline
- 2026-06-14 Listed $110,000 MiRealSource-MiMLS
- 2026-06-14 Listing Removed — MiRealSource-MiMLS
- 2026-06-14 Listing Removed — REALCOMP
- 2026-06-14 Listed $110,000 REALCOMP
- 2026-03-26 Price Changed $111,000 MiRealSource-MiMLS
- 2026-03-26 Price Changed $111,000 REALCOMP
- 2026-01-26 Price Changed $114,000 MiRealSource-MiMLS
- 2026-01-26 Price Changed $114,000 REALCOMP
- 2025-11-27 Price Changed $116,000 MiRealSource-MiMLS
- 2025-11-27 Price Changed $116,000 REALCOMP
- 2025-10-28 Price Changed $118,000 MiRealSource-MiMLS
- 2025-10-28 Price Changed $118,000 REALCOMP
- 2025-05-05 Listed $120,000 REALCOMP
- 2025-05-05 Listed $120,000 MiRealSource-MiMLS
- 2020-09-25 Sold (Public Records) $109,000 Public Records
- 2019-05-02 Listing Removed — REALCOMP
- 2018-11-25 Listed $300,000 REALCOMP
- 2018-11-13 Listing Removed — REALCOMP
- 2018-11-13 Listing Removed — MiRealSource-MiMLS
- 2018-09-25 Listed $50,000 MiRealSource-MiMLS
- 2018-09-25 Listed $50,000 REALCOMP
- 2014-12-04 Sold (Public Records) $87,100 Public Records
- 2014-07-10 Sold (Public Records) $85,020 Public Records
- 2013-08-29 Sold (Public Records) $45,000 Public Records
Property tax history
+16.4%/yrLatest (2025): $2,097 · +49.0% YoY. Source: county tax records.
Cash-flow waterfall
monthlySold comps — $/sqft
last 12 mo · ≤1 miLoading sold comps…