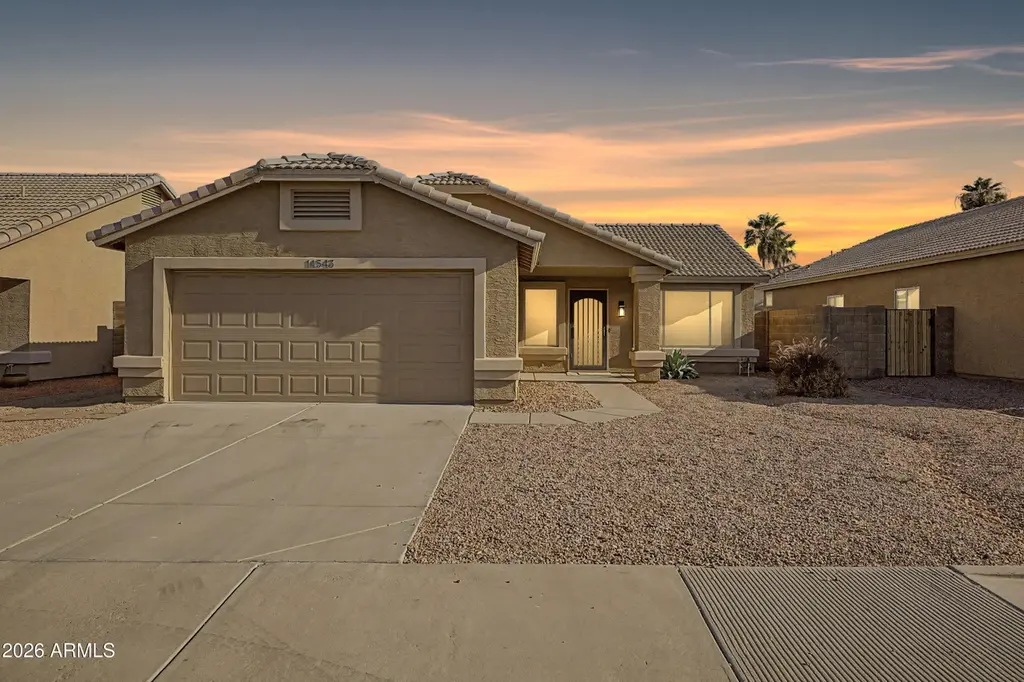
14543 W Marcus Dr · Surprise, AZ
Flood risk 1/10 · Minimal
- FEMA flood zone
- X (shaded)
- Chance of flooding over 30 yrs
- 0.0%
- Est. flood insurance / yr
- $507 – $1,088
Fire risk 4/10 · Minor
- Est. fire insurance / yr
- $610 – $1,132
Heat risk 9/10 · Severe
- Hot days now (above 113°F)
- 7 days/yr
- Hot days in 30 yrs
- 18 days/yr
Wind risk 1/10 · Minimal
- Chance of severe wind over 30 yrs
- —
Air-quality risk 2/10 · Minimal
- Unhealthy air days now
- 1 days/yr
- Unhealthy air days in 30 yrs
- 1 days/yr
Risk factors via First Street. Map © Google.
Why this score? — see what drove the D+ grade
The composite is a weighted blend of 9 inputs, each scored 0–100. Each bar is that input's sub-score; the figure is the points it added to the 100-point composite (weight × sub-score).
- Cash flow +15.1/30.0
- ARV discount +13.9/15.0
- DSCR +4.6/10.0
- Livability +3.7/5.0
- Schools +3.3/10.0
- 1% rule +3.2/10.0
- Rent growth +2.5/5.0
- Condition / age +2.5/5.0
- Appreciation +0.0/10.0
$275,000
🖨 Deal sheet (PDF) 📄 Offer letter ✓ Due diligence
Listing remarks
DISCOVER COMFORT, STYLE, AND VALUE IN THIS MOVE-IN READY HOME PRICED UNDER $300K. Meticulously maintained and thoughtfully updated, this 3-bedroom, 2-bath home offers an ideal blend of functionality and modern finishes in an all-ages community with a low HOA of just $47.36/month. Step inside to find upgraded cabinetry, beautiful granite countertops, stainless steel appliances, and brand-new carpet installed throughout in 2026, creating a fresh and inviting interior ready for its next owner. The spacious primary suite features a walk-in closet, while the open living areas provide comfortable everyday living and easy entertaining. Outside, the backyard showcases low-maintenance desert landsca
Key facts
- Upgraded cabinetry
- Walk in closet
- Move in ready
Tags
Property features AI
Finance
- HOA & community: HOA with $48 monthly fee; HOA fee covers grounds maintenance; Community features include proximity to bus stop and biking/walking path
Exterior
- Parking: 2 garage spaces; 2 covered parking spaces; 2 open parking spaces; Garage with opener
- Utilities: City water; Public sewer
- Home design: Single-family residence; Fee simple ownership
- Construction: Stucco and painted wood-frame construction; Tile/concrete roof
- Exterior features: Desert front and back landscaping; Gravel/stone front and back; Block fencing; City-maintained road access
Interior
- Kitchen: Built-in microwave; Non-laminate countertops; Refrigerator; Dishwasher
- Bedrooms: Up to 3 bedrooms
- Flooring: Carpet; Tile
- Bathrooms: 2 full bathrooms
- Heating & cooling: Electric heating; Central air conditioning; Ceiling fans
- Interior features: High-speed internet available; No interior steps; Vaulted ceilings; Full bath in master bedroom
- Laundry & utility: Laundry inside the home
Neighborhood map
What this means for you Summary
Snapshot
- This is a 3-bed/2.0-bath single-family listed at $275k.
Deal economics
- At list price, monthly cash flow is $88 ($1k/yr) — positive.
- The deal already cash-flows at list — no discount required.
- To meet the 1% rule (rent ≥ 1% of price), the offer needs to be $225k (18.4% below list).
- Recommended offer: $225k (18.4% below list) — sets the bar for 1% rule.
- Cap rate 6.7% vs local median 3.3% in Surprise — top-decile yield for the area; either an underpriced asset or a hidden risk that comps aren't pricing in. Stress-test before assuming the spread holds.
Location & tenants
- Location reads 74/100 on livability (#19 in AZ, #4,616 nationally) — a middle-class / working-renter tenant base. Strengths: crime A+, housing A+, employment A-; Watch: health & safety D+, amenities D-, commute F.
- Dysart Unified District (4243) (suburban): math 34% / reading 40% proficiency, ranked #73 of 249 in AZ (top 29%) — families likely to look elsewhere, expect single-tenant / working-renter base with shorter leases.
- Zoned schools: Kingswood Elementary School (math 29% / reading 33%, grade F, #525 of 1,109 statewide, top 48%, 791 students, 59% FRL); Valley Vista High School (math 25% / reading 32%, grade F, #133 of 381 statewide, top 35%, 2,464 students, 44% FRL).
- Market conditions: Rents flat; 406 active listings in the ZIP; 34 comparable units currently listed for rent nearby; rentals leasing fast (median 13d on market — plan ~1-2 weeks tenant-placement turnaround); solid renter incomes; 36,011 units permitted in Maricopa County in 2024 (12,801 in 5+ unit buildings).
- This rent runs 33% of the median local income ($81k/yr) — at the standard rent-burdened threshold; future hikes will face affordability resistance.
Forward outlook
- Local home prices are declining (-3.0%/yr); year-one equity from $2k of loan paydown is wiped out by about $8k of value loss. Plan a longer hold.
- Maricopa County population projected at +38% by 2050 — long-run rental-demand tailwind backs the buy-and-hold thesis.
Negotiation context
- Only 7 days on market — expect competitive offers; lowballing is unlikely to land.
Risks & watch-outs
- Climate carrying-cost: extreme-heat days projected 7→18/yr by 2055 (HVAC capex compounding) — expect insurance premiums to compound above CPI over the hold.
Questions for the listing agent
- What does the HOA fee cover, when was the last increase, and are there any pending special assessments or reserve-fund shortfalls?
- Is there a deadline driving the sale (1031 exchange, divorce, estate, relocation)? That informs how much negotiation room exists.
- The area grade is low — what's the realistic commute time and amenity access for the typical tenant pool here? Any planned neighborhood developments (good or bad) we should know about?
- What's the average days-on-market for RENTAL listings here right now (not sales)? A rising rental-DOM trend means longer vacancies and softer asking-rent achievability than the comps imply.
- What's the recent tenant-quality profile in this submarket — average credit score on applications, eviction rate, late-payment / NSF rate, and stable-employment percentage? A property-management company in the area should have these aggregated.
- How much new for-sale + rental construction is in the pipeline within 1–3 miles? Heavy new supply typically softens prices + rents 12–24 months out; constrained supply supports both.
Investment metrics
- 1% rule
- 0.82% ✗
- Cap rate
- 6.68%
- Cash-on-cash
- 1.38%
- DSCR
- 1.06
- GRM
- 10.2
CMA / ARV
- ARV (on-the-fly)
- $320,320
- Comps found
- 12
Show comp detail 12 sales within ~0.75 mi
| Address | Dist | Beds/Ba | Sqft | Sold | Price | $/sf | Match |
|---|---|---|---|---|---|---|---|
| 14543 W Marcus Dr | 0.00mi | 3/2.0 | 1,120 (0%) | 0mo | $310,000 | $277 | 100 |
| 17176 N Winding Trl | 0.40mi | 2/2.0 (-1) | 1,097 (-2%) | 2mo | $285,000 | $260 | 71 |
| 14719 W Ely Dr | 0.36mi | 3/2.0 | 1,201 (+7%) | 1mo | $355,000 | $296 | 70 |
| 17233 N Winding Trl | 0.36mi | 2/2.0 (-1) | 1,081 (-4%) | 4mo | $280,000 | $259 | 69 |
| 14566 W Zuni Trl | 0.28mi | 2/2.0 (-1) | 1,231 (+10%) | 2mo | $297,000 | $241 | 64 |
| 14822 W Lamoille Dr | 0.40mi | 3/2.0 | 1,201 (+7%) | 8mo | $350,000 | $291 | 62 |
| 18131 N Skyhawk Dr | 0.42mi | 3/2.0 | 1,201 (+7%) | 7mo | $350,300 | $292 | 62 |
| 14751 W Willow Ln | 0.51mi | 3/2.0 | 1,201 (+7%) | 3mo | $330,000 | $275 | 61 |
| 17115 N Princess Pl | 0.57mi | 3/2.0 | 1,201 (+7%) | 3mo | $380,000 | $316 | 59 |
| 14235 W Shawnee Trl | 0.43mi | 3/2.0 | 1,287 (+15%) | 4mo | $367,750 | $286 | 52 |
| 14306 W Kiowa Trl | 0.37mi | 2/2.0 (-1) | 1,287 (+15%) | 3mo | $387,500 | $301 | 51 |
| 18717 N Red Mountain Way | 0.74mi | 2/2.0 (-1) | 1,184 (+6%) | 5mo | $245,000 | $207 | 47 |
Match score weights: distance 35% · size 25% · config 20% · recency 20%. Top-matched comps best support the ARV.
Projected returns pro-forma
-3.0% appreciation · 0.14% rent growth · sell at horizon
- IRR
- -17.1%
- Equity multiple
- 0.41×
- Total profit
- $-45,314
- Equity at exit
- $41,003
- IRR
- -14.6%
- Equity multiple
- 0.26×
- Total profit
- $-56,953
- Equity at exit
- $23,777
Cash invested: $77,000 (down + closing). Projections, not guarantees.
Landlord ↔ Tenant lean methodology
- Overall (STATE)
- 87 Strongly Landlord-Friendly
- State Arizona
- 87 Strongly Landlord-Friendly · R+3
- County
- — inherits STATE
- City
- — inherits STATE
ZIP-level market 85374
- Home prices YoY
- -18.3%
- Rents YoY
- 0.1%
- Active inventory
- 406
- Price-to-rent
- 10.2×
Monthly cashflow live
- Estimated rent
- $2,245 high interval (Pro) →
- Mortgage (P&I)
- −$1,442
- Tax from tax record
- −$81 /mo · $967/yr
- Insurance
- −$115
- HOA
- −$48
- Vacancy / Maint / Mgmt
- −$471
- Net cashflow
- $88
Break-even live
Sensitivity live
| Price | -10% $244 | -5% $166 | +0% $88 | +5% $11 | +10% $-67 |
|---|---|---|---|---|---|
| Rent | -10% $-89 | -5% $0 | +0% $88 | +5% $177 | +10% $266 |
| Rate | -1.0pp $227 | -0.5pp $158 | base $88 | +0.5pp $17 | +1.0pp $-55 |
UW: 25.0% down · 7.5% · 30yr · 1.5% tax · 5.0% vac · 8.0% maint · 8.0% mgmt
Financing live
Cash to close
- Down payment
- $68,750
- Closing costs
- $8,250
- Reserves months
- —
- Total cash needed
- —
Loan-product check · same deal, 3 products live
Conventional
25% down · 7.5% · 30yr
- Down + closing
- —
- Monthly P&I
- —
- Monthly cashflow
- —
- DSCR
- —
- Eligible?
- —
Personal DTI + credit; lowest rate.
DSCR
20% down · 8.5% · 30yr
- Down + closing
- —
- Monthly P&I
- —
- Monthly cashflow
- —
- DSCR
- —
- Eligible?
- —
No personal income docs; deal must DSCR.
Hard money
10% down · 12.0% · 12mo
- Down + closing
- —
- Monthly P&I
- —
- Monthly cashflow
- —
- DSCR
- —
- Eligible?
- —
Short-term bridge; refi at stabilization.
Rent comps 34 comps
| Address | Beds | Baths | Sqft | Rent | $/sqft | DOM | Units | Dist |
|---|---|---|---|---|---|---|---|---|
| 17927 N Parkview Pl Surprise, AZ | 1.0–4.0 | 1.0–2.0 | 986 | $1,813 | $1.84 | 0d | 8 | 0.14mi |
| 14155 W Mountain View Blvd Surprise, AZ | 1.0–2.0 | 1.0–2.0 | 855 | $1,690 | $1.98 | 0d | 12 | 0.37mi |
| 14817 W Juneberry Way Surprise, AZ | 2.0 | 2.0 | 1108 | $1,800 | $1.62 | 26d | 1 | 0.38mi |
| 18139 N Skyhawk Dr Surprise, AZ | 3.0 | 2.0 | 1201 | $1,835 | $1.53 | 45d | 1 | 0.41mi |
| 14575 W Mountain View Blvd Surprise, AZ | 1.0–3.0 | 1.0–2.0 | 1345 | $3,750 | $2.79 | 6d | 8 | 0.42mi |
| 14575 W Mountain View Blvd Surprise, AZ | 1.0–2.0 | 1.0–2.0 | 1195 | $3,750 | $3.14 | 0d | 6 | 0.42mi |
| 14575 W Mountain View Blvd Surprise, AZ | 1.0–3.0 | 1.0–2.0 | 1345 | $3,750 | $2.79 | 13d | 9 | 0.42mi |
| 17229 N Zuni Trl Surprise, AZ | 2.0 | 2.0 | 1408 | $2,400 | $1.70 | 0d | 1 | 0.43mi |
| 17923 N Reno Ave Surprise, AZ | 3.0 | 2.0 | 1283 | $1,695 | $1.32 | 3d | 1 | 0.52mi |
| 14300 W Bell Rd Surprise, AZ | 2.0 | 2.0 | 946 | $1,948 | $2.06 | 14d | 2 | 0.55mi |
| 15032 W Jackpot Way Surprise, AZ | 2.0 | 2.0 | 923 | $1,600 | $1.73 | 26d | 1 | 0.59mi |
| 18614 N Summerbreeze Way Surprise, AZ | 2.0 | 2.0 | 1300 | $2,500 | $1.92 | 20d | 1 | 0.63mi |
| 16945 N Stadium Way Surprise, AZ | 3.0 | 1.0–2.0 | 990 | $1,966 | $1.99 | 0d | 22 | 0.64mi |
| 14300 W Bell Rd Unit NA Surprise, AZ | 2.0 | 2.0 | 938 | $1,900 | $2.03 | 45d | 1 | 0.64mi |
| 16830 N 141st Ave Surprise, AZ | 2.0–3.0 | 2.5 | 1273 | $2,099 | $1.65 | 0d | 13 | 0.83mi |
| 16601 N Parkview Pl Surprise, AZ | 3.0 | 2.5 | 1425 | $2,199 | $1.54 | 5d | 1 | 0.85mi |
| 16601 N Parkview Pl #120 Surprise, AZ | 3.0 | 2.5 | 1420 | $2,225 | $1.57 | 7d | 1 | 0.85mi |
| 16830 N 141st Ave Unit B2 Surprise, AZ | 2.0 | 2.5 | 1238 | $1,849 | $1.49 | 45d | 1 | 0.85mi |
| 16830 N 141st Ave Unit B1 Surprise, AZ | 2.0 | 2.5 | 1200 | $1,799 | $1.50 | 45d | 1 | 0.85mi |
| 16830 N 141st Ave Unit 3A Surprise, AZ | 3.0 | 2.5 | 1347 | $2,099 | $1.56 | 21d | 1 | 0.85mi |
| 16485 N Stadium Way Surprise, AZ | 1.0–3.0 | 1.0–2.0 | 1010 | $2,024 | $2.00 | 0d | 44 | 0.91mi |
| 15306 W Eureka Trl Surprise, AZ | 3.0 | 2.0 | 1289 | $1,999 | $1.55 | 45d | 1 | 0.92mi |
| 17838 N Navarro Ct Surprise, AZ | 2.0 | 2.0 | 1143 | $2,800 | $2.45 | 45d | 1 | 0.96mi |
| 15042 W Cactus Ridge Way Surprise, AZ | 2.0 | 2.0 | 1414 | $2,800 | $1.98 | 45d | 1 | 0.96mi |
| 16431 N Parkview Pl Surprise, AZ | 1.0–2.0 | 1.0–2.0 | 1004 | $3,285 | $3.27 | 0d | 129 | 1.00mi |
| 15033 W Home Run Dr Unit 1545708P Surprise, AZ | 3.0 | 2.0 | 1399 | $2,419 | $1.73 | 16d | 1 | 1.16mi |
| 16671 N Litchfield Rd Surprise, AZ | 1.0–3.0 | 1.0–2.0 | 977 | $1,949 | $1.99 | 0d | 20 | 1.17mi |
| 13635 W Utica Dr Sun City West, AZ | 2.0 | 1.5 | 1084 | $2,750 | $2.54 | 45d | 1 | 1.22mi |
| 16682 N West Point Pkwy Surprise, AZ | 1.0–3.0 | 1.0–2.0 | 975 | $1,814 | $1.86 | 3d | 14 | 1.25mi |
| 13766 W Elm St Surprise, AZ | 3.0 | 2.0 | 1297 | $1,835 | $1.41 | 45d | 1 | 1.27mi |
| 16230 N Litchfield Rd Surprise, AZ | 3.0 | 1.0–3.0 | 1081 | $2,362 | $2.19 | 0d | 45 | 1.30mi |
| 16630 N Reems Rd Surprise, AZ | 1.0–3.0 | 1.0–2.0 | 989 | $2,050 | $2.07 | 0d | 11 | 1.44mi |
| 15510 N La Cometa Surprise, AZ | 1.0–2.0 | 1.0–2.0 | 1057 | $2,849 | $2.70 | 0d | 18 | 1.47mi |
| 15724 W Smokey Dr Surprise, AZ | 3.0 | 2.0 | 1220 | $1,800 | $1.48 | 26d | 1 | 1.49mi |
HOA detail
- Monthly dues
- $48 · $576/yr
Listing history 1 events
-
2026-05-21$275,000 Active
ⓘ Source: listings_history table (triggers on properties + properties_extension) + one-shot
backfill from property_details.listing_events for pre-trigger history.
Tax reassessment forecast AZ · Resets to sale price
- Current annual tax
- $967 · $81/mo
- Projected year-2 tax
- $1,815 · $151/mo
- Expected delta
- +$848/yr (+$71/mo · 87.8%)
ⓘ Screening estimate from a state-policy table — verify with the county assessor before closing.
Climate risk First Street
- Flood 1/10 Low FEMA zone X (shaded) · 0% chance over 30 yrs
- Wildfire 4/10 Moderate
- Heat 9/10 Extreme 7 d/yr ≥113°F today · 18 d/yr by 30 yrs out
- Wind 1/10 Low
- Air quality 2/10 Low 1 unhealthy d/yr today · 1 by 30 yrs out
Nearby sold comps map
Loading sold comps map…
Walkable amenities ~0.75 mi
Loading nearby amenities…
Taxation est. · year 1
- Rental income
- $26,941
- − Mortgage interest
- −$15,404
- − Property taxes
- −$967
- − Insurance
- −$1,375
- − Repairs & maintenance
- −$2,155
- − Management
- −$2,155
- − HOA
- −$576
- − Depreciation
- −$8,000
- Taxable loss
- −$3,691
- Est. tax savings @ 24.0%
- +$886
- After-tax cash flow
- $1,946/yr
For passive investors: Depreciation is non-cash, so a rental often shows a tax loss while cash-flowing — sheltering income. Rental losses are passive: they offset passive income freely, and up to $25,000/yr can offset ordinary (W-2) income if you actively participate and your MAGI is under $100k (phasing out to $0 by $150k); unused losses carry forward. On sale, claimed depreciation is recaptured at up to 25%, and gains may owe capital-gains tax (a 1031 exchange can defer both). Figures are a year-1 estimate at your 24.0% rate — not tax advice; consult a CPA.
Schools (NCES district)
- District
- Dysart Unified District (4243)
- NCES district ID
- 0402690
- Math proficiency
- 34% ▼ -10.00%
- Reading proficiency
- 40% ▼ -5.00%
- Median HH income
- $58,033
- Composite
- 32.76/100
- National rank
- #5634
- State rank
- #73 of 249 in AZ
Livability — Surprise
- Score
- 74/100
- State rank
- #19
- US rank
- #4616
Category grades
Schools grade is shown separately in the Schools card above.
Census & demographics
- Census place
- Surprise, AZ
- County
- Maricopa County · 4,537,380 people
- City population
- 160,031
- Metro
- Phoenix-Mesa-Chandler, AZ
- Population (ZIP)
- 41,420
- Household income
- $81,201
- Rent vs Own
- Severe rent burden
- 1120.0
Population outlook (Maricopa County) Hauer SSP2
- Today (2025)
- 4,979,203 people
- By 2030
- 5,378,229 · +8.0%
- By 2040
- 6,156,598 · +23.6%
- By 2050
- 6,872,376 · +38.0%
- By 2075
- 8,401,270 · +68.7%
- By 2100
- 9,247,439 · +85.7%
Race, ethnicity, and origin ACS 2023
- Neighborhood character
- Predominantly White (78%)
- Race & ethnicity
- White 78% Hispanic / Latino 12% Two or more races 8% Black 4% Asian 2%
- Hispanic origin (detail)
- Mexican 10%
- Common ancestry
- Romanian 4% Portuguese 3% Lithuanian 3%
- Foreign-born
- 8% · Canada
- Languages at home
- 91% English-only · Spanish 5% Other Indo-European 1% Russian/Polish/Slavic 0%
Political lean MEDSL · Maricopa
- 2024 margin
- Toss-up / Even · D 47.7% · R 51.2% · Other 1.1%
- 2008→2024 swing
- +7.1pp toward D · 2008: -10.6pp · 2024: -3.5pp
- All cycles
- 2024: R+3.5 2020: D+2.2 2016: R+3.5 2012: R+12.0 2008: R+10.6
Not yet ingested
- Civics
- —
Market trends
- HPI YoY
- ▼ -56.93%
- Current HPI
- 254.7782
- Rent YoY
- ▲ 0.14%
- Metro
- Phoenix-Mesa-Chandler, AZ
- State GDP YoY
- ▲ 4.54%
- F500 in state
- 20
Industry mix (Fortune 500 HQ in AZ)
| Industry | F500 HQs | Revenue |
|---|---|---|
| Technology | 2 | $13B |
|
||
| Mining / Metals | 1 | $23B |
|
||
| Environmental Services | 1 | $16B |
|
||
| Metals / Steel | 1 | $14B |
|
||
| Technology Distribution | 1 | $9B |
|
||
| Homebuilding | 1 | $8B |
|
||
Price history
+12.7% since first listed3 events — show timeline
- 2026-06-17 Sold (MLS) $310,000 ARMLS
- 2026-05-29 Pending — ARMLS
- 2026-05-21 Listed $275,000 ARMLS
Property tax history
-0.1%/yrLatest (2025): $967 · +6.8% YoY. Source: county tax records.
Cash-flow waterfall
monthlySold comps — $/sqft
last 12 mo · ≤1 miLoading sold comps…