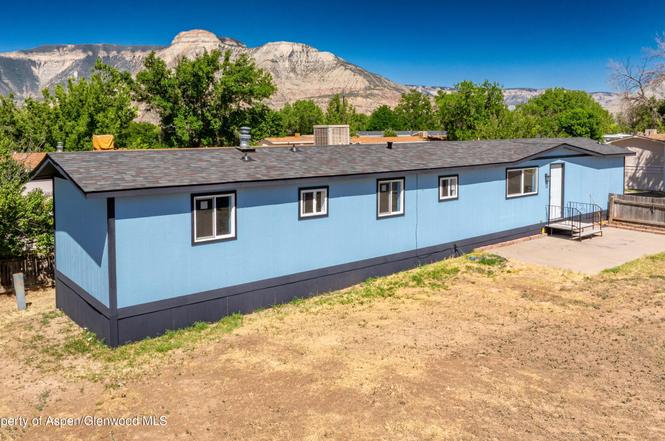
22 E Silverbell Pl · Battlement Mesa, CO
Flood risk 1/10 · Minimal
- FEMA flood zone
- X
- Chance of flooding over 30 yrs
- 0.0%
- Est. flood insurance / yr
- $507 – $1,088
Fire risk 7/10 · Major
- Est. fire insurance / yr
- $939 – $1,743
Heat risk 4/10 · Minor
- Hot days now (above 88°F)
- 8 days/yr
- Hot days in 30 yrs
- 22 days/yr
Wind risk 1/10 · Minimal
- Chance of severe wind over 30 yrs
- —
Air-quality risk 2/10 · Minimal
- Unhealthy air days now
- 2 days/yr
- Unhealthy air days in 30 yrs
- 2 days/yr
Risk factors via First Street. Map © Google.
Why this score? — see what drove the C grade
The composite is a weighted blend of 9 inputs, each scored 0–100. Each bar is that input's sub-score; the figure is the points it added to the 100-point composite (weight × sub-score).
- Cash flow +22.4/30.0
- Appreciation +10.0/10.0
- DSCR +7.2/10.0
- 1% rule +5.9/10.0
- Livability +3.0/5.0
- Rent growth +2.5/5.0
- Condition / age +2.5/5.0
- Schools +1.9/10.0
- ARV discount +0.5/15.0
$119,000
🖨 Deal sheet 📄 Offer letter ✓ Due diligence
Listing remarks
Move-in ready and beautifully remodeled! This home features all-new windows, a new roof, new flooring, new bathrooms, new interior and exterior doors, and a completely remodeled kitchen. The furnace and boiler were replaced in 2022, along with a new swamp cooler for additional comfort. Enjoy the privacy of a fully fenced yard, perfect for relaxing, entertaining, or pets. Don't miss this opportunity - See for yourself and inspect the quality craftsmanship and pride of ownership that make this home truly better than new. Schedule your showing today before it's gone!
Key facts
- New exterior doors
- New flooring
- New interior doors
Tags
Property features AI
Finance
- Other: Directions: Exit I-70 Exit #75 Parachute, to Battlement Mesa. South on North Battlement Parkway. Right at the waterfall onto Stone Quarry Road. Right onto Blackhawk Trail. Right onto East Silverbell Place. Home is on the right.; Listing status: Active; Listing broker: The Property Shop; Listing agent: Irma Starbuck
- HOA & community: Located in the Saddleback Village subdivision
Exterior
- Home design: Single family residence; HUD model
- Exterior features: Faces east; Not new construction
Interior
- Kitchen: Refrigerator; Range
- Bathrooms: 2 full bathrooms
- Heating & cooling: Forced Air heating; Has heating; Has cooling
- Interior features: Unfurnished; Excellent condition
Neighborhood map
What this means for you Summary
Snapshot
- This is a 3-bed/2.0-bath manufactured listed at $119k.
Deal economics
- At list price, monthly cash flow is $199 ($2k/yr) — positive.
- The deal already cash-flows at list — no discount required.
- Meets the 1% rule at list price ($1k rent vs $119k).
- Cap rate 8.3% vs local median 1.8% in Battlement Mesa — top-decile yield for the area; either an underpriced asset or a hidden risk that comps aren't pricing in. Stress-test before assuming the spread holds.
Location & tenants
- Location reads 59/100 on livability (#287 in CO) — a working-class tenant base; expect higher turnover. Strengths: housing A+, cost of living B+, employment B; Watch: crime C-, schools F, amenities F.
- Grand Valley School District No. 16 In The County Of Garfi (town): math 18% / reading 23% proficiency, ranked #72 of 86 in CO (top 84%) — low school quality limits family demand, transient renter base, plan for 1-2y turnover.
- Market conditions: 121 active listings in the ZIP; 171 units permitted in Garfield County in 2024 (64 in 5+ unit buildings).
Forward outlook
- In year one you build about $13k of equity ($823 loan paydown + $12k appreciation (10.0% local appreciation)).
- Garfield County population projected at +5% by 2050 — modest demand growth; plan on rents tracking national, not racing it.
- At projected returns (10.0% appreciation + 3.0% rent growth), your $33k cash investment doubles in ~3 years — after that, you're playing with house money.
- By year 3, paydown + projected appreciation supports a ~$32k cash-out refi (75% LTV) — recoverable capital for the next deal without selling this one.
Negotiation context
- Only 1 days on market — expect competitive offers; lowballing is unlikely to land.
Risks & watch-outs
- Climate carrying-cost: major wildfire risk — expect insurance premiums to compound above CPI over the hold.
Questions for the listing agent
- Is there a deadline driving the sale (1031 exchange, divorce, estate, relocation)? That informs how much negotiation room exists.
- Schools are F-rated, which usually means shorter tenancies and higher turnover. Who's the typical renter profile here, and what's been the actual vacancy rate?
- What's the average days-on-market for RENTAL listings here right now (not sales)? A rising rental-DOM trend means longer vacancies and softer asking-rent achievability than the comps imply.
- What's the recent tenant-quality profile in this submarket — average credit score on applications, eviction rate, late-payment / NSF rate, and stable-employment percentage? A property-management company in the area should have these aggregated.
- How much new for-sale + rental construction is in the pipeline within 1–3 miles? Heavy new supply typically softens prices + rents 12–24 months out; constrained supply supports both.
Investment metrics
- 1% rule
- 1.09% ✓
- Cap rate
- 8.30%
- Cash-on-cash
- 7.15%
- DSCR
- 1.32
- GRM
- 7.7
CMA / ARV
- ARV (on-the-fly)
- $102,900
- Comps found
- 12
Show comp detail 12 sales within ~0.75 mi
| Address | Dist | Beds/Ba | Sqft | Sold | Price | $/sf | Match |
|---|---|---|---|---|---|---|---|
| 234 Tamarisk Trl | 0.21mi | 3/2.0 | 980 (0%) | 4mo | $98,600 | $101 | 87 |
| 11 E Carson Cir | 0.07mi | 2/2.0 (-1) | 980 (0%) | 8mo | $64,000 | $65 | 85 |
| 57 Little Echo Dr | 0.23mi | 3/2.0 | 980 (0%) | 8mo | $45,000 | $46 | 83 |
| 181 Silver Queen Cir | 0.45mi | 3/2.0 | 924 (-6%) | 2mo | $80,000 | $87 | 68 |
| 88 W Carson Cir | 0.12mi | 3/2.0 | 1,120 (+14%) | 6mo | $120,000 | $107 | 65 |
| 28 Iron Wedge Cir | 0.16mi | 3/2.0 | 1,120 (+14%) | 5mo | $119,000 | $106 | 65 |
| 116 Iron Wedge Cir | 0.23mi | 3/2.0 | 1,120 (+14%) | 6mo | $118,000 | $105 | 61 |
| 103 Bent Creek Cir | 0.73mi | 3/1.5 | 1,013 (+3%) | 8mo | $109,072 | $108 | 52 |
| 58 Logans Ln | 0.56mi | 3/2.0 | 1,110 (+13%) | 2mo | $93,000 | $84 | 50 |
| 104 Mahogany Cir | 0.55mi | 3/2.0 | 1,125 (+15%) | 2mo | $105,000 | $93 | 48 |
| 32 Bent Creek Cir | 0.66mi | 3/2.0 | 1,108 (+13%) | 2mo | $127,500 | $115 | 46 |
| 244 Bent Creek Cir | 0.67mi | 3/2.0 | 1,120 (+14%) | 1mo | $125,000 | $112 | 44 |
Match score weights: distance 35% · size 25% · config 20% · recency 20%. Top-matched comps best support the ARV.
Projected returns pro-forma
10.0% appreciation · 3.0% rent growth · sell at horizon
- IRR
- 29.5%
- Equity multiple
- 3.33×
- Total profit
- $77,478
- Equity at exit
- $107,205
- IRR
- 25.6%
- Equity multiple
- 7.55×
- Total profit
- $218,252
- Equity at exit
- $231,191
Cash invested: $33,320 (down + closing). Projections, not guarantees.
Landlord ↔ Tenant lean methodology
- Overall (STATE)
- 38 Tenant-Leaning
- State Colorado
- 38 Tenant-Leaning · D+4
- County
- — inherits STATE
- City
- — inherits STATE
ZIP-level market 81635
- Home prices YoY
- 3.1%
- Active inventory
- 121
- Price-to-rent
- 7.7×
Monthly cashflow live
- Estimated rent
- $1,292 medium interval (Pro) →
- Mortgage (P&I)
- −$624
- Tax est. 1.5%
- −$149 /mo · $1,785/yr
- Insurance
- −$50
- HOA
- −$0
- Vacancy / Maint / Mgmt
- −$271
- Net cashflow
- $199
Break-even live
UW: 25.0% down · 7.5% · 30yr · 1.5% tax · 5.0% vac · 8.0% maint · 8.0% mgmt
Financing live
Cash to close
- Down payment
- $29,750
- Closing costs
- $3,570
- Reserves months
- —
- Total cash needed
- —
Loan-product check · same deal, 3 products live
Conventional
25% down · 7.5% · 30yr
- Down + closing
- —
- Monthly P&I
- —
- Monthly cashflow
- —
- DSCR
- —
- Eligible?
- —
Personal DTI + credit; lowest rate.
DSCR
20% down · 8.5% · 30yr
- Down + closing
- —
- Monthly P&I
- —
- Monthly cashflow
- —
- DSCR
- —
- Eligible?
- —
No personal income docs; deal must DSCR.
Hard money
10% down · 12.0% · 12mo
- Down + closing
- —
- Monthly P&I
- —
- Monthly cashflow
- —
- DSCR
- —
- Eligible?
- —
Short-term bridge; refi at stabilization.
Listing history 2 events
-
2026-06-18remarks 570-char remark
-
2026-06-18$119,000 Active 1 DOM
ⓘ Source: listings_history table (triggers on properties + properties_extension) + one-shot
backfill from property_details.listing_events for pre-trigger history.
Climate risk First Street
- Flood 1/10 Low FEMA zone X · 0% chance over 30 yrs
- Wildfire 7/10 Severe
- Heat 4/10 Moderate 8 d/yr ≥88°F today · 22 d/yr by 30 yrs out
- Wind 1/10 Low
- Air quality 2/10 Low 2 unhealthy d/yr today · 2 by 30 yrs out
Nearby sold comps map
Loading sold comps map…
Walkable amenities ~0.75 mi
Loading nearby amenities…
Taxation est. · year 1
- Rental income
- $15,508
- − Mortgage interest
- −$6,666
- − Property taxes
- −$1,785
- − Insurance
- −$595
- − Repairs & maintenance
- −$1,241
- − Management
- −$1,241
- − Depreciation
- −$3,462
- Taxable income
- $519
- Est. tax owed @ 24.0%
- −$125
- After-tax cash flow
- $2,258/yr
For passive investors: Depreciation is non-cash, so a rental often shows a tax loss while cash-flowing — sheltering income. Rental losses are passive: they offset passive income freely, and up to $25,000/yr can offset ordinary (W-2) income if you actively participate and your MAGI is under $100k (phasing out to $0 by $150k); unused losses carry forward. On sale, claimed depreciation is recaptured at up to 25%, and gains may owe capital-gains tax (a 1031 exchange can defer both). Figures are a year-1 estimate at your 24.0% rate — not tax advice; consult a CPA.
Schools (NCES district)
- District
- Grand Valley School District No. 16 In The County Of Garfi
- NCES district ID
- 0804380
- Math proficiency
- 18% ▲ 3.00%
- Reading proficiency
- 23% ▼ -2.00%
- Median HH income
- $59,301
- Composite
- 19.2/100
- National rank
- #8815
- State rank
- #72 of 86 in CO
Livability — Battlement Mesa
- Score
- 59/100
- State rank
- #287
- US rank
- #20600
Category grades
Schools grade is shown separately in the Schools card above.
Census & demographics
- Census place
- Battlement Mesa, CO
- Population (ZIP)
- 7,155
Population outlook (Garfield County) Hauer SSP2
- Today (2025)
- 61,756 people
- By 2030
- 63,255 · +2.4%
- By 2040
- 64,952 · +5.2%
- By 2050
- 64,937 · +5.2%
- By 2075
- 62,413 · +1.1%
- By 2100
- 55,730 · -9.8%
Race, ethnicity, and origin ACS 2023
- Neighborhood character
- Predominantly White (70%)
- Race & ethnicity
- White 70% Hispanic / Latino 24% Two or more races 6% Asian 1%
- Hispanic origin (detail)
- Mexican 21%
- Common ancestry
- Lithuanian 2% Portuguese 2% Serbian 1%
- Foreign-born
- 9% · Canada
- Languages at home
- 81% English-only · Spanish 19%
Political lean MEDSL · Garfield
- 2024 margin
- Toss-up / Even · D 49.8% · R 47.7% · Other 2.5%
- 2008→2024 swing
- +2.1pp toward D · 2008: -0.0pp · 2024: 2.1pp
- All cycles
- 2024: D+2.1 2020: D+2.3 2016: R+7.1 2012: R+4.9 2008: R+0.0
Not yet ingested
- Civics
- —
Market trends
- HPI YoY
- ▲ 12.90%
- Current HPI
- 434.5219
- Rent YoY
- —
- Metro
- —
- State GDP YoY
- ▲ 1.95%
- F500 in state
- 14
Industry mix (Fortune 500 HQ in CO)
| Industry | F500 HQs | Revenue |
|---|---|---|
| Technology Distribution | 1 | $31B |
|
||
| Food / Agriculture | 1 | $18B |
|
||
| Packaging | 1 | $14B |
|
||
| Healthcare | 1 | $13B |
|
||
| Energy | 1 | $10B |
|
||
| Technology | 1 | $4B |
|
||
Price history
1 event — show timeline
- 2026-06-16 Listed $119,000 AGMLS
Property tax history
+21.0%/yrLatest (2025): $204 · +626.8% YoY. Source: county tax records.
Cash-flow waterfall
monthlySold comps — $/sqft
last 12 mo · ≤1 miLoading sold comps…