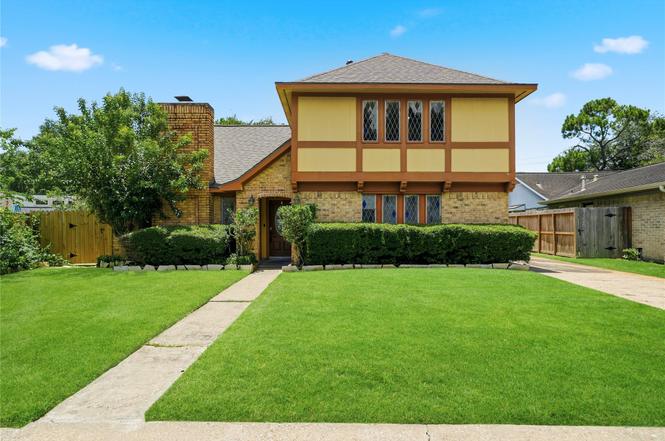
12358 Gainsborough Dr · Houston, TX
Flood risk 4/10 · Minor
- FEMA flood zone
- X (unshaded)
- Chance of flooding over 30 yrs
- 0.22%
- Est. flood insurance / yr
- $507 – $1,088
Fire risk 1/10 · Minimal
- Est. fire insurance / yr
- $1,222 – $2,270
Heat risk 9/10 · Severe
- Hot days now (above 110°F)
- 7 days/yr
- Hot days in 30 yrs
- 20 days/yr
Wind risk 9/10 · Severe
- Chance of severe wind over 30 yrs
- 99.0%
Air-quality risk 2/10 · Minimal
- Unhealthy air days now
- 2 days/yr
- Unhealthy air days in 30 yrs
- 2 days/yr
Risk factors via First Street. Map © Google.
Why this score? — see what drove the C- grade
The composite is a weighted blend of 9 inputs, each scored 0–100. Each bar is that input's sub-score; the figure is the points it added to the 100-point composite (weight × sub-score).
- Cash flow +17.4/30.0
- ARV discount +7.6/15.0
- 1% rule +5.8/10.0
- DSCR +5.4/10.0
- Appreciation +5.2/10.0
- Livability +3.7/5.0
- Schools +2.7/10.0
- Rent growth +2.5/5.0
- Condition / age +2.5/5.0
$280,000
🖨 Deal sheet 📄 Offer letter ✓ Due diligence
Key facts
- 0.32 acre lot
- 2 garage spots
- Built 1974
Property features AI
Finance
- HOA & community: Association: Goodwin & Co; Association fee $600 annually
Exterior
- Parking: Detached garage; Driveway; 2 garage spaces
- Security: Smoke detector(s)
- Utilities: Public water; Public sewer
- Home design: Residential property; One primary bedroom on the first floor (entry level); Garage apartment
- Construction: Brick construction; Composition roof; Built in 1974; Slab foundation
- Exterior features: Covered patio; Patio; Deck; Fully fenced yard; Paved driveway; Subdivision setting; Side yard
Interior
- Kitchen: Dishwasher; Gas cooktop; Gas oven; Microwave; Refrigerator; Disposal
- Bedrooms: Primary bedroom on the first floor; Primary bathroom on the first floor; Second-floor bedrooms (two 15x12, one 11x10)
- Flooring: Carpet; Tile
- Bathrooms: 2 full bathrooms; 1 half bathroom
- Heating & cooling: Central heating (electric); Central air (electric)
- Interior features: High ceilings; Pantry; Pots & Pan drawers; Self-closing cabinet doors and drawers; Tub/shower combo; Gas fireplace
- Laundry & utility: Washer hookup; Electric dryer hookup; Gas dryer hookup
Neighborhood map
What this means for you Summary
Snapshot
- This is a 4-bed/2.5-bath single-family listed at $280k.
Deal economics
- At list price, monthly cash flow is $212 ($3k/yr) — positive.
- The deal already cash-flows at list — no discount required.
- Meets the 1% rule at list price ($3k rent vs $280k).
- Cap rate 7.2% vs local median 3.2% in Houston — top-decile yield for the area; either an underpriced asset or a hidden risk that comps aren't pricing in. Stress-test before assuming the spread holds.
Location & tenants
- Location reads 74/100 on livability (#184 in TX, #4,771 nationally) — a middle-class / working-renter tenant base. Strengths: amenities A+, cost of living A+, housing A+; Watch: crime F.
- Houston ISD (urban): math 27% / reading 35% proficiency, ranked #593 of 826 in TX (top 72%) — families likely to look elsewhere, expect single-tenant / working-renter base with shorter leases; 71% free/reduced lunch — lower-income household profile, screen leases tightly.
- Zoned schools: Welch Middle (math 11% / reading 21%, grade F, #1,543 of 1,662 statewide, top 94%, 645 students, 97% FRL); Westbury H S (math 19% / reading 31%, grade F, #1,250 of 1,632 statewide, top 77%, 2,243 students, 92% FRL) — zoned schools average 94% FRL vs 71% district-wide (23 pts higher); higher-poverty schools than district average — tighter screening recommended.
- Market conditions: 62 active listings in the ZIP; 3 comparable units currently listed for rent nearby; rentals leasing fast (median 12d on market — plan ~1-2 weeks tenant-placement turnaround); 29,883 units permitted in Harris County in 2024 (8,621 in 5+ unit buildings).
Forward outlook
- In year one you build about $3k of equity ($2k loan paydown + $1k appreciation (0.4% local appreciation)).
- Harris County population projected at +47% by 2050 — long-run rental-demand tailwind backs the buy-and-hold thesis.
- At projected returns (0.4% appreciation + 3.0% rent growth), your $78k cash investment doubles in ~9 years — after that, you're playing with house money.
- By year 9, paydown + projected appreciation supports a ~$31k cash-out refi (75% LTV) — recoverable capital for the next deal without selling this one.
Negotiation context
- Only 3 days on market — expect competitive offers; lowballing is unlikely to land.
- Current owner paid $68k; list at $280k implies a 309% gain — meaningful room to come down on a strong offer.
Risks & watch-outs
- Climate carrying-cost: severe wind risk, 99% chance of damaging wind over 30y; extreme-heat days projected 7→20/yr by 2055 (HVAC capex compounding) — expect insurance premiums to compound above CPI over the hold.
Questions for the listing agent
- Built in 1974 — when were the roof, HVAC, electrical panel, plumbing, and water heater last replaced?
- What does the HOA fee cover, when was the last increase, and are there any pending special assessments or reserve-fund shortfalls?
- Is there a deadline driving the sale (1031 exchange, divorce, estate, relocation)? That informs how much negotiation room exists.
- Schools are D-rated, which usually means shorter tenancies and higher turnover. Who's the typical renter profile here, and what's been the actual vacancy rate?
- Crime grade is F in this area — have there been break-ins, vandalism, or insurance claims at this property in the last 3 years? What carrier currently insures it and at what premium?
- What's the average days-on-market for RENTAL listings here right now (not sales)? A rising rental-DOM trend means longer vacancies and softer asking-rent achievability than the comps imply.
- What's the recent tenant-quality profile in this submarket — average credit score on applications, eviction rate, late-payment / NSF rate, and stable-employment percentage? A property-management company in the area should have these aggregated.
- How much new for-sale + rental construction is in the pipeline within 1–3 miles? Heavy new supply typically softens prices + rents 12–24 months out; constrained supply supports both.
Investment metrics
- 1% rule
- 1.08% ✓
- Cap rate
- 7.20%
- Cash-on-cash
- 3.24%
- DSCR
- 1.14
- GRM
- 7.8
CMA / ARV
- ARV (on-the-fly)
- $280,502
- Comps found
- 12
Show comp detail 12 sales within ~0.75 mi
| Address | Dist | Beds/Ba | Sqft | Sold | Price | $/sf | Match |
|---|---|---|---|---|---|---|---|
| 12011 Chessington Dr | 0.51mi | 4/2.5 | 2,020 (+0%) | 2mo | $280,000 | $139 | 74 |
| 12327 Welland Dr | 0.47mi | 4/2.0 | 2,011 (-0%) | 6mo | $245,000 | $122 | 71 |
| 12531 Lancelot Dr | 0.62mi | 4/2.5 | 2,024 (+0%) | 1mo | $291,000 | $144 | 70 |
| 9710 Ravensworth Dr | 0.25mi | 4/2.5 | 2,179 (+8%) | 7mo | $295,000 | $135 | 69 |
| 12207 Chartwell Dr | 0.34mi | 4/2.0 | 1,855 (-8%) | 0mo | $259,999 | $140 | 68 |
| 9566 Ravensworth Dr | 0.37mi | 4/2.0 | 2,049 (+2%) | 13mo | $235,000 | $115 | 68 |
| 12310 Vanderheath Dr | 0.28mi | 3/2.0 (-1) | 1,842 (-9%) | 4mo | $220,000 | $119 | 62 |
| 12411 Caren Ct | 0.44mi | 3/2.0 (-1) | 1,847 (-8%) | 2mo | $269,900 | $146 | 56 |
| 9578 W Airport Blvd | 0.26mi | 3/2.0 (-1) | 1,769 (-12%) | 6mo | $240,000 | $136 | 55 |
| 12015 Manorgate Dr | 0.73mi | 4/2.0 | 1,925 (-5%) | 11mo | $325,000 | $169 | 47 |
| 11602 Dover St | 0.70mi | 3/2.0 (-1) | 1,984 (-2%) | 14mo | $598,000 | $301 | 46 |
| 11702 N Petersham Dr SE | 0.55mi | 4/2.0 | 2,319 (+15%) | 13mo | $270,000 | $116 | 37 |
Match score weights: distance 35% · size 25% · config 20% · recency 20%. Top-matched comps best support the ARV.
Projected returns pro-forma
0.38% appreciation · 3.0% rent growth · sell at horizon
- IRR
- 2.8%
- Equity multiple
- 1.13×
- Total profit
- $10,503
- Equity at exit
- $86,628
- IRR
- 7.8%
- Equity multiple
- 1.89×
- Total profit
- $69,774
- Equity at exit
- $108,482
Cash invested: $78,400 (down + closing). Projections, not guarantees.
Landlord ↔ Tenant lean methodology
- Overall (STATE)
- 87 Strongly Landlord-Friendly
- State Texas
- 87 Strongly Landlord-Friendly · R+5
- County
- — inherits STATE
- City
- — inherits STATE
ZIP-level market 77031
- Home prices YoY
- 0.2%
- Active inventory
- 62
- Price-to-rent
- 7.8×
Monthly cashflow live
- Estimated rent
- $3,011 medium interval (Pro) →
- Mortgage (P&I)
- −$1,468
- Tax from tax record
- −$531 /mo · $6,378/yr
- Insurance
- −$117
- HOA
- −$50
- Vacancy / Maint / Mgmt
- −$632
- Net cashflow
- $212
Break-even live
UW: 25.0% down · 7.5% · 30yr · 1.5% tax · 5.0% vac · 8.0% maint · 8.0% mgmt
Financing live
Cash to close
- Down payment
- $70,000
- Closing costs
- $8,400
- Reserves months
- —
- Total cash needed
- —
Loan-product check · same deal, 3 products live
Conventional
25% down · 7.5% · 30yr
- Down + closing
- —
- Monthly P&I
- —
- Monthly cashflow
- —
- DSCR
- —
- Eligible?
- —
Personal DTI + credit; lowest rate.
DSCR
20% down · 8.5% · 30yr
- Down + closing
- —
- Monthly P&I
- —
- Monthly cashflow
- —
- DSCR
- —
- Eligible?
- —
No personal income docs; deal must DSCR.
Hard money
10% down · 12.0% · 12mo
- Down + closing
- —
- Monthly P&I
- —
- Monthly cashflow
- —
- DSCR
- —
- Eligible?
- —
Short-term bridge; refi at stabilization.
Rent comps 3 comps
| Address | Beds | Baths | Sqft | Rent | $/sqft | DOM | Units | Dist |
|---|---|---|---|---|---|---|---|---|
| 12700 Stafford Rd Stafford, TX | 1.0–3.0 | 1.0–2.0 | 1130 | $1,780 | $1.58 | 2d | 14 | 0.68mi |
| 11101 W Airport Blvd Stafford, TX | 3.0 | 1.0–3.0 | 1112 | $4,366 | $3.93 | 24d | 39 | 1.04mi |
| 11117 Signal Way Stafford, TX | 3.0 | 1.0–3.0 | 1143 | $3,662 | $3.20 | 12d | 83 | 1.28mi |
HOA detail
- Monthly dues
- $50 · $600/yr
Listing history 3 events
-
2026-06-18days on market $280,000 Active 3 DOM
-
2026-06-17days on market $280,000 Active 2 DOM
-
2026-06-15$280,000 Active 1 DOM
ⓘ Source: listings_history table (triggers on properties + properties_extension) + one-shot
backfill from property_details.listing_events for pre-trigger history.
Tax reassessment forecast TX · Resets to sale price
- Current annual tax
- $6,378 · $531/mo
- Projected year-2 tax
- $6,378 · $531/mo
- Expected delta
- $0/yr ($0/mo · 0.0%)
ⓘ Screening estimate from a state-policy table — verify with the county assessor before closing.
Climate risk First Street
- Flood 4/10 Moderate FEMA zone X (unshaded) · 22% chance over 30 yrs
- Wildfire 1/10 Low
- Heat 9/10 Extreme 7 d/yr ≥110°F today · 20 d/yr by 30 yrs out
- Wind 9/10 Extreme 99% chance of damaging wind over 30 yrs
- Air quality 2/10 Low 2 unhealthy d/yr today · 2 by 30 yrs out
Nearby sold comps map
Loading sold comps map…
Walkable amenities ~0.75 mi
Loading nearby amenities…
Taxation est. · year 1
- Rental income
- $36,129
- − Mortgage interest
- −$15,684
- − Property taxes
- −$6,378
- − Insurance
- −$1,400
- − Repairs & maintenance
- −$2,890
- − Management
- −$2,890
- − HOA
- −$600
- − Depreciation
- −$8,145
- Taxable loss
- −$1,859
- Est. tax savings @ 24.0%
- +$446
- After-tax cash flow
- $2,990/yr
For passive investors: Depreciation is non-cash, so a rental often shows a tax loss while cash-flowing — sheltering income. Rental losses are passive: they offset passive income freely, and up to $25,000/yr can offset ordinary (W-2) income if you actively participate and your MAGI is under $100k (phasing out to $0 by $150k); unused losses carry forward. On sale, claimed depreciation is recaptured at up to 25%, and gains may owe capital-gains tax (a 1031 exchange can defer both). Figures are a year-1 estimate at your 24.0% rate — not tax advice; consult a CPA.
Schools (NCES district)
- District
- Houston ISD
- NCES district ID
- 4823640
- Math proficiency
- 27% ▼ -18.00%
- Reading proficiency
- 35% ▼ -6.00%
- Median HH income
- $46,054
- Composite
- 26.63/100
- National rank
- #7173
- State rank
- #593 of 826 in TX
Livability — Houston
- Score
- 74/100
- State rank
- #184
- US rank
- #4771
Category grades
Schools grade is shown separately in the Schools card above.
Census & demographics
- Census place
- Houston, TX
- City population
- 3,226,434
- Population (ZIP)
- 15,740
Population outlook (Harris County) Hauer SSP2
- Today (2025)
- 5,571,493 people
- By 2030
- 6,089,821 · +9.3%
- By 2040
- 7,142,806 · +28.2%
- By 2050
- 8,185,864 · +46.9%
- By 2075
- 10,574,329 · +89.8%
- By 2100
- 12,109,958 · +117.4%
Race, ethnicity, and origin ACS 2023
- Neighborhood character
- Diverse neighborhood (Simpson 0.61)
- Race & ethnicity
- Hispanic / Latino 57% Two or more races 25% Black 20% White 14% Asian 7%
- Hispanic origin (detail)
- Mexican 27%
- Common ancestry
- Italian 1% Lithuanian 1%
- Foreign-born
- 42% · Canada, Jamaica, Vietnam
- Languages at home
- 42% English-only · Spanish 48% Vietnamese 2% Other Indo-European 2%
Political lean MEDSL · Harris
- 2024 margin
- Lean D (+5.5) · D 52.0% · R 46.4% · Other 1.6%
- 2008→2024 swing
- +3.9pp toward D · 2008: 1.6pp · 2024: 5.5pp
- All cycles
- 2024: D+5.5 2020: D+13.3 2016: D+12.4 2012: D+0.1 2008: D+1.6
Not yet ingested
- Civics
- —
Market trends
- HPI YoY
- ▲ 0.38%
- Current HPI
- 235.9144
- Rent YoY
- —
- Metro
- —
- State GDP YoY
- ▲ 3.95%
- F500 in state
- 110
Industry mix (Fortune 500 HQ in TX)
| Industry | F500 HQs | Revenue |
|---|---|---|
| Energy | 16 | $1,198B |
|
||
| Technology | 5 | $198B |
|
||
| Engineering / Construction | 4 | $72B |
|
||
| Energy Services | 3 | $60B |
|
||
| Utilities | 3 | $41B |
|
||
| Healthcare | 2 | $330B |
|
||
Price history
+308.8% since first listed4 events — show timeline
- 2026-06-15 Listed $280,000 HARMLS
- 2022-12-19 Sold (Public Records) — Public Records
- 2003-12-05 Sold (Public Records) — Public Records
- 1994-10-10 Sold (Public Records) $68,500 Public Records
Property tax history
+4.1%/yrLatest (2025): $6,378 · +3.3% YoY. Source: county tax records.
Cash-flow waterfall
monthlySold comps — $/sqft
last 12 mo · ≤1 miLoading sold comps…