1912 George Washington Way Unit D · Richland, WA
Flood risk 6/10 · Moderate
- FEMA flood zone
- X
- Chance of flooding over 30 yrs
- 0.27%
- Est. flood insurance / yr
- $507 – $1,088
Fire risk 4/10 · Minor
- Est. fire insurance / yr
- $604 – $1,122
Heat risk 5/10 · Moderate
- Hot days now (above 99°F)
- 7 days/yr
- Hot days in 30 yrs
- 15 days/yr
Wind risk 1/10 · Minimal
- Chance of severe wind over 30 yrs
- —
Air-quality risk 7/10 · Major
- Unhealthy air days now
- 11 days/yr
- Unhealthy air days in 30 yrs
- 12 days/yr
Risk factors via First Street. Map © Google.
Why this score? — see what drove the D+ grade
The composite is a weighted blend of 9 inputs, each scored 0–100. Each bar is that input's sub-score; the figure is the points it added to the 100-point composite (weight × sub-score).
- Cash flow +15.0/30.0
- ARV discount +7.5/15.0
- Schools +5.3/10.0
- 1% rule +5.0/10.0
- DSCR +5.0/10.0
- Livability +4.0/5.0
- Rent growth +2.9/5.0
- Condition / age +2.5/5.0
- Appreciation +0.0/10.0
$1,095
🖨 Deal sheet (PDF) 📄 Offer letter ✓ Due diligence
Listing remarks
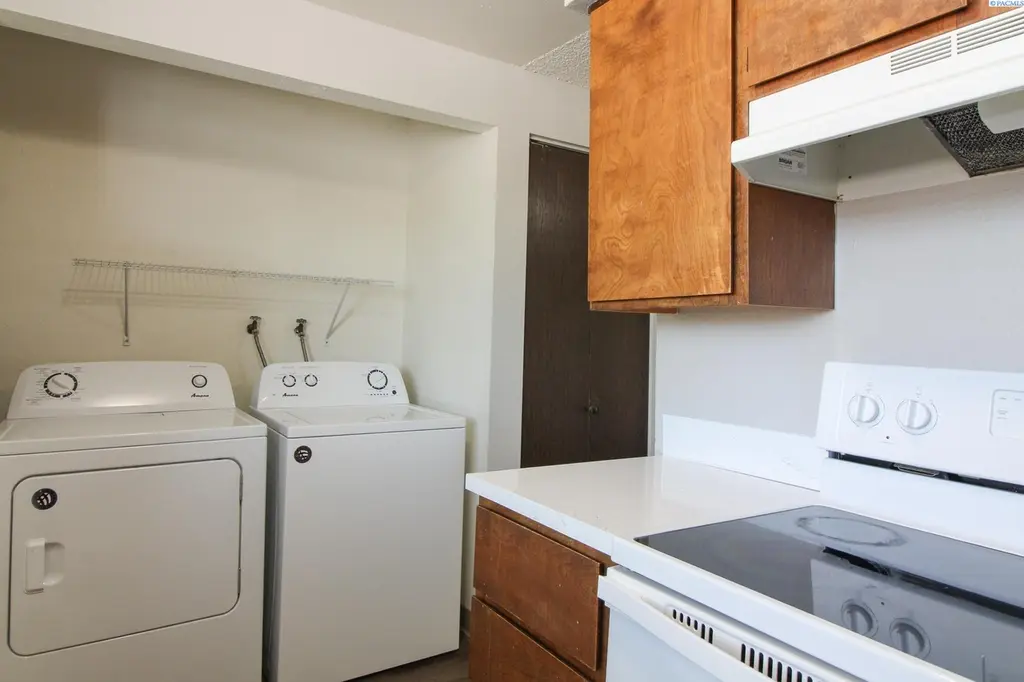
We do not accept 3rd party applications or viewing requests. 2 Bed, 1 Bath 858 sqft apartment in Richland Brightened by natural light, this 2-bedroom, 1 bathroom upstairs apartment in Central Richland has a relaxed an approachable feel you will love. With new hard surface flooring throughout the space transitions from one open living area after another. The deck outside is easy to enjoy while the convenient dishwasher and window above the kitchen sink is a lovely addition. Central heating and air conditioning plus washer and dryer are just two of the other benefits to this great home. Interior: * 2 Bedrooms * 1 Bathrooms * 858 sq ft * Hard Surface Flooring * New paint * Dishwas
Key facts
- Private deck
- Central heating
- Air conditioning
Tags
Property features AI
Exterior
- Parking: No garage
- Home design: Residential Income property
- Exterior features: Zoned SINGLE FAMILY R
Interior
- Interior features: Apartment unit
Neighborhood map
What this means for you Summary
Snapshot
- This is a 2-bed/1.0-bath condo listed at $1k.
Deal economics
- At list price, monthly cash flow is $1k ($13k/yr) — positive.
- The deal already cash-flows at list — no discount required.
- Meets the 1% rule at list price ($1k rent vs $1k).
- Recommended offer: $1k (1.6% below list) — sets the bar for market timing.
- Cap rate 1199.3% vs local median 2.8% in Richland — top-decile yield for the area; either an underpriced asset or a hidden risk that comps aren't pricing in. Stress-test before assuming the spread holds.
Location & tenants
- Location reads 79/100 on livability (#112 in WA, #2,258 nationally) — a middle-class / working-renter tenant base. Strengths: commute A+, housing A+, health & safety A+; Watch: cost of living C-, amenities F.
- Richland School District (urban): math 52% / reading 64% proficiency, ranked #61 of 291 in WA (top 21%) — acceptable for families but not a draw, mixed tenant base, ~2y average lease.
- Market conditions: Rents rising (+1.6%/yr); 544 active listings in the ZIP; 15 comparable units currently listed for rent nearby; rentals at typical pace (median 22d on market — plan ~3-4 weeks tenant-placement turnaround); solid renter incomes; 1,532 units permitted in Benton County in 2024 (389 in 5+ unit buildings).
- This rent is only 17% of the median local income ($100k/yr) — well below the 30% rent-burden line; pricing power to push rent on renewal without tenant pushback.
Forward outlook
- Local home prices are declining (-3.0%/yr); year-one equity from $7 of loan paydown is wiped out by about $33 of value loss. Plan a longer hold.
- Benton County population projected at +32% by 2050 — long-run rental-demand tailwind backs the buy-and-hold thesis.
- At projected returns (-3.0% appreciation + 1.6% rent growth), your $307 cash investment doubles in ~1 year — after that, you're playing with house money.
Negotiation context
- It's been on market 15 days — a 2% lower offer ($1k) is reasonable based on typical stale-listing flexibility.
Risks & watch-outs
- Climate carrying-cost: major flood risk; extreme-heat days projected 7→15/yr by 2055 (HVAC capex compounding) — expect insurance premiums to compound above CPI over the hold.
Questions for the listing agent
- Built in 1975 — when were the roof, HVAC, electrical panel, plumbing, and water heater last replaced?
- Any open or pending special assessments — roof, HVAC, plumbing, elevator, façade? What's the per-unit balance and payoff schedule, and is the seller paying it off at close or rolling it to the buyer?
- Is there a deadline driving the sale (1031 exchange, divorce, estate, relocation)? That informs how much negotiation room exists.
- Schools are A-rated — typically a magnet for longer-tenancy family renters. What's the average tenant stay here, and is there a school-zone premium baked into asking?
- The area grade is low — what's the realistic commute time and amenity access for the typical tenant pool here? Any planned neighborhood developments (good or bad) we should know about?
- What's the average days-on-market for RENTAL listings here right now (not sales)? A rising rental-DOM trend means longer vacancies and softer asking-rent achievability than the comps imply.
- What's the recent tenant-quality profile in this submarket — average credit score on applications, eviction rate, late-payment / NSF rate, and stable-employment percentage? A property-management company in the area should have these aggregated.
- How much new apartment / multifamily construction is in the pipeline within 1–3 miles? Heavy new supply (>2% of stock underway) typically softens rents 12–24 months out; light construction supports rent growth.
Investment metrics
- 1% rule
- 126.72% ✓
- Cap rate
- 1199.29%
- Cash-on-cash
- 4260.72%
- DSCR
- 190.58
- GRM
- 0.1
CMA / ARV
No comps found within radius.
Projected returns pro-forma
-3.0% appreciation · 1.6% rent growth · sell at horizon
- IRR
- —
- Equity multiple
- 220.34×
- Total profit
- $67,250
- Equity at exit
- $163
- IRR
- —
- Equity multiple
- 458.38×
- Total profit
- $140,233
- Equity at exit
- $95
Cash invested: $307 (down + closing). Projections, not guarantees.
Landlord ↔ Tenant lean methodology
- Overall (STATE)
- 28 Tenant-Leaning
- State Washington
- 28 Tenant-Leaning · D+8
- County
- — inherits STATE
- City
- — inherits STATE
ZIP-level market 99352
- Rents YoY
- 1.6%
- Active inventory
- 544
- Price-to-rent
- 0.1×
Monthly cashflow live
- Estimated rent
- $1,388 high interval (Pro) →
- Mortgage (P&I)
- −$6
- Tax est. 1.5%
- −$1 /mo · $16/yr
- Insurance
- −$0
- HOA
- −$0
- Vacancy / Maint / Mgmt
- −$291
- Net cashflow
- $1,089
Break-even live
Sensitivity live
| Price | -10% $1,089 | -5% $1,089 | +0% $1,089 | +5% $1,088 | +10% $1,088 |
|---|---|---|---|---|---|
| Rent | -10% $979 | -5% $1,034 | +0% $1,089 | +5% $1,143 | +10% $1,198 |
| Rate | -1.0pp $1,089 | -0.5pp $1,089 | base $1,089 | +0.5pp $1,088 | +1.0pp $1,088 |
UW: 25.0% down · 7.5% · 30yr · 1.5% tax · 5.0% vac · 8.0% maint · 8.0% mgmt
Financing live
Cash to close
- Down payment
- $274
- Closing costs
- $33
- Reserves months
- —
- Total cash needed
- —
Loan-product check · same deal, 3 products live
Conventional
25% down · 7.5% · 30yr
- Down + closing
- —
- Monthly P&I
- —
- Monthly cashflow
- —
- DSCR
- —
- Eligible?
- —
Personal DTI + credit; lowest rate.
DSCR
20% down · 8.5% · 30yr
- Down + closing
- —
- Monthly P&I
- —
- Monthly cashflow
- —
- DSCR
- —
- Eligible?
- —
No personal income docs; deal must DSCR.
Hard money
10% down · 12.0% · 12mo
- Down + closing
- —
- Monthly P&I
- —
- Monthly cashflow
- —
- DSCR
- —
- Eligible?
- —
Short-term bridge; refi at stabilization.
Rent comps 15 comps
| Address | Beds | Baths | Sqft | Rent | $/sqft | DOM | Units | Dist |
|---|---|---|---|---|---|---|---|---|
| 1911 Hoxie Ave Unit C Richland, WA | 2.0 | 1.0 | 891 | $1,500 | $1.68 | 44d | 1 | 0.06mi |
| 1930 George Washington Way Unit 108 Richland, WA | 2.0 | 2.0 | 824 | $1,150 | $1.40 | 21d | 1 | 0.16mi |
| 1930 George Washington Way Richland, WA | 2.0 | 2.0 | 824 | $1,150 | $1.40 | 14d | 1 | 0.16mi |
| 200 Waldron St Richland, WA | 2.0 | 1.0 | 675 | $1,335 | $1.98 | 21d | 2 | 0.36mi |
| 1621 George Washington Way Richland, WA | 1.0–3.0 | 1.0–2.0 | 907 | $1,172 | $1.29 | 21d | 1 | 0.39mi |
| 1650 Mowry Sq Richland, WA | 1.0 | 1.0 | 643 | $1,260 | $1.96 | 21d | 1 | 0.40mi |
| 1900 Stevens Dr Richland, WA | 1.0–2.0 | 1.0 | 816 | $1,425 | $1.75 | 21d | 23 | 0.42mi |
| 140 Van Giesen St Richland, WA | 2.0 | 1.5 | 900 | $1,195 | $1.33 | 44d | 1 | 0.44mi |
| 160 Van Giesen St Richland, WA | 1.0 | 1.0 | 636 | $1,115 | $1.75 | 21d | 1 | 0.44mi |
| 1872 Alder Ave Unit A Richland, WA | 2.0 | 2.0 | 668 | $1,795 | $2.69 | 14d | 1 | 0.99mi |
| 2324 Hood Ave Richland, WA | 1.0–2.0 | 1.0 | 825 | $1,400 | $1.70 | 14d | 5 | 1.04mi |
| 2360 Hood Ave Richland, WA | 1.0 | 1.0 | 758 | $1,280 | $1.69 | 14d | 3 | 1.13mi |
| 1211 George Washington Way Unit 47 Richland, WA | 1.0 | 1.0 | 700 | $1,025 | $1.46 | 21d | 1 | 1.14mi |
| 2111 Turner St Apt 22 Richland, WA | 2.0 | 1.0 | 776 | $1,075 | $1.39 | 44d | 1 | 1.33mi |
| 2111 Turner St Richland, WA | 2.0 | 1.0 | 776 | $1,095 | $1.41 | 44d | 1 | 1.36mi |
HOA detail condo
- Monthly dues
- $0 · $0/yr
- Assessments
- None detected in remarks — confirm with the listing agent.
Listing history 12 events
-
2026-06-18days on market $1,095 Active 15 DOM
-
2026-06-17days on market $1,095 Active 14 DOM
-
2026-06-16days on market $1,095 Active 13 DOM
-
2026-06-15days on market $1,095 Active 12 DOM
-
2026-06-14days on market $1,095 Active 10 DOM
-
2026-06-13days on market $1,095 Active 9 DOM
-
2026-06-10days on market $1,095 Active 7 DOM
-
2026-06-09days on market $1,095 Active 6 DOM
-
2026-06-08days on market $1,095 Active 5 DOM
-
2026-06-07days on market $1,095 Active 4 DOM
-
2026-06-05remarks 699-char remark
-
2026-06-05$1,095 Active 1 DOM
ⓘ Source: listings_history table (triggers on properties + properties_extension) + one-shot
backfill from property_details.listing_events for pre-trigger history.
Climate risk First Street
- Flood 6/10 Major FEMA zone X · 27% chance over 30 yrs
- Wildfire 4/10 Moderate
- Heat 5/10 Major 7 d/yr ≥99°F today · 15 d/yr by 30 yrs out
- Wind 1/10 Low
- Air quality 7/10 Severe 11 unhealthy d/yr today · 12 by 30 yrs out
Nearby sold comps map
Loading sold comps map…
Walkable amenities ~0.75 mi
Loading nearby amenities…
Taxation est. · year 1
- Rental income
- $16,651
- − Mortgage interest
- −$61
- − Property taxes
- −$16
- − Insurance
- −$5
- − Repairs & maintenance
- −$1,332
- − Management
- −$1,332
- − Depreciation
- −$32
- Taxable income
- $13,872
- Est. tax owed @ 24.0%
- −$3,329
- After-tax cash flow
- $9,734/yr
For passive investors: Depreciation is non-cash, so a rental often shows a tax loss while cash-flowing — sheltering income. Rental losses are passive: they offset passive income freely, and up to $25,000/yr can offset ordinary (W-2) income if you actively participate and your MAGI is under $100k (phasing out to $0 by $150k); unused losses carry forward. On sale, claimed depreciation is recaptured at up to 25%, and gains may owe capital-gains tax (a 1031 exchange can defer both). Figures are a year-1 estimate at your 24.0% rate — not tax advice; consult a CPA.
Schools (NCES district)
- District
- Richland School District
- NCES district ID
- 5307320
- Math proficiency
- 52% ▬ 0.00%
- Reading proficiency
- 64% ▼ -1.00%
- Median HH income
- $70,475
- Composite
- 53.04/100
- National rank
- #3244
- State rank
- #61 of 291 in WA
Livability — Richland
- Score
- 79/100
- State rank
- #112
- US rank
- #2258
Category grades
Schools grade is shown separately in the Schools card above.
Census & demographics
- Census place
- Richland, WA
- County
- Benton County · 186,895 people
- City population
- 62,989
- Metro
- Kennewick-Richland, WA
- Population (ZIP)
- 37,430
- Household income
- $100,108
- Rent vs Own
- Severe rent burden
- 983.0
Population outlook (Benton County) Hauer SSP2
- Today (2025)
- 219,421 people
- By 2030
- 233,813 · +6.6%
- By 2040
- 262,134 · +19.5%
- By 2050
- 290,100 · +32.2%
- By 2075
- 363,525 · +65.7%
- By 2100
- 418,667 · +90.8%
Race, ethnicity, and origin ACS 2023
- Neighborhood character
- Predominantly White (73%)
- Race & ethnicity
- White 73% Hispanic / Latino 14% Two or more races 10% Asian 7% Black 2%
- Hispanic origin (detail)
- Mexican 11%
- Common ancestry
- Italian 4% Portuguese 4% Slovak 3%
- Foreign-born
- 9% · Canada, South Korea, China
- Languages at home
- 88% English-only · Spanish 4% Other Indo-European 3% Korean 1%
Political lean MEDSL · Benton
- 2024 margin
- Strong R (+21.9) · D 37.7% · R 59.6% · Other 2.7%
- 2008→2024 swing
- +4.2pp toward D · 2008: -26.1pp · 2024: -21.9pp
- All cycles
- 2024: R+21.9 2020: R+21.0 2016: R+26.6 2012: R+27.0 2008: R+26.1
Not yet ingested
- Civics
- —
Market trends
- HPI YoY
- ▼ -323.81%
- Current HPI
- 217.3435
- Rent YoY
- ▲ 1.60%
- Metro
- Kennewick-Richland, WA
- State GDP YoY
- ▲ 4.65%
- F500 in state
- 22
Industry mix (Fortune 500 HQ in WA)
| Industry | F500 HQs | Revenue |
|---|---|---|
| Retail | 2 | $269B |
|
||
| Technology / Retail | 1 | $638B |
|
||
| Technology | 1 | $245B |
|
||
| Telecommunications | 1 | $38B |
|
||
| Food / Beverage | 1 | $36B |
|
||
| Automotive / Trucks | 1 | $34B |
|
||
Price history
1 event — show timeline
- 2026-06-03 Listed $1,095 PACMLS
Cash-flow waterfall
monthlySold comps — $/sqft
last 12 mo · ≤1 miLoading sold comps…