 🏷️ Likely Rental
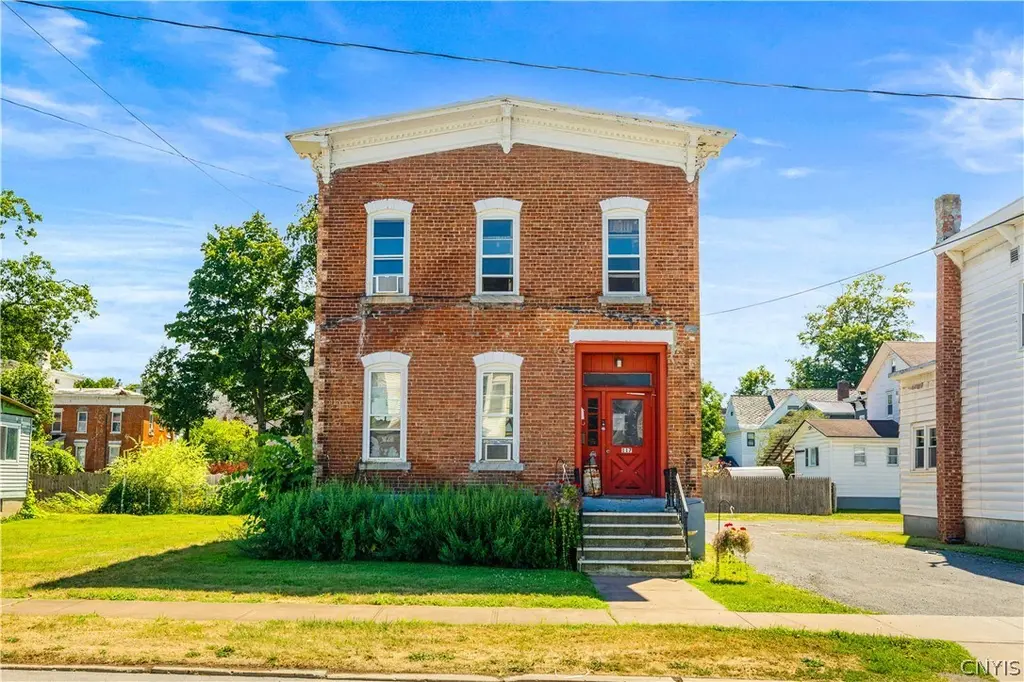
117 W Walnut St · Oneida, NY
Flood risk 1/10 · Minimal
- FEMA flood zone
- X (unshaded)
- Chance of flooding over 30 yrs
- 0.0%
- Est. flood insurance / yr
- $473 – $860
Fire risk 3/10 · Minor
- Est. fire insurance / yr
- $691 – $1,283
Heat risk 3/10 · Minor
- Hot days now (above 94°F)
- 7 days/yr
- Hot days in 30 yrs
- 17 days/yr
Wind risk 1/10 · Minimal
- Chance of severe wind over 30 yrs
- —
Air-quality risk 2/10 · Minimal
- Unhealthy air days now
- 0 days/yr
- Unhealthy air days in 30 yrs
- 2 days/yr
Risk factors via First Street. Map © Google.
Why this score? — see what drove the B+ grade
The composite is a weighted blend of 9 inputs, each scored 0–100. Each bar is that input's sub-score; the figure is the points it added to the 100-point composite (weight × sub-score).
- Cash flow +30.0/30.0
- ARV discount +15.0/15.0
- 1% rule +10.0/10.0
- DSCR +10.0/10.0
- Schools +4.1/10.0
- Livability +3.1/5.0
- Rent growth +2.5/5.0
- Condition / age +2.5/5.0
- Appreciation +0.0/10.0
$189,900
🖨 Deal sheet (PDF) 📄 Offer letter ✓ Due diligence
Multi-family units
County records classify this as Multi-Family (2-4 Unit). Listing-text estimate: 3 units. confirmed
Listing remarks
This well-maintained 3-unit multi-family property is the perfect addition to your portfolio or an ideal start to your real estate investment journey. Currently fully occupied with rents up to date, this building generates over $3,000 per month in gross income—a solid return from day one! The property features two 1-bedroom apartments and one spacious 2-bedroom unit, providing a mix of options for tenants. One apartment has been completely remodeled, and all units are well cared for, making this a low-maintenance, income-producing asset. Opportunities like this don’t last long—secure your next investment and start earning immediately!
Key facts
- Remodeled apartment
- Fully occupied
- Generates income
Tags
Property features AI
Finance
- Financial info: Three separate electric meters and three separate gas meters; Total of 3 residential units; Gross annual income reported as $36,540; Owner pays all utilities; rents listed include utilities; Operating expenses include electric, fuel, insurance, maintenance (structure and general), professional management, snow removal, utilities, and water/sewer
Exterior
- Parking: Gravel parking
- Utilities: Electricity connected (circuit breakers); Public water connected; Sewer connected
- Home design: 2-story multi-unit property
- Construction: Brick construction; Metal roof; Block and stone foundation; Existing (pre-owned) condition
- Exterior features: Rectangular residential lot with city street frontage; Lot dimensions approximately 72 x 200
Interior
- Kitchen: Eat-in kitchens in applicable units
- Bedrooms: Three units total: two 1-bedroom units and one 2-bedroom unit
- Flooring: Carpet; Hardwood; Vinyl; Varies
- Bathrooms: Three full bathrooms (one per unit)
- Heating & cooling: Gas forced-air heating
- Interior features: Full basement; Carpet, hardwood, vinyl, and varied flooring throughout
- Laundry & utility: Gas water heater
Neighborhood map
What this means for you Summary
Snapshot
- This is a 3 × 4-bed/3.0-bath units multifamily listed at $190k.
Deal economics
- At list price, monthly cash flow is $2k ($23k/yr) — positive. Per door: $637/mo.
- The deal already cash-flows at list — no discount required.
- Meets the 1% rule at list price ($4k rent vs $190k).
- Recommended offer: $184k (3.0% below list) — sets the bar for market timing.
- Cap rate 18.4% vs local median 4.0% in Oneida — top-decile yield for the area; either an underpriced asset or a hidden risk that comps aren't pricing in. Stress-test before assuming the spread holds.
Location & tenants
- Location reads 61/100 on livability (#924 in NY) — a middle-class / working-renter tenant base. Strengths: cost of living A+, housing A+; Watch: schools C-, employment C-, health & safety C-.
- Oneida City School District (town): math 43% / reading 54% proficiency, ranked #421 of 590 in NY (top 71%) — families likely to look elsewhere, expect single-tenant / working-renter base with shorter leases.
- Market conditions: 65 active listings in the ZIP; 137 units permitted in Madison County in 2024 (46 in 5+ unit buildings).
Forward outlook
- Local home prices are declining (-3.0%/yr); year-one equity from $1k of loan paydown is wiped out by about $6k of value loss. Plan a longer hold.
- Madison County population projected at -24% by 2050 — secular population decline; favor cash flow + early exit over multi-decade hold.
- At projected returns (-3.0% appreciation + 3.0% rent growth), your $53k cash investment doubles in ~3 years — after that, you're playing with house money.
Negotiation context
- It's been on market 51 days — a 3% lower offer ($184k) is reasonable based on typical stale-listing flexibility.
- 5 sale attempts since 5y ago with the ask held roughly flat each time — persistent listings suggest the price (not the market) is what's stuck; bring a comps-based counter.
- Current owner paid $144k; 31% above their basis — modest negotiation headroom, anchor on the comps not their cost.
Risks & watch-outs
- Watch-outs: built in 1916 — expect roof / HVAC / electrical / plumbing capex.
Questions for the listing agent
- It's been on market 51 days. Have you received any prior offers? Is the seller open to a 3% concession, seller financing, or rate buy-down credit?
- Can we see the unit-by-unit rent roll, current vacancy, and any below-market leases? What's the average tenancy length?
- What capital expenditures (roof, boiler, parking lot, exteriors) have been made in the last 5 years, and what's planned in the next 2?
- Built in 1916 — when were the roof, HVAC, electrical panel, plumbing, and water heater last replaced?
- Is there a deadline driving the sale (1031 exchange, divorce, estate, relocation)? That informs how much negotiation room exists.
- Crime grade is F in this area — have there been break-ins, vandalism, or insurance claims at this property in the last 3 years? What carrier currently insures it and at what premium?
- What's the average days-on-market for RENTAL listings here right now (not sales)? A rising rental-DOM trend means longer vacancies and softer asking-rent achievability than the comps imply.
- What's the recent tenant-quality profile in this submarket — average credit score on applications, eviction rate, late-payment / NSF rate, and stable-employment percentage? A property-management company in the area should have these aggregated.
- How much new apartment / multifamily construction is in the pipeline within 1–3 miles? Heavy new supply (>2% of stock underway) typically softens rents 12–24 months out; light construction supports rent growth.
Investment metrics
- 1% rule
- 2.24% ✓
- Cap rate
- 18.36%
- Cash-on-cash
- 43.10%
- DSCR
- 2.92
- GRM
- 3.7
CMA / ARV
- ARV (median comp)
- $248,133
- List price
- $189,900
- Delta
- -23.47%
- Verdict
- UNDERPRICED
- Comps
- 20 within 1.0 mi
Show comp detail 10 sales within ~0.75 mi
| Address | Dist | Beds/Ba | Sqft | Sold | Price | $/sf | Match |
|---|---|---|---|---|---|---|---|
| 521 Main St | 0.38mi | 4/2.0 | 2,096 (-1%) | 20mo | $186,000 | $89 | 58 |
| 362 Washington Ave | 0.46mi | 4/2.0 | 1,976 (-7%) | 9mo | $253,000 | $128 | 54 |
| 358 Washington Ave | 0.45mi | 4/2.0 | 2,296 (+8%) | 8mo | $295,000 | $128 | 53 |
| 429 Sconondoa St | 0.68mi | 4/3.0 | 2,006 (-5%) | 7mo | $100,000 | $50 | 52 |
| 221 Lenox Ave | 0.39mi | 5/2.0 (+1) | 2,208 (+4%) | 16mo | $154,500 | $70 | 51 |
| 307 Farrier Ave | 0.48mi | 4/2.0 | 2,020 (-5%) | 23mo | $121,500 | $60 | 45 |
| 263 E Walnut St | 0.33mi | 3/1.0 (-1) | 1,944 (-8%) | 15mo | $35,000 | $18 | 43 |
| 109 Furnace Ave | 0.73mi | 4/2.0 | 2,248 (+6%) | 12mo | $159,650 | $71 | 40 |
| 228 N Main St | 0.74mi | 4/3.0 | 1,934 (-9%) | 14mo | $95,000 | $49 | 37 |
| 123 Furnace Ave | 0.74mi | 5/2.0 (+1) | 2,306 (+9%) | 20mo | $140,450 | $61 | 23 |
Match score weights: distance 35% · size 25% · config 20% · recency 20%. Top-matched comps best support the ARV.
Projected returns pro-forma
-3.0% appreciation · 3.0% rent growth · sell at horizon
- IRR
- 40.0%
- Equity multiple
- 2.71×
- Total profit
- $91,021
- Equity at exit
- $28,315
- IRR
- 46.3%
- Equity multiple
- 5.45×
- Total profit
- $236,501
- Equity at exit
- $16,419
Cash invested: $53,172 (down + closing). Projections, not guarantees.
Landlord ↔ Tenant lean methodology
- Overall (STATE)
- 15 Strongly Tenant-Friendly
- State New York
- 15 Strongly Tenant-Friendly · D+10
- County
- — inherits STATE
- City
- — inherits STATE
ZIP-level market 13421
- Home prices YoY
- -5.1%
- Active inventory
- 65
- Price-to-rent
- 11.2×
Monthly cashflow live
- Estimated rent
- $4,254 medium interval (Pro) →
- Mortgage (P&I)
- −$996
- Tax from tax record
- −$376 /mo · $4,509/yr
- Insurance
- −$79
- HOA
- −$0
- Vacancy / Maint / Mgmt
- −$893
- Net cashflow
- $1,910
Break-even live
Sensitivity live
| Price | -10% $2,017 | -5% $1,964 | +0% $1,910 | +5% $1,856 | +10% $1,802 |
|---|---|---|---|---|---|
| Rent | -10% $1,574 | -5% $1,742 | +0% $1,910 | +5% $2,078 | +10% $2,246 |
| Rate | -1.0pp $2,006 | -0.5pp $1,958 | base $1,910 | +0.5pp $1,861 | +1.0pp $1,811 |
3-unit breakdown (identical units grouped — click to expand)
| Units | Beds | Baths | Est. rent |
|---|---|---|---|
| 3× units | 4 | 3 | $4,254 |
| #1 | 4 | 3 | $1,418 |
| #2 | 4 | 3 | $1,418 |
| #3 | 4 | 3 | $1,418 |
| Total (3 units) | $4,254 | ||
UW: 25.0% down · 7.5% · 30yr · 1.5% tax · 5.0% vac · 8.0% maint · 8.0% mgmt
Financing live
Cash to close
- Down payment
- $47,475
- Closing costs
- $5,697
- Reserves months
- —
- Total cash needed
- —
Loan-product check · same deal, 3 products live
Conventional
25% down · 7.5% · 30yr
- Down + closing
- —
- Monthly P&I
- —
- Monthly cashflow
- —
- DSCR
- —
- Eligible?
- —
Personal DTI + credit; lowest rate.
DSCR
20% down · 8.5% · 30yr
- Down + closing
- —
- Monthly P&I
- —
- Monthly cashflow
- —
- DSCR
- —
- Eligible?
- —
No personal income docs; deal must DSCR.
Hard money
10% down · 12.0% · 12mo
- Down + closing
- —
- Monthly P&I
- —
- Monthly cashflow
- —
- DSCR
- —
- Eligible?
- —
Short-term bridge; refi at stabilization.
Listing history 31 events
-
2026-06-18days on market $189,900 Active 51 DOM
-
2026-06-17days on market $189,900 Active 50 DOM
-
2026-06-16days on market $189,900 Active 49 DOM
-
2026-06-15days on market $189,900 Active 48 DOM
-
2026-06-13days on market $189,900 Active 46 DOM
-
2026-06-12days on market $189,900 Active 45 DOM
-
2026-06-09days on market $189,900 Active 42 DOM
-
2026-06-08days on market $189,900 Active 41 DOM
-
2026-06-07days on market $189,900 Active 40 DOM
-
2026-06-07days on market $189,900 Active 39 DOM
-
2026-06-04days on market $189,900 Active 36 DOM
-
2026-06-02days on market $189,900 Active 35 DOM
-
2026-06-01days on market $189,900 Active 34 DOM
-
2026-05-31days on market $189,900 Active 33 DOM
-
2026-04-28$189,900 Active 659-char remark
-
2026-02-28historical
-
2026-01-08$189,900 Active
-
2026-01-08historical
-
2025-11-05price $189,900
-
2025-10-08price $199,900
-
2025-09-15price $205,000
-
2025-08-22$220,000 Active
-
2024-01-08soldstatus $144,500
-
2024-01-05soldstatus $144,500 Closed
-
2023-12-27status Pending
-
2023-11-29status Pending Sale
-
2023-11-08historical Continue to Show- Under Contract
-
2023-10-30$144,500 Active
-
2021-12-04historical
-
2021-07-23price $139,900
-
2021-06-04$154,900 Active
ⓘ Source: listings_history table (triggers on properties + properties_extension) + one-shot
backfill from property_details.listing_events for pre-trigger history.
Tax reassessment forecast NY · Partial reset (capped growth)
- Current annual tax
- $4,509 · $376/mo
- Projected year-2 tax
- $4,509 · $376/mo
- Expected delta
- $0/yr ($0/mo · 0.0%)
ⓘ Screening estimate from a state-policy table — verify with the county assessor before closing.
Climate risk First Street
- Flood 1/10 Low FEMA zone X (unshaded) · 0% chance over 30 yrs
- Wildfire 3/10 Moderate
- Heat 3/10 Moderate 7 d/yr ≥94°F today · 17 d/yr by 30 yrs out
- Wind 1/10 Low
- Air quality 2/10 Low 0 unhealthy d/yr today · 2 by 30 yrs out
Nearby sold comps map
Loading sold comps map…
Walkable amenities ~0.75 mi
Loading nearby amenities…
Taxation est. · year 1
- Rental income
- $51,048
- − Mortgage interest
- −$10,637
- − Property taxes
- −$4,509
- − Insurance
- −$950
- − Repairs & maintenance
- −$4,084
- − Management
- −$4,084
- − Depreciation
- −$5,524
- Taxable income
- $21,260
- Est. tax owed @ 24.0%
- −$5,102
- After-tax cash flow
- $17,817/yr
For passive investors: Depreciation is non-cash, so a rental often shows a tax loss while cash-flowing — sheltering income. Rental losses are passive: they offset passive income freely, and up to $25,000/yr can offset ordinary (W-2) income if you actively participate and your MAGI is under $100k (phasing out to $0 by $150k); unused losses carry forward. On sale, claimed depreciation is recaptured at up to 25%, and gains may owe capital-gains tax (a 1031 exchange can defer both). Figures are a year-1 estimate at your 24.0% rate — not tax advice; consult a CPA.
Schools (NCES district)
- District
- Oneida City School District
- NCES district ID
- 3600013
- Math proficiency
- 43% ▼ -11.00%
- Reading proficiency
- 54% ▲ 12.00%
- Median HH income
- $45,791
- Composite
- 41.1/100
- National rank
- #3568
- State rank
- #421 of 590 in NY
Livability — Oneida
- Score
- 61/100
- State rank
- #924
- US rank
- #18033
Category grades
Schools grade is shown separately in the Schools card above.
Census & demographics
- Census place
- Oneida, NY
- City population
- 12,742
- Population (ZIP)
- 12,742
Population outlook (Madison County) Hauer SSP2
- Today (2025)
- 69,528 people
- By 2030
- 66,599 · -4.2%
- By 2040
- 59,814 · -14.0%
- By 2050
- 52,842 · -24.0%
- By 2075
- 39,167 · -43.7%
- By 2100
- 28,442 · -59.1%
Race, ethnicity, and origin ACS 2023
- Neighborhood character
- Predominantly White (92%)
- Race & ethnicity
- White 92% Two or more races 4% Hispanic / Latino 3%
- Common ancestry
- Lithuanian 5% Romanian 4% Iranian 2%
- Foreign-born
- 1% · Canada, China
- Languages at home
- 97% English-only · Spanish 1% Other Indo-European 1%
Political lean MEDSL · Madison
- 2024 margin
- R (+13.1) · D 43.5% · R 56.5%
- 2008→2024 swing
- -13.9pp toward R · 2008: 0.9pp · 2024: -13.1pp
- All cycles
- 2024: R+13.1 2020: R+10.6 2016: R+15.9 2012: D+0.3 2008: D+0.9
Not yet ingested
- Civics
- —
Market trends
- HPI YoY
- ▼ -13.30%
- Current HPI
- 248.3909
- Rent YoY
- —
- Metro
- —
- State GDP YoY
- ▲ 2.60%
- F500 in state
- 92
Industry mix (Fortune 500 HQ in NY)
| Industry | F500 HQs | Revenue |
|---|---|---|
| Financial Services | 10 | $950B |
|
||
| Consumer Goods | 9 | $162B |
|
||
| Insurance | 4 | $225B |
|
||
| Telecommunications | 2 | $144B |
|
||
| Pharmaceuticals | 2 | $112B |
|
||
| Media / Entertainment | 2 | $69B |
|
||
Price history
+22.6% since first listed17 events — show timeline
- 2026-04-28 Listed $189,900 CNYIS
- 2026-02-28 Listing Removed — CNYIS
- 2026-01-08 Listing Removed — CNYIS
- 2026-01-08 Listed $189,900 CNYIS
- 2025-11-05 Price Changed $189,900 CNYIS
- 2025-10-08 Price Changed $199,900 CNYIS
- 2025-09-15 Price Changed $205,000 CNYIS
- 2025-08-22 Listed $220,000 CNYIS
- 2024-01-08 Sold (Public Records) $144,500 Public Records
- 2024-01-05 Sold (MLS) $144,500 CNYIS
- 2023-12-27 Pending — CNYIS
- 2023-11-29 Pending — CNYIS
- 2023-11-08 Contingent — CNYIS
- 2023-10-30 Listed $144,500 CNYIS
- 2021-12-04 Listing Removed — CNYIS
- 2021-07-23 Price Changed $139,900 CNYIS
- 2021-06-04 Listed $154,900 CNYIS
Property tax history
+1.7%/yrLatest (2025): $4,509 · -1.3% YoY. Source: county tax records.
Cash-flow waterfall
monthlySold comps — $/sqft
last 12 mo · ≤1 miLoading sold comps…