 Multi-family
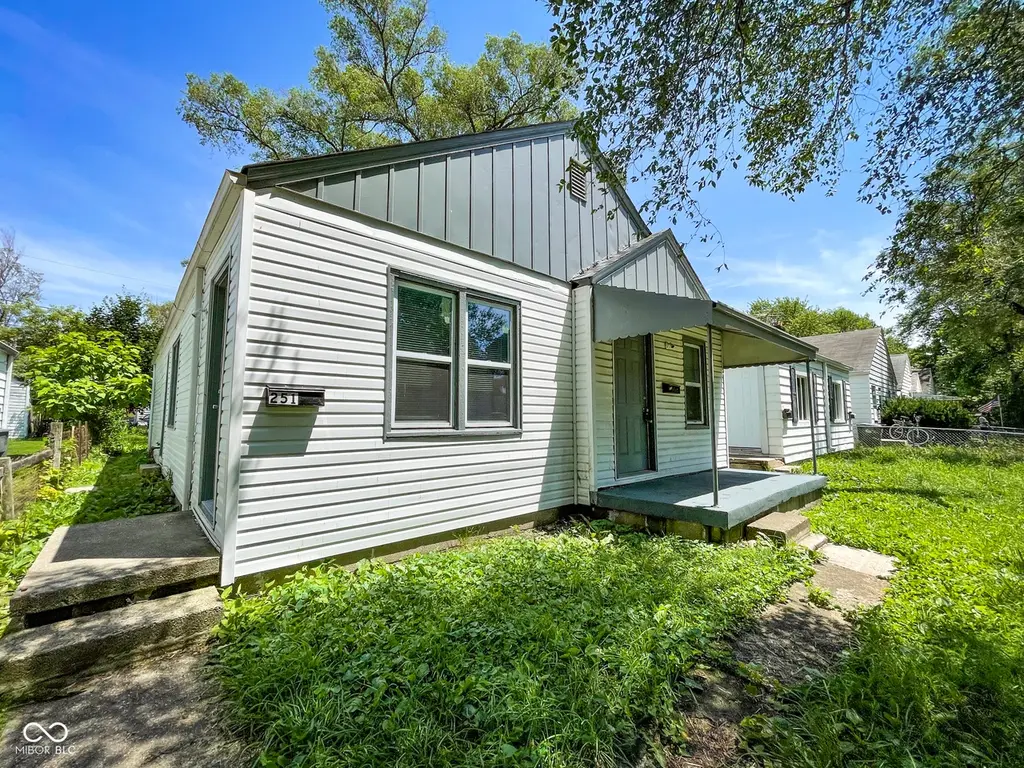
251 S Dearborn St · Indianapolis city (balance), IN
Flood risk 1/10 · Minimal
- FEMA flood zone
- X (unshaded)
- Chance of flooding over 30 yrs
- 0.0%
- Est. flood insurance / yr
- $507 – $1,088
Fire risk 1/10 · Minimal
- Est. fire insurance / yr
- $717 – $1,331
Heat risk 4/10 · Minor
- Hot days now (above 101°F)
- 7 days/yr
- Hot days in 30 yrs
- 19 days/yr
Wind risk 2/10 · Minimal
- Chance of severe wind over 30 yrs
- 1.0%
Air-quality risk 4/10 · Minor
- Unhealthy air days now
- 5 days/yr
- Unhealthy air days in 30 yrs
- 7 days/yr
Risk factors via First Street. Map © Google.
Why this score? — see what drove the C grade
The composite is a weighted blend of 9 inputs, each scored 0–100. Each bar is that input's sub-score; the figure is the points it added to the 100-point composite (weight × sub-score).
- Cash flow +21.9/30.0
- ARV discount +10.8/15.0
- DSCR +7.0/10.0
- 1% rule +6.2/10.0
- Rent growth +4.3/5.0
- Livability +2.5/5.0
- Condition / age +2.5/5.0
- Schools +1.4/10.0
- Appreciation +0.0/10.0
$145,000
🖨 Deal sheet 📄 Offer letter ✓ Due diligence
Multi-family units
County records classify this as Multi-Family (2-4 Unit). Listing-text estimate: 1 unit. estimate disagrees with records
Listing remarks MLS
Recently renovated, including roof, duplex. Previous leases were $650/side for a total of $1,300/month in rent.
Key facts
- Renovated duplex
- Refreshed bathroom
- Prime location
Tags
Property features AI
Finance
- Other: Total of 2 units; Unit rents listed as $699/month and $740/month
- Financial info: Gross monthly income reported as $1,439; Reported expenses $0
Exterior
- Parking: Detached 2-car garage
- Utilities: No solid waste service listed
- Home design: Duplex residential income property; One story
- Exterior features: Residential use; Access road; Lot under 1/4 acre
Interior
- Kitchen: Each unit has a 10x10 kitchen
- Bedrooms: Two 1-bedroom units
- Interior features: One-level units
Neighborhood map
What this means for you Summary
Snapshot
- This is a 1-bed/3.0-bath multifamily listed at $145k.
Deal economics
- At list price, monthly cash flow is $227 ($3k/yr) — positive.
- The deal already cash-flows at list — no discount required.
- Meets the 1% rule at list price ($2k rent vs $145k).
- Recommended offer: $141k (3.0% below list) — sets the bar for market timing.
- Cap rate 8.2% vs local median 4.4% in Indianapolis city (balance) — top-decile yield for the area; either an underpriced asset or a hidden risk that comps aren't pricing in. Stress-test before assuming the spread holds.
Location & tenants
- Location reads: area grade C — affects rentability + tenant quality, not the cash-flow math above.
- Indianapolis Public Schools (urban): math 14% / reading 20% proficiency, ranked #286 of 301 in IN (top 95%) — low school quality limits family demand, transient renter base, plan for 1-2y turnover; 77% free/reduced lunch — lower-income household profile, screen leases tightly.
- Market conditions: Rents rising fast (+7.3%/yr); 480 active listings in the ZIP; 40 comparable units currently listed for rent nearby; rentals at typical pace (median 24d on market — plan ~3-4 weeks tenant-placement turnaround); 48% of comp listings sitting > 30 days — soft ceiling on asking rent; 1,906 units permitted in Marion County in 2024 (621 in 5+ unit buildings).
- This rent runs 40% of the median local income ($49k/yr) — at the standard rent-burdened threshold; future hikes will face affordability resistance.
Forward outlook
- Local home prices are declining (-3.0%/yr); year-one equity from $1k of loan paydown is wiped out by about $4k of value loss. Plan a longer hold.
- Marion County population projected at +18% by 2050 — long-run rental-demand tailwind backs the buy-and-hold thesis.
- At projected returns (-3.0% appreciation + 7.3% rent growth), your $41k cash investment doubles in ~9 years — after that, you're playing with house money.
Negotiation context
- It's been on market 52 days — a 3% lower offer ($141k) is reasonable based on typical stale-listing flexibility.
- 6 sale attempts since 12y ago with the ask held roughly flat each time — persistent listings suggest the price (not the market) is what's stuck; bring a comps-based counter.
- Current owner paid $120k; 21% above their basis — modest negotiation headroom, anchor on the comps not their cost.
Risks & watch-outs
- Watch-outs: built in 1943 — expect roof / HVAC / electrical / plumbing capex.
Questions for the listing agent
- It's been on market 52 days. Have you received any prior offers? Is the seller open to a 3% concession, seller financing, or rate buy-down credit?
- Built in 1943 — when were the roof, HVAC, electrical panel, plumbing, and water heater last replaced?
- Is there a deadline driving the sale (1031 exchange, divorce, estate, relocation)? That informs how much negotiation room exists.
- What's the average days-on-market for RENTAL listings here right now (not sales)? A rising rental-DOM trend means longer vacancies and softer asking-rent achievability than the comps imply.
- What's the recent tenant-quality profile in this submarket — average credit score on applications, eviction rate, late-payment / NSF rate, and stable-employment percentage? A property-management company in the area should have these aggregated.
- How much new apartment / multifamily construction is in the pipeline within 1–3 miles? Heavy new supply (>2% of stock underway) typically softens rents 12–24 months out; light construction supports rent growth.
Investment metrics
- 1% rule
- 1.12% ✓
- Cap rate
- 8.17%
- Cash-on-cash
- 6.72%
- DSCR
- 1.30
- GRM
- 7.4
CMA / ARV
- ARV (median comp)
- $156,628
- List price
- $145,000
- Delta
- -7.42%
- Verdict
- FAIR
- Comps
- 20 within 1.0 mi
Projected returns pro-forma
-3.0% appreciation · 7.31% rent growth · sell at horizon
- IRR
- -1.0%
- Equity multiple
- 0.96×
- Total profit
- $-1,600
- Equity at exit
- $21,620
- IRR
- 12.9%
- Equity multiple
- 2.24×
- Total profit
- $50,508
- Equity at exit
- $12,537
Cash invested: $40,600 (down + closing). Projections, not guarantees.
Landlord ↔ Tenant lean methodology
- Overall (STATE)
- 90 Strongly Landlord-Friendly
- State Indiana
- 90 Strongly Landlord-Friendly · R+11
- County
- — inherits STATE
- City
- — inherits STATE
ZIP-level market 46201
- Home prices YoY
- -33.9%
- Rents YoY
- 7.3%
- Active inventory
- 480
- Price-to-rent
- 14.9×
Monthly cashflow live
- Estimated rent
- $1,627 medium interval (Pro) →
- Mortgage (P&I)
- −$760
- Tax from tax record
- −$237 /mo · $2,847/yr
- Insurance
- −$60
- HOA
- −$0
- Vacancy / Maint / Mgmt
- −$342
- Net cashflow
- $227
Break-even live
2-unit breakdown (identical units grouped — click to expand)
| Units | Beds | Baths | Est. rent |
|---|---|---|---|
| 2× units | 1 | 1 | $1,626 |
| #1 | 1 | 1 | $813 |
| #2 | 1 | 1 | $813 |
| Total (2 units) | $1,627 | ||
UW: 25.0% down · 7.5% · 30yr · 1.5% tax · 5.0% vac · 8.0% maint · 8.0% mgmt
Financing live
Cash to close
- Down payment
- $36,250
- Closing costs
- $4,350
- Reserves months
- —
- Total cash needed
- —
Loan-product check · same deal, 3 products live
Conventional
25% down · 7.5% · 30yr
- Down + closing
- —
- Monthly P&I
- —
- Monthly cashflow
- —
- DSCR
- —
- Eligible?
- —
Personal DTI + credit; lowest rate.
DSCR
20% down · 8.5% · 30yr
- Down + closing
- —
- Monthly P&I
- —
- Monthly cashflow
- —
- DSCR
- —
- Eligible?
- —
No personal income docs; deal must DSCR.
Hard money
10% down · 12.0% · 12mo
- Down + closing
- —
- Monthly P&I
- —
- Monthly cashflow
- —
- DSCR
- —
- Eligible?
- —
Short-term bridge; refi at stabilization.
Rent comps 40 comps
| Address | Beds | Baths | Sqft | Rent | $/sqft | DOM | Units | Dist |
|---|---|---|---|---|---|---|---|---|
| 3022 English Ave Unit 3022 Indianapolis, IN | 2.0 | 1.0 | 600 | $650 | $1.08 | 44d | 1 | 0.32mi |
| 49 S Rural St Indianapolis, IN | 2.0 | 1.5 | 750 | $950 | $1.27 | 11d | 1 | 0.39mi |
| 37 S Sherman Dr Indianapolis, IN | 1.0 | 1.0 | 700 | $800 | $1.14 | 24d | 1 | 0.51mi |
| 415 N Oxford St Indianapolis, IN | 1.0 | 1.0 | 580 | $650 | $1.12 | 24d | 1 | 0.68mi |
| 320 N Sherman Dr Indianapolis, IN | — | 1.0 | 750 | $525 | $0.70 | 44d | 1 | 0.72mi |
| 320 N Sherman Dr Unit A Indianapolis, IN | — | 1.0 | 450 | $525 | $1.17 | 4d | 1 | 0.72mi |
| 412 N Bradley Ave Unit 3 Indianapolis, IN | 2.0 | 1.0 | 700 | $950 | $1.36 | 24d | 1 | 0.82mi |
| 2034 Southeastern Ave Indianapolis, IN | 1.0 | 1.0 | 525 | $850 | $1.62 | 15d | 1 | 0.86mi |
| 2025 Southeastern Ave Indianapolis, IN | 1.0 | 1.0 | 663 | $775 | $1.17 | 44d | 1 | 0.88mi |
| 2211 E New York St Unit B Indianapolis, IN | 1.0 | 1.0 | 650 | $725 | $1.12 | 22d | 1 | 0.88mi |
| 628 N Oxford St Indianapolis, IN | 1.0 | 1.0 | 536 | $775 | $1.45 | 24d | 1 | 0.95mi |
| 423 Villa Ave Indianapolis, IN | 1.0 | 1.0 | 593 | $799 | $1.35 | 24d | 1 | 0.95mi |
| 245 S Randolph St Indianapolis, IN | 2.0 | 1.0 | 720 | $750 | $1.04 | 44d | 1 | 0.98mi |
| 247 S Randolph St Indianapolis, IN | 2.0 | 1.0 | 720 | $750 | $1.04 | 44d | 1 | 0.98mi |
| 1718 Southeastern Ave Indianapolis, IN | 1.0 | 1.0 | 700 | $1,080 | $1.54 | 44d | 1 | 1.06mi |
| 1022 S Churchman Ave Unit 1024 Indianapolis, IN | 1.0 | 1.0 | 350 | $895 | $2.56 | 44d | 1 | 1.07mi |
| 1912 Lexington Ave Unit 1910B Indianapolis, IN | 1.0 | 1.0 | 660 | $850 | $1.29 | 44d | 1 | 1.10mi |
| 1912 Lexington Ave Unit 1912A Indianapolis, IN | — | 1.0 | 660 | $825 | $1.25 | 44d | 1 | 1.10mi |
| 821 N Bradley Ave Indianapolis, IN | 1.0 | 1.0 | 663 | $850 | $1.28 | 4d | 1 | 1.10mi |
| 648 Dayton Ave Indianapolis, IN | 1.0 | 1.0 | 450 | $750 | $1.67 | 15d | 1 | 1.15mi |
| 4741 E Washington St Indianapolis, IN | 1.0 | 1.0 | 700 | $950 | $1.36 | 22d | 1 | 1.16mi |
| 815 Dawson St Unit 2 Indianapolis, IN | 2.0 | 1.0 | 600 | $1,300 | $2.17 | 4d | 1 | 1.18mi |
| 4815 E Washington St Unit 4815-12 Indianapolis, IN | 1.0 | 1.0 | 700 | $950 | $1.36 | 44d | 1 | 1.23mi |
| 4815 E Washington St Unit 4815-10 Indianapolis, IN | 1.0 | 1.0 | 600 | $950 | $1.58 | 22d | 1 | 1.23mi |
| 4815 E Washington St Unit 4815-04 Indianapolis, IN | 1.0 | 1.0 | 600 | $895 | $1.49 | 44d | 1 | 1.23mi |
| 621 Tecumseh St Indianapolis, IN | 2.0 | 1.0 | 726 | $1,025 | $1.41 | 44d | 1 | 1.24mi |
| 833 N Gladstone Ave Indianapolis, IN | 1.0 | 1.0 | 687 | $825 | $1.20 | 24d | 1 | 1.25mi |
| 679 Woodruff Place East Dr Indianapolis, IN | 1.0 | 1.0 | 600 | $895 | $1.49 | 24d | 1 | 1.26mi |
| 927 N Chester Ave Indianapolis, IN | 1.0 | 1.0 | 596 | $750 | $1.26 | 44d | 1 | 1.26mi |
| 1028 N Olney St Unit 1030 Indianapolis, IN | 1.0 | 1.0 | 700 | $800 | $1.14 | 24d | 1 | 1.26mi |
| 1036 N Tuxedo St Indianapolis, IN | 1.0 | 1.0 | 646 | $750 | $1.16 | 4d | 1 | 1.27mi |
| 471 N State Ave Unit 1 Indianapolis, IN | 1.0 | 1.0 | 634 | $785 | $1.24 | 44d | 1 | 1.29mi |
| 1023 S State Ave Indianapolis, IN | 1.0 | 1.0 | 600 | $1,099 | $1.83 | 24d | 1 | 1.30mi |
| 1114 N Dearborn St Indianapolis, IN | 1.0 | 1.0 | 646 | $795 | $1.23 | 44d | 1 | 1.31mi |
| 896 N Gladstone Ave Indianapolis, IN | 1.0 | 1.0 | 580 | $775 | $1.34 | 44d | 1 | 1.31mi |
| 1106 N Gale St Unit 3 Indianapolis, IN | — | 1.0 | 400 | $650 | $1.62 | 4d | 1 | 1.31mi |
| 1106 N Gale St Unit 1 Indianapolis, IN | 2.0 | 1.0 | 750 | $895 | $1.19 | 44d | 1 | 1.31mi |
| 1413 Washington St Indianapolis, IN | — | 1.0 | 350 | $800 | $2.29 | 44d | 1 | 1.33mi |
| 4926 E Washington St Apt 5 Indianapolis, IN | 1.0 | 1.0 | 700 | $895 | $1.28 | 44d | 1 | 1.34mi |
| 332 N Arsenal Ave Unit A Indianapolis, IN | 2.0 | 1.0 | 750 | $1,150 | $1.53 | 8d | 1 | 1.36mi |
Listing history 27 events
-
2026-06-18days on market $145,000 Active 52 DOM
-
2026-06-17days on market $145,000 Active 51 DOM
-
2026-06-16days on market $145,000 Active 50 DOM
-
2026-06-15days on market $145,000 Active 49 DOM
-
2026-06-13days on market $145,000 Active 47 DOM
-
2026-06-13days on market $145,000 Active 46 DOM
-
2026-06-09days on market $145,000 Active 43 DOM
-
2026-06-08days on market $145,000 Active 42 DOM
-
2026-06-07days on market $145,000 Active 41 DOM
-
2026-06-03days on market $145,000 Active 37 DOM
-
2026-06-02days on market $145,000 Active 36 DOM
-
2026-06-01days on market $145,000 Active 35 DOM
-
2026-05-31price $145,000 Active 34 DOM
-
2026-05-31days on market $150,000 Active 34 DOM
-
2026-05-18status Active 949-char remark
-
2026-05-18status Pending 949-char remark
-
2026-04-27$150,000 Active 949-char remark
-
2025-05-02historical $740
-
2025-02-27$750
-
2022-12-11historical
-
2021-06-18soldstatus $119,900 Closed 111-char remark
Show marketing remark (111 chars)
Recently renovated, including roof, duplex. Previous leases were $650/side for a total of $1,300/month in rent.
-
2021-06-05status Pending 111-char remark
Show marketing remark (111 chars)
Recently renovated, including roof, duplex. Previous leases were $650/side for a total of $1,300/month in rent.
-
2021-06-03$119,900 Active 111-char remark
Show marketing remark (111 chars)
Recently renovated, including roof, duplex. Previous leases were $650/side for a total of $1,300/month in rent.
-
2020-02-24historical
-
2019-12-31$44,900
-
2014-10-16historical
-
2014-06-09$9,500
ⓘ Source: listings_history table (triggers on properties + properties_extension) + one-shot
backfill from property_details.listing_events for pre-trigger history.
Tax reassessment forecast IN · Partial reset (capped growth)
- Current annual tax
- $2,847 · $237/mo
- Projected year-2 tax
- $2,847 · $237/mo
- Expected delta
- $0/yr ($0/mo · 0.0%)
ⓘ Screening estimate from a state-policy table — verify with the county assessor before closing.
Climate risk First Street
- Flood 1/10 Low FEMA zone X (unshaded) · 0% chance over 30 yrs
- Wildfire 1/10 Low
- Heat 4/10 Moderate 7 d/yr ≥101°F today · 19 d/yr by 30 yrs out
- Wind 2/10 Low 100% chance of damaging wind over 30 yrs
- Air quality 4/10 Moderate 5 unhealthy d/yr today · 7 by 30 yrs out
Nearby sold comps map
Loading sold comps map…
Walkable amenities ~0.75 mi
Loading nearby amenities…
Taxation est. · year 1
- Rental income
- $19,524
- − Mortgage interest
- −$8,122
- − Property taxes
- −$2,847
- − Insurance
- −$725
- − Repairs & maintenance
- −$1,562
- − Management
- −$1,562
- − Depreciation
- −$4,218
- Taxable income
- $488
- Est. tax owed @ 24.0%
- −$117
- After-tax cash flow
- $2,610/yr
For passive investors: Depreciation is non-cash, so a rental often shows a tax loss while cash-flowing — sheltering income. Rental losses are passive: they offset passive income freely, and up to $25,000/yr can offset ordinary (W-2) income if you actively participate and your MAGI is under $100k (phasing out to $0 by $150k); unused losses carry forward. On sale, claimed depreciation is recaptured at up to 25%, and gains may owe capital-gains tax (a 1031 exchange can defer both). Figures are a year-1 estimate at your 24.0% rate — not tax advice; consult a CPA.
Schools (NCES district)
- District
- Indianapolis Public Schools
- NCES district ID
- 1804770
- Math proficiency
- 14% ▼ -7.00%
- Reading proficiency
- 20% ▼ -3.00%
- Median HH income
- $32,034
- Composite
- 13.69/100
- National rank
- #9499
- State rank
- #286 of 301 in IN
Livability — Indianapolis city (balance)
No livability data for this city. (Only ~50 U.S. cities are tracked.)
Census & demographics
- Census place
- Indianapolis city (balance), IN
- County
- Marion County · 998,460 people
- City population
- 881,119
- Metro
- Indianapolis-Carmel-Anderson, IN
- Population (ZIP)
- 30,335
- Household income
- $49,195
- Rent vs Own
- Severe rent burden
- 1906.0
Population outlook (Marion County) Hauer SSP2
- Today (2025)
- 1,025,572 people
- By 2030
- 1,065,727 · +3.9%
- By 2040
- 1,141,577 · +11.3%
- By 2050
- 1,208,920 · +17.9%
- By 2075
- 1,367,288 · +33.3%
- By 2100
- 1,438,201 · +40.2%
Race, ethnicity, and origin ACS 2023
- Neighborhood character
- Diverse neighborhood (Simpson 0.63)
- Race & ethnicity
- White 53% Hispanic / Latino 23% Black 18% Two or more races 9%
- Hispanic origin (detail)
- Mexican 14% Puerto Rican 2%
- Common ancestry
- Slovak 2% Lithuanian 2% Italian 1%
- Foreign-born
- 9% · Canada
- Languages at home
- 81% English-only · Spanish 17%
Political lean MEDSL · Marion
- 2024 margin
- Strong D (+27.7) · D 63.0% · R 35.3% · Other 1.7%
- 2008→2024 swing
- -0.7pp no change · 2008: 28.4pp · 2024: 27.7pp
- All cycles
- 2024: D+27.7 2020: D+29.1 2016: D+22.8 2012: D+22.2 2008: D+28.4
Not yet ingested
- Civics
- —
Market trends
- HPI YoY
- ▼ -192.51%
- Current HPI
- 375.0969
- Rent YoY
- ▲ 7.31%
- Metro
- Indianapolis-Carmel-Anderson, IN
- State GDP YoY
- ▲ 2.90%
- F500 in state
- 18
Industry mix (Fortune 500 HQ in IN)
| Industry | F500 HQs | Revenue |
|---|---|---|
| Industrial Machinery | 2 | $37B |
|
||
| Healthcare | 1 | $177B |
|
||
| Pharmaceuticals | 1 | $45B |
|
||
| Metals / Steel | 1 | $18B |
|
||
| Agriculture | 1 | $17B |
|
||
| Packaging | 1 | $12B |
|
||
Price history
+1426.3% since first listed14 events — show timeline
- 2026-05-31 Price Changed $145,000 MIBOR as Distributed by MLS Grid
- 2026-05-18 Relisted — MIBOR as Distributed by MLS Grid
- 2026-05-18 Pending — MIBOR as Distributed by MLS Grid
- 2026-04-27 Listed $150,000 MIBOR as Distributed by MLS Grid
- 2025-05-02 Rental Removed $740 APPFOLIO
- 2025-02-27 Listed for Rent $750 APPFOLIO
- 2022-12-11 Rental Removed — RENT.
- 2021-06-18 Sold (MLS) $119,900 MIBOR as Distributed by MLS Grid
- 2021-06-05 Pending — MIBOR as Distributed by MLS Grid
- 2021-06-03 Listed $119,900 MIBOR as Distributed by MLS Grid
- 2020-02-24 Listing Removed — MIBOR as Distributed by MLS Grid
- 2019-12-31 Listed $44,900 MIBOR as Distributed by MLS Grid
- 2014-10-16 Listing Removed — MIBOR as Distributed by MLS Grid
- 2014-06-09 Listed $9,500 MIBOR as Distributed by MLS Grid
Property tax history
+21.5%/yrLatest (2025): $2,847 · -3.9% YoY. Source: county tax records.
Cash-flow waterfall
monthlySold comps — $/sqft
last 12 mo · ≤1 miLoading sold comps…