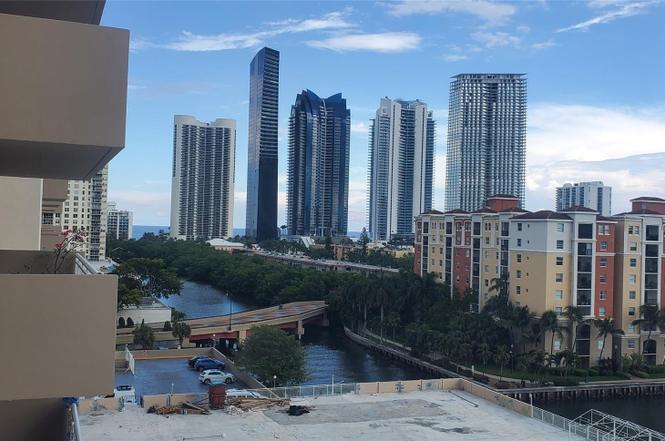
250 174th St #819 · Sunny Isles Beach, FL
Flood risk 9/10 · Severe
- FEMA flood zone
- AE
- Chance of flooding over 30 yrs
- 0.99%
- Est. flood insurance / yr
- $1,737 – $8,500
Fire risk 1/10 · Minimal
- Est. fire insurance / yr
- $947 – $1,759
Heat risk 10/10 · Severe
- Hot days now (above 103°F)
- 7 days/yr
- Hot days in 30 yrs
- 28 days/yr
Wind risk 10/10 · Severe
- Chance of severe wind over 30 yrs
- 99.0%
Air-quality risk 2/10 · Minimal
- Unhealthy air days now
- 1 days/yr
- Unhealthy air days in 30 yrs
- 2 days/yr
Risk factors via First Street. Map © Google.
Why this score? — see what drove the D+ grade
The composite is a weighted blend of 9 inputs, each scored 0–100. Each bar is that input's sub-score; the figure is the points it added to the 100-point composite (weight × sub-score).
- Cash flow +11.6/30.0
- ARV discount +7.5/15.0
- 1% rule +5.8/10.0
- Appreciation +5.3/10.0
- Livability +4.3/5.0
- Schools +4.2/10.0
- DSCR +3.4/10.0
- Rent growth +2.7/5.0
- Condition / age +2.5/5.0
$383,000
🖨 Deal sheet (PDF) 📄 Offer letter ✓ Due diligence
Listing remarks
Exceptional Views & Prime Sunny Isles LocationEnjoy wraparound skyline and Intracoastal views from this 8th-floor residence in the heart of Sunny Isles. This spacious 2bedroom, 2 bath unit offers 1,275 sq ft of living space—ready for your designer’s vision to transform it into a standout home with breathtaking vistas. Community amenities include a newly renovated pool with cabanas, billiard room, fitness center, sauna, and laundry facilities. Located directly across from the iconic A1A beach and just moments from top-tier restaurants, shopping, and boating access. Bonus: Assessment paid by seller.
Key facts
- Fitness center
- Sauna
- Intracoastal views
Tags
Property features AI
Finance
- Financial info: No land lease
- HOA & community: Has association; Monthly HOA fee; Association amenities include billiard room, fitness center, parking, pool, business center, community room, hobby room, and lobby; HOA covers maintenance of grounds and structure, pest control, sewer, trash, water, elevator, hot water, roof repairs, recreation facility, and pool service
Exterior
- Parking: 2 total parking spaces; 2 covered spaces; 2-car garage; Assigned parking; Detached carport; Detached garage
- Security: Secured garage/parking; Security guard; Fire alarm
- Utilities: Cable available; Water and sewer service included in association; Power available
- Home design: Condominium; Resale condition; Faces south; 23-story building
- Construction: Built with other construction materials
- Exterior features: Ocean access with one fixed bridge; Waterfront
Interior
- Kitchen: Dishwasher; Electric range; Microwave; Refrigerator
- Bedrooms: No main-level bedrooms reported
- Flooring: Marble floors
- Bathrooms: 2 full bathrooms
- Heating & cooling: Central heating; Other heating; Central air conditioning
- Interior features: Accessible elevator installed; Fire alarm; Secured garage/parking; Security guard; Unfurnished
- Laundry & utility: Hot water included in association amenities
Neighborhood map
What this means for you Summary
Snapshot
- This is a 2-bed/2.0-bath condo listed at $383k.
Deal economics
- At list price, monthly cash flow is $-548 ($-7k/yr) — negative.
- To cash-flow at today's rent, offer at most $286k (25.3% below list).
- Meets the 1% rule at list price ($4k rent vs $383k).
- Recommended offer: $286k (25.3% below list) — sets the bar for cash-flow.
- Cap rate 5.9% vs local median 0.8% in Sunny Isles Beach — top-decile yield for the area; either an underpriced asset or a hidden risk that comps aren't pricing in. Stress-test before assuming the spread holds.
Location & tenants
- Location reads 86/100 on livability (#20 in FL, #434 nationally) — a professional / high-income tenant draw. Strengths: schools A+, amenities A+, health & safety A+; Watch: housing C-, cost of living F.
- Miami-Dade (suburban): math 45% / reading 54% proficiency, ranked #40 of 73 in FL (top 55%) — families likely to look elsewhere, expect single-tenant / working-renter base with shorter leases; 64% free/reduced lunch — lower-income household profile, screen leases tightly.
- Market conditions: Rents flat; 1878 active listings in the ZIP; 4 comparable units currently listed for rent nearby; rentals leasing fast (median 6d on market — plan ~1-2 weeks tenant-placement turnaround); 10,051 units permitted in Miami-Dade County in 2024 (7,758 in 5+ unit buildings).
- At $4,120/mo this rent would consume 74% of the median local household income ($67k/yr) (locally 3106% of renters already pay >50% of income on rent) — very limited rent-growth headroom before tenants either downsize or default.
Forward outlook
- In year one you build about $5k of equity ($3k loan paydown + $2k appreciation (0.5% local appreciation)).
- Miami-Dade County population projected at +28% by 2050 — long-run rental-demand tailwind backs the buy-and-hold thesis.
- By year 7, paydown + projected appreciation supports a ~$34k cash-out refi (75% LTV) — recoverable capital for the next deal without selling this one.
Negotiation context
- It's been on market 102 days — a 9% lower offer ($349k) is reasonable based on typical stale-listing flexibility.
- 3 sale attempts since 2y ago with the ask held roughly flat each time — persistent listings suggest the price (not the market) is what's stuck; bring a comps-based counter.
- Current owner paid $275k; 39% above their basis — modest negotiation headroom, anchor on the comps not their cost.
Risks & watch-outs
- Watch-outs: flood insurance adds $427/mo.
- Climate carrying-cost: in FEMA flood zone AE (mandatory federal flood insurance); severe wind risk, 99% chance of damaging wind over 30y; extreme-heat days projected 7→28/yr by 2055 (HVAC capex compounding) — expect insurance premiums to compound above CPI over the hold.
Questions for the listing agent
- What do current leases actually rent for vs. the listed asking? Can we see a recent rent roll and the last 12 months of T-12 income?
- It's been on market 102 days. Have you received any prior offers? Is the seller open to a 25% concession, seller financing, or rate buy-down credit?
- Built in 1970 — when were the roof, HVAC, electrical panel, plumbing, and water heater last replaced?
- What's the actual annual flood-insurance premium (NFIP or private), and is the property in a SFHA with mandatory coverage?
- What does the HOA fee cover, when was the last increase, and are there any pending special assessments or reserve-fund shortfalls?
- Any open or pending special assessments — roof, HVAC, plumbing, elevator, façade? What's the per-unit balance and payoff schedule, and is the seller paying it off at close or rolling it to the buyer?
- Why hasn't it sold? Are there any deal-killer items the seller is aware of (foundation, flood, title, zoning, code violations)?
- Is there a deadline driving the sale (1031 exchange, divorce, estate, relocation)? That informs how much negotiation room exists.
- Schools are A-rated — typically a magnet for longer-tenancy family renters. What's the average tenant stay here, and is there a school-zone premium baked into asking?
- The area grade is low — what's the realistic commute time and amenity access for the typical tenant pool here? Any planned neighborhood developments (good or bad) we should know about?
- What's the average days-on-market for RENTAL listings here right now (not sales)? A rising rental-DOM trend means longer vacancies and softer asking-rent achievability than the comps imply.
- What's the recent tenant-quality profile in this submarket — average credit score on applications, eviction rate, late-payment / NSF rate, and stable-employment percentage? A property-management company in the area should have these aggregated.
- How much new apartment / multifamily construction is in the pipeline within 1–3 miles? Heavy new supply (>2% of stock underway) typically softens rents 12–24 months out; light construction supports rent growth.
Investment metrics
- 1% rule
- 1.08% ✓
- Cap rate
- 5.91%
- Cash-on-cash
- -1.36%
- DSCR
- 0.94
- GRM
- 7.7
CMA / ARV
No comps found within radius.
Projected returns pro-forma
0.53% appreciation · 0.94% rent growth · sell at horizon
- IRR
- -8.6%
- Equity multiple
- 0.59×
- Total profit
- $-44,120
- Equity at exit
- $121,408
- IRR
- -4.4%
- Equity multiple
- 0.52×
- Total profit
- $-51,850
- Equity at exit
- $154,347
Cash invested: $107,240 (down + closing). Projections, not guarantees.
Landlord ↔ Tenant lean methodology
- Overall (STATE)
- 87 Strongly Landlord-Friendly
- State Florida
- 87 Strongly Landlord-Friendly · R+3
- County
- — inherits STATE
- City
- — inherits STATE
ZIP-level market 33160
- Home prices YoY
- 0.2%
- Rents YoY
- 0.9%
- Active inventory
- 1878
- Price-to-rent
- 7.7×
Monthly cashflow live
- Estimated rent
- $4,120 medium interval (Pro) →
- Mortgage (P&I)
- −$2,008
- Tax from tax record
- −$466 /mo · $5,597/yr
- Insurance
- −$160
- Flood insurance flood zone
- −$427 /mo · $5,118/yr
- HOA
- −$742
- Vacancy / Maint / Mgmt
- −$865
- Net cashflow
- $-548
Break-even live
Sensitivity live
| Price | -10% $-331 | -5% $-440 | +0% $-548 | +5% $-656 | +10% $-765 |
|---|---|---|---|---|---|
| Rent | -10% $-874 | -5% $-711 | +0% $-548 | +5% $-385 | +10% $-223 |
| Rate | -1.0pp $-355 | -0.5pp $-451 | base $-548 | +0.5pp $-647 | +1.0pp $-748 |
UW: 25.0% down · 7.5% · 30yr · 1.5% tax · 5.0% vac · 8.0% maint · 8.0% mgmt
Financing live
Cash to close
- Down payment
- $95,750
- Closing costs
- $11,490
- Reserves months
- —
- Total cash needed
- —
Loan-product check · same deal, 3 products live
Conventional
25% down · 7.5% · 30yr
- Down + closing
- —
- Monthly P&I
- —
- Monthly cashflow
- —
- DSCR
- —
- Eligible?
- —
Personal DTI + credit; lowest rate.
DSCR
20% down · 8.5% · 30yr
- Down + closing
- —
- Monthly P&I
- —
- Monthly cashflow
- —
- DSCR
- —
- Eligible?
- —
No personal income docs; deal must DSCR.
Hard money
10% down · 12.0% · 12mo
- Down + closing
- —
- Monthly P&I
- —
- Monthly cashflow
- —
- DSCR
- —
- Eligible?
- —
Short-term bridge; refi at stabilization.
Rent comps 4 comps
| Address | Beds | Baths | Sqft | Rent | $/sqft | DOM | Units | Dist |
|---|---|---|---|---|---|---|---|---|
| 15701 Collins Ave Sunny Isles Beach, FL | 2.0–4.0 | 2.5–5.5 | 2387 | $19,800 | $8.29 | 19d | 8 | 1.11mi |
| 15701 Collins Ave Sunny Isles Beach, FL | 2.0–4.0 | 2.5–5.5 | 2387 | $19,000 | $7.96 | 6d | 8 | 1.11mi |
| 15701 Collins Ave Sunny Isles Beach, FL | 2.0–4.0 | 2.5–5.5 | 2325 | $18,000 | $7.74 | 3d | 9 | 1.11mi |
| 15701 Collins Ave Sunny Isles Beach, FL | 2.0–4.0 | 2.5–5.5 | 2387 | $19,000 | $7.96 | 3d | 8 | 1.11mi |
HOA detail condo
- Monthly dues
- $742 · $8,904/yr
- Likely covers
- poolgym
- Assessments
- None detected in remarks — confirm with the listing agent.
Listing history 22 events
-
2026-06-21days on market $383,000 Active 102 DOM
-
2026-06-18days on market $383,000 Active 99 DOM
-
2026-06-17days on market $383,000 Active 98 DOM
-
2026-06-16days on market $383,000 Active 97 DOM
-
2026-06-15days on market $383,000 Active 96 DOM
-
2026-06-13days on market $383,000 Active 94 DOM
-
2026-06-09days on market $383,000 Active 90 DOM
-
2026-06-08days on market $383,000 Active 89 DOM
-
2026-06-07days on market $383,000 Active 88 DOM
-
2026-06-04days on market $383,000 Active 85 DOM
-
2026-06-03days on market $383,000 Active 84 DOM
-
2026-06-02days on market $383,000 Active 83 DOM
-
2026-06-01days on market $383,000 Active 82 DOM
-
2026-05-31days on market $383,000 Active 81 DOM
-
2025-11-04$383,000 Active
-
2025-06-20historical
-
2025-01-20$383,000
-
2024-12-04historical
-
2024-06-17$429,000
-
2004-07-07soldstatus $275,000
-
2003-09-13soldstatus $215,000
-
2002-04-23soldstatus $157,000
ⓘ Source: listings_history table (triggers on properties + properties_extension) + one-shot
backfill from property_details.listing_events for pre-trigger history.
Tax reassessment forecast FL · Resets to sale price
- Current annual tax
- $5,597 · $466/mo
- Projected year-2 tax
- $5,597 · $466/mo
- Expected delta
- $0/yr ($0/mo · 0.0%)
ⓘ Screening estimate from a state-policy table — verify with the county assessor before closing.
Climate risk First Street
- Flood 9/10 Extreme FEMA zone AE · 99% chance over 30 yrs
- Wildfire 1/10 Low
- Heat 10/10 Extreme 7 d/yr ≥103°F today · 28 d/yr by 30 yrs out
- Wind 10/10 Extreme 99% chance of damaging wind over 30 yrs
- Air quality 2/10 Low 1 unhealthy d/yr today · 2 by 30 yrs out
Nearby sold comps map
Loading sold comps map…
Walkable amenities ~0.75 mi
Loading nearby amenities…
Taxation est. · year 1
- Rental income
- $49,443
- − Mortgage interest
- −$21,454
- − Property taxes
- −$5,597
- − Insurance
- −$7,034
- − Repairs & maintenance
- −$3,955
- − Management
- −$3,955
- − HOA
- −$8,904
- − Depreciation
- −$11,142
- Taxable loss
- −$12,598
- Est. tax savings @ 24.0%
- +$3,024
- After-tax cash flow
- $-3,553/yr
For passive investors: Depreciation is non-cash, so a rental often shows a tax loss while cash-flowing — sheltering income. Rental losses are passive: they offset passive income freely, and up to $25,000/yr can offset ordinary (W-2) income if you actively participate and your MAGI is under $100k (phasing out to $0 by $150k); unused losses carry forward. On sale, claimed depreciation is recaptured at up to 25%, and gains may owe capital-gains tax (a 1031 exchange can defer both). Figures are a year-1 estimate at your 24.0% rate — not tax advice; consult a CPA.
Schools (NCES district)
- District
- Miami-Dade
- NCES district ID
- 1200390
- Math proficiency
- 45% ▼ -16.00%
- Reading proficiency
- 54% ▼ -5.00%
- Median HH income
- $43,928
- Composite
- 41.76/100
- National rank
- #3397
- State rank
- #40 of 73 in FL
Livability — Sunny Isles Beach
- Score
- 86/100
- State rank
- #20
- US rank
- #434
Category grades
Schools grade is shown separately in the Schools card above.
Census & demographics
- Census place
- Sunny Isles Beach, FL
- County
- Miami-Dade County · 2,697,751 people
- Metro
- Miami-Fort Lauderdale-Pompano Beach, FL
- Population (ZIP)
- 43,718
- Household income
- $67,040
- Rent vs Own
- Severe rent burden
- 3106.0
Population outlook (Miami-Dade County) Hauer SSP2
- Today (2025)
- 3,126,439 people
- By 2030
- 3,325,765 · +6.4%
- By 2040
- 3,697,561 · +18.3%
- By 2050
- 4,012,134 · +28.3%
- By 2075
- 4,605,612 · +47.3%
- By 2100
- 4,866,598 · +55.7%
Race, ethnicity, and origin ACS 2023
- Neighborhood character
- Diverse neighborhood (Simpson 0.59)
- Race & ethnicity
- Hispanic / Latino 46% White 44% Two or more races 27% Black 4% Asian 2%
- Hispanic origin (detail)
- Mexican 1% Puerto Rican 3% Cuban 8% Dominican 1% Salvadoran 4%
- Common ancestry
- Scotch-Irish 8% Hispanic 3% Subsaharan African 3%
- Foreign-born
- 61% · Canada, Jamaica, Dominican Republic
- Languages at home
- 29% English-only · Spanish 45% Russian/Polish/Slavic 12% Other Indo-European 5%
Political lean MEDSL · Miami-Dade
- 2024 margin
- R (+11.4) · D 43.9% · R 55.4%
- 2008→2024 swing
- -27.6pp toward R · 2008: 16.1pp · 2024: -11.4pp
- All cycles
- 2024: R+11.4 2020: D+7.3 2016: D+29.6 2012: D+23.7 2008: D+16.1
Not yet ingested
- Civics
- —
Market trends
- HPI YoY
- ▲ 0.53%
- Current HPI
- 284.9293
- Rent YoY
- ▲ 0.94%
- Metro
- Miami-Fort Lauderdale-Pompano Beach, FL
- State GDP YoY
- ▲ 3.28%
- F500 in state
- 36
Industry mix (Fortune 500 HQ in FL)
| Industry | F500 HQs | Revenue |
|---|---|---|
| Industrial Technology | 2 | $29B |
|
||
| Insurance | 2 | $17B |
|
||
| Retail | 1 | $60B |
|
||
| Technology Distribution | 1 | $58B |
|
||
| Homebuilding | 1 | $35B |
|
||
| Technology Manufacturing | 1 | $35B |
|
||
Price history
+143.9% since first listed8 events — show timeline
- 2025-11-04 Listed $383,000 Beaches MLS
- 2025-06-20 Listing Removed — Beaches MLS
- 2025-01-20 Listed $383,000 Beaches MLS
- 2024-12-04 Listing Removed — Beaches MLS
- 2024-06-17 Listed $429,000 Beaches MLS
- 2004-07-07 Sold (Public Records) $275,000 Public Records
- 2003-09-13 Sold (Public Records) $215,000 Public Records
- 2002-04-23 Sold (Public Records) $157,000 Public Records
Property tax history
+4.6%/yrLatest (2025): $5,597 · -0.6% YoY. Source: county tax records.
Cash-flow waterfall
monthlySold comps — $/sqft
last 12 mo · ≤1 miLoading sold comps…