 Duplex
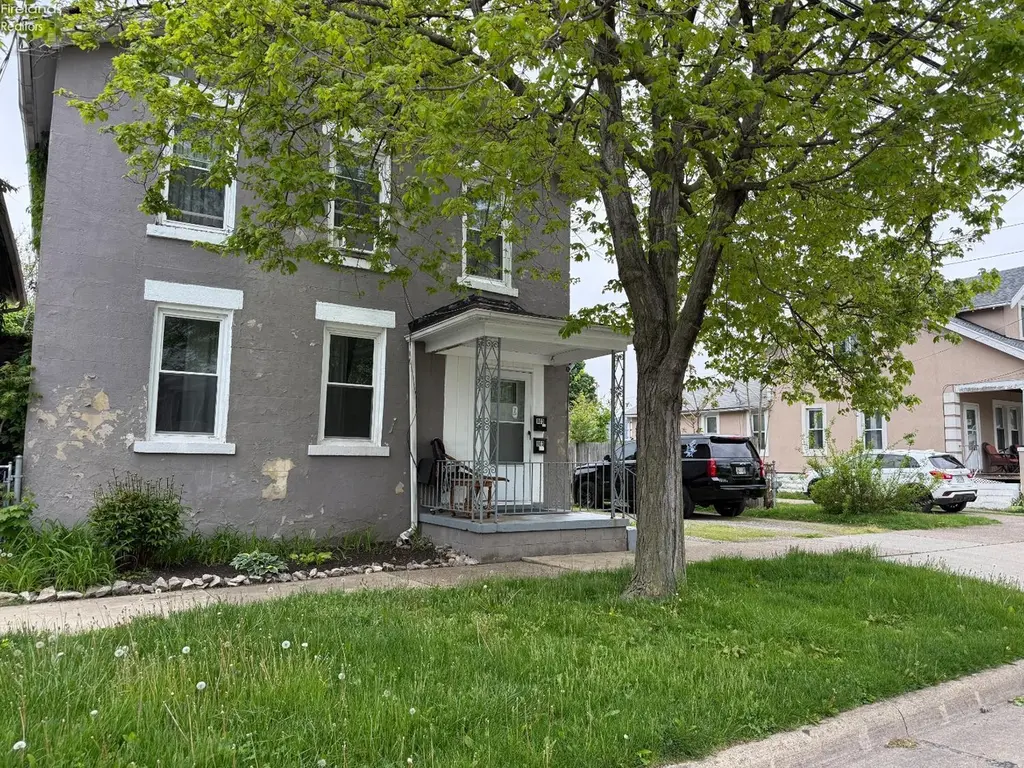
903 Franklin St · Sandusky, OH
Flood risk 1/10 · Minimal
- FEMA flood zone
- X (unshaded)
- Chance of flooding over 30 yrs
- 0.0%
- Est. flood insurance / yr
- $507 – $1,088
Fire risk 1/10 · Minimal
- Est. fire insurance / yr
- $713 – $1,323
Heat risk 3/10 · Minor
- Hot days now (above 94°F)
- 7 days/yr
- Hot days in 30 yrs
- 16 days/yr
Wind risk 2/10 · Minimal
- Chance of severe wind over 30 yrs
- —
Air-quality risk 2/10 · Minimal
- Unhealthy air days now
- 1 days/yr
- Unhealthy air days in 30 yrs
- 2 days/yr
Risk factors via First Street. Map © Google.
Why this score? — see what drove the B grade
The composite is a weighted blend of 9 inputs, each scored 0–100. Each bar is that input's sub-score; the figure is the points it added to the 100-point composite (weight × sub-score).
- Cash flow +30.0/30.0
- ARV discount +12.0/15.0
- 1% rule +10.0/10.0
- DSCR +10.0/10.0
- Livability +4.2/5.0
- Rent growth +2.5/5.0
- Schools +2.5/10.0
- Condition / age +2.5/5.0
- Appreciation +0.0/10.0
$141,900
🖨 Deal sheet (PDF) 📄 Offer letter ✓ Due diligence
Multi-family units
County records classify this as Multi-Family (2-4 Unit). Listing-text estimate: 2 units. confirmed
Listing remarks MLS
This charming 3 BR, 2 BA home with a bonus room upstairs that can be used as a kitchen or extra room or big closet. The home has a nice big backyard for your enjoyment. Home was previously used as two apartment but has been converted back to a single home.
Key facts
- 3,367 sq ft lot
- Built 1930
- Listed 41 days
Property features AI
Finance
- Other: Located in the Southwark Addition subdivision; Within the Sandusky school district
Exterior
- Parking: Off-street parking
- Utilities: Public water; Public sewer
- Home design: Multi-family residential income property; Multiple units
- Construction: Stucco exterior
- Exterior features: Asphalt roof
Interior
- Heating & cooling: Electric baseboard heating
- Interior features: Crawl space basement
Neighborhood map
What this means for you Summary
Snapshot
- This is a 1×2.0bd/1.0ba + 1×1.0bd/1.0ba units multifamily listed at $142k.
Deal economics
- At list price, monthly cash flow is $1k ($15k/yr) — positive. Per door: $624/mo.
- The deal already cash-flows at list — no discount required.
- Meets the 1% rule at list price ($3k rent vs $142k).
- Recommended offer: $138k (3.0% below list) — sets the bar for market timing.
- Cap rate 16.8% vs local median 6.0% in Sandusky — top-decile yield for the area; either an underpriced asset or a hidden risk that comps aren't pricing in. Stress-test before assuming the spread holds.
Location & tenants
- Location reads 83/100 on livability (#63 in OH, #929 nationally) — a professional / high-income tenant draw. Strengths: commute A+, cost of living A+, housing A+; Watch: crime D-, employment F.
- Sandusky City (town): math 24% / reading 37% proficiency, ranked #583 of 656 in OH (top 89%) — families likely to look elsewhere, expect single-tenant / working-renter base with shorter leases; 71% free/reduced lunch — lower-income household profile, screen leases tightly.
- Zoned schools: The Sandusky Intermediate School (math 26% / reading 38%, grade F, #1,135 of 1,584 statewide, top 73%, 909 students, 0% FRL); Sandusky Middle School (math 25% / reading 32%, grade F, #580 of 654 statewide, top 89%, 468 students, 0% FRL); Sandusky High School (math 17% / reading 41%, grade F, #627 of 781 statewide, top 81%, 1,004 students, 0% FRL) — zoned schools average 0% FRL vs 71% district-wide (71 pts lower); this property's tenant base skews higher-income than the district average.
- Market conditions: 212 active listings in the ZIP; 2 comparable units currently listed for rent nearby; 128 units permitted in Erie County in 2024 (5 in 5+ unit buildings).
- At $2,722/mo this rent would consume 53% of the median local household income ($62k/yr) (locally 1602% of renters already pay >50% of income on rent) — very limited rent-growth headroom before tenants either downsize or default.
Forward outlook
- Local home prices are declining (-3.0%/yr); year-one equity from $981 of loan paydown is wiped out by about $4k of value loss. Plan a longer hold.
- Erie County population projected at -15% by 2050 — secular population decline; favor cash flow + early exit over multi-decade hold.
- At projected returns (-3.0% appreciation + 3.0% rent growth), your $40k cash investment doubles in ~4 years — after that, you're playing with house money.
Negotiation context
- It's been on market 42 days — a 3% lower offer ($138k) is reasonable based on typical stale-listing flexibility.
- 2 sale attempts since 9y ago; this cycle's ask has dropped $8k (5%) from the opening price — seller is motivated, your offer sets the floor, not the list.
- Current owner paid $50k; list at $142k implies a 184% gain — meaningful room to come down on a strong offer.
Risks & watch-outs
- Watch-outs: built in 1930 — expect roof / HVAC / electrical / plumbing capex.
Questions for the listing agent
- It's been on market 42 days. Have you received any prior offers? Is the seller open to a 3% concession, seller financing, or rate buy-down credit?
- Can we see the unit-by-unit rent roll, current vacancy, and any below-market leases? What's the average tenancy length?
- What capital expenditures (roof, boiler, parking lot, exteriors) have been made in the last 5 years, and what's planned in the next 2?
- Built in 1930 — when were the roof, HVAC, electrical panel, plumbing, and water heater last replaced?
- Is there a deadline driving the sale (1031 exchange, divorce, estate, relocation)? That informs how much negotiation room exists.
- Crime grade is D in this area — have there been break-ins, vandalism, or insurance claims at this property in the last 3 years? What carrier currently insures it and at what premium?
- What's the average days-on-market for RENTAL listings here right now (not sales)? A rising rental-DOM trend means longer vacancies and softer asking-rent achievability than the comps imply.
- What's the recent tenant-quality profile in this submarket — average credit score on applications, eviction rate, late-payment / NSF rate, and stable-employment percentage? A property-management company in the area should have these aggregated.
- How much new apartment / multifamily construction is in the pipeline within 1–3 miles? Heavy new supply (>2% of stock underway) typically softens rents 12–24 months out; light construction supports rent growth.
Investment metrics
- 1% rule
- 1.92% ✓
- Cap rate
- 16.85%
- Cash-on-cash
- 37.70%
- DSCR
- 2.68
- GRM
- 4.3
CMA / ARV
- ARV (median comp)
- $157,711
- List price
- $141,900
- Delta
- -10.03%
- Verdict
- UNDERPRICED
- Comps
- 20 within 1.0 mi
Projected returns pro-forma
-3.0% appreciation · 3.0% rent growth · sell at horizon
- IRR
- 33.7%
- Equity multiple
- 2.42×
- Total profit
- $56,506
- Equity at exit
- $21,158
- IRR
- 40.6%
- Equity multiple
- 4.81×
- Total profit
- $151,553
- Equity at exit
- $12,269
Cash invested: $39,732 (down + closing). Projections, not guarantees.
Landlord ↔ Tenant lean methodology
- Overall (STATE)
- 73 Landlord-Friendly
- State Ohio
- 73 Landlord-Friendly · R+6
- County
- — inherits STATE
- City
- — inherits STATE
ZIP-level market 44870
- Active inventory
- 212
- Price-to-rent
- 7.3×
Monthly cashflow live
- Estimated rent
- $2,722 medium interval (Pro) →
- Mortgage (P&I)
- −$744
- Tax from tax record
- −$99 /mo · $1,185/yr
- Insurance
- −$59
- HOA
- −$0
- Lot rent
- −$0
- Vacancy / Maint / Mgmt
- −$572
- Net cashflow
- $1,248
Break-even live
Sensitivity live
| Price | -10% $1,329 | -5% $1,288 | +0% $1,248 | +5% $1,208 | +10% $1,168 |
|---|---|---|---|---|---|
| Rent | -10% $1,033 | -5% $1,141 | +0% $1,248 | +5% $1,356 | +10% $1,463 |
| Rate | -1.0pp $1,320 | -0.5pp $1,284 | base $1,248 | +0.5pp $1,212 | +1.0pp $1,174 |
2-unit breakdown (identical units grouped — click to expand)
| Units | Beds | Baths | Est. rent |
|---|---|---|---|
| 1× unit | 2.0 | 1 | $1,628 |
| 1× unit | 1.0 | 1 | $1,094 |
| Total (2 units) | $2,722 | ||
UW: 25.0% down · 7.5% · 30yr · 1.5% tax · 5.0% vac · 8.0% maint · 8.0% mgmt
Financing live
Cash to close
- Down payment
- $35,475
- Closing costs
- $4,257
- Reserves months
- —
- Total cash needed
- —
Loan-product check · same deal, 3 products live
Conventional
25% down · 7.5% · 30yr
- Down + closing
- —
- Monthly P&I
- —
- Monthly cashflow
- —
- DSCR
- —
- Eligible?
- —
Personal DTI + credit; lowest rate.
DSCR
20% down · 8.5% · 30yr
- Down + closing
- —
- Monthly P&I
- —
- Monthly cashflow
- —
- DSCR
- —
- Eligible?
- —
No personal income docs; deal must DSCR.
Hard money
10% down · 12.0% · 12mo
- Down + closing
- —
- Monthly P&I
- —
- Monthly cashflow
- —
- DSCR
- —
- Eligible?
- —
Short-term bridge; refi at stabilization.
Rent comps 2 comps
| Address | Beds | Baths | Sqft | Rent | $/sqft | DOM | Units | Dist |
|---|---|---|---|---|---|---|---|---|
| 1032 Perry St Sandusky, OH | 4.0 | 2.5 | 1845 | $850 | $0.46 | 46d | 1 | 0.25mi |
| 156 E Market St Sandusky, OH | 1.0–2.0 | 1.0–2.5 | 1266 | $3,539 | $2.79 | 46d | 5 | 0.59mi |
Listing history 24 events
-
2026-06-22days on market $141,900 Active 42 DOM
-
2026-06-21days on market $141,900 Active 41 DOM
-
2026-06-19days on market $141,900 Active 39 DOM
-
2026-06-18days on market $141,900 Active 38 DOM
-
2026-06-17price $141,900 Active 37 DOM
-
2026-06-17days on market $144,400 Active 37 DOM
-
2026-06-16days on market $144,400 Active 36 DOM
-
2026-06-15days on market $144,400 Active 35 DOM
-
2026-06-14days on market $144,400 Active 33 DOM
-
2026-06-12days on market $144,400 Active 32 DOM
-
2026-06-09days on market $144,400 Active 29 DOM
-
2026-06-08days on market $144,400 Active 28 DOM
-
2026-06-07days on market $144,400 Active 27 DOM
-
2026-06-03pricedays on market $144,400 Active 23 DOM
-
2026-06-02days on market $149,900 Active 22 DOM
-
2026-06-01days on market $149,900 Active 21 DOM
-
2026-05-31days on market $149,900 Active 20 DOM
-
2026-05-30days on market $149,900 Active 19 DOM
-
2026-05-12$149,900 Active 873-char remark
-
2026-05-07historical $149,900 873-char remark
-
2018-07-10soldstatus $50,000 256-char remark
Show marketing remark (256 chars)
This charming 3 BR, 2 BA home with a bonus room upstairs that can be used as a kitchen or extra room or big closet. The home has a nice big backyard for your enjoyment. Home was previously used as two apartment but has been converted back to a single home.
-
2018-07-09soldstatus $50,000
-
2017-11-27$59,900 256-char remark
Show marketing remark (256 chars)
This charming 3 BR, 2 BA home with a bonus room upstairs that can be used as a kitchen or extra room or big closet. The home has a nice big backyard for your enjoyment. Home was previously used as two apartment but has been converted back to a single home.
-
2000-10-23soldstatus $75,000
ⓘ Source: listings_history table (triggers on properties + properties_extension) + one-shot
backfill from property_details.listing_events for pre-trigger history.
Tax reassessment forecast OH · Partial reset (capped growth)
- Current annual tax
- $1,185 · $99/mo
- Projected year-2 tax
- $1,700 · $142/mo
- Expected delta
- +$514/yr (+$43/mo · 43.4%)
ⓘ Screening estimate from a state-policy table — verify with the county assessor before closing.
Climate risk First Street
- Flood 1/10 Low FEMA zone X (unshaded) · 0% chance over 30 yrs
- Wildfire 1/10 Low
- Heat 3/10 Moderate 7 d/yr ≥94°F today · 16 d/yr by 30 yrs out
- Wind 2/10 Low
- Air quality 2/10 Low 1 unhealthy d/yr today · 2 by 30 yrs out
Nearby sold comps map
Loading sold comps map…
Walkable amenities ~0.75 mi
Loading nearby amenities…
Taxation est. · year 1
- Rental income
- $32,664
- − Mortgage interest
- −$7,949
- − Property taxes
- −$1,185
- − Insurance
- −$710
- − Repairs & maintenance
- −$2,613
- − Management
- −$2,613
- − Depreciation
- −$4,128
- Taxable income
- $13,466
- Est. tax owed @ 24.0%
- −$3,232
- After-tax cash flow
- $11,748/yr
For passive investors: Depreciation is non-cash, so a rental often shows a tax loss while cash-flowing — sheltering income. Rental losses are passive: they offset passive income freely, and up to $25,000/yr can offset ordinary (W-2) income if you actively participate and your MAGI is under $100k (phasing out to $0 by $150k); unused losses carry forward. On sale, claimed depreciation is recaptured at up to 25%, and gains may owe capital-gains tax (a 1031 exchange can defer both). Figures are a year-1 estimate at your 24.0% rate — not tax advice; consult a CPA.
Schools (NCES district)
- District
- Sandusky City
- NCES district ID
- 3904474
- Math proficiency
- 24% ▼ -17.00%
- Reading proficiency
- 37% ▼ -9.00%
- Median HH income
- $34,583
- Composite
- 25.1/100
- National rank
- #7532
- State rank
- #583 of 656 in OH
Livability — Sandusky
- Score
- 83/100
- State rank
- #63
- US rank
- #929
Category grades
Schools grade is shown separately in the Schools card above.
Census & demographics
- Census place
- Sandusky, OH
- County
- Erie County · 39,883 people
- City population
- 39,883
- Metro
- Sandusky, OH
- Population (ZIP)
- 39,883
- Household income
- $62,082
- Rent vs Own
- Severe rent burden
- 1602.0
Population outlook (Erie County) Hauer SSP2
- Today (2025)
- 73,204 people
- By 2030
- 71,341 · -2.5%
- By 2040
- 66,771 · -8.8%
- By 2050
- 62,512 · -14.6%
- By 2075
- 56,154 · -23.3%
- By 2100
- 49,045 · -33.0%
Race, ethnicity, and origin ACS 2023
- Neighborhood character
- Predominantly White (72%)
- Race & ethnicity
- White 72% Black 15% Two or more races 8% Hispanic / Latino 5%
- Common ancestry
- Romanian 3% Slovak 2% Subsaharan African 1%
- Foreign-born
- 1% · Canada
- Languages at home
- 96% English-only · Spanish 2%
Political lean MEDSL · Erie
- 2024 margin
- R (+14.1) · D 42.5% · R 56.6%
- 2008→2024 swing
- -28.0pp toward R · 2008: 13.9pp · 2024: -14.1pp
- All cycles
- 2024: R+14.1 2020: R+11.6 2016: R+9.8 2012: D+11.3 2008: D+13.9
Not yet ingested
- Civics
- —
Market trends
- HPI YoY
- ▼ -151.99%
- Current HPI
- 209.6383
- Rent YoY
- —
- Metro
- Sandusky, OH
- State GDP YoY
- ▲ 1.98%
- F500 in state
- 48
Industry mix (Fortune 500 HQ in OH)
| Industry | F500 HQs | Revenue |
|---|---|---|
| Insurance | 3 | $145B |
|
||
| Industrial Machinery | 3 | $49B |
|
||
| Financial Services | 3 | $24B |
|
||
| Consumer Goods | 2 | $93B |
|
||
| Aerospace / Defense | 2 | $47B |
|
||
| Utilities | 2 | $33B |
|
||
Price history
+89.2% since first listed8 events — show timeline
- 2026-06-17 Price Changed $141,900 FAOR
- 2026-06-03 Price Changed $144,400 FAOR
- 2026-05-12 Listed $149,900 FAOR
- 2026-05-07 Coming Soon $149,900 FAOR
- 2018-07-10 Sold (MLS) $50,000 FAOR
- 2018-07-09 Sold (Public Records) $50,000 Public Records
- 2017-11-27 Listed $59,900 FAOR
- 2000-10-23 Sold (Public Records) $75,000 Public Records
Property tax history
-0.2%/yrLatest (2025): $1,185 · -1.0% YoY. Source: county tax records.
Cash-flow waterfall
monthlySold comps — $/sqft
last 12 mo · ≤1 miLoading sold comps…