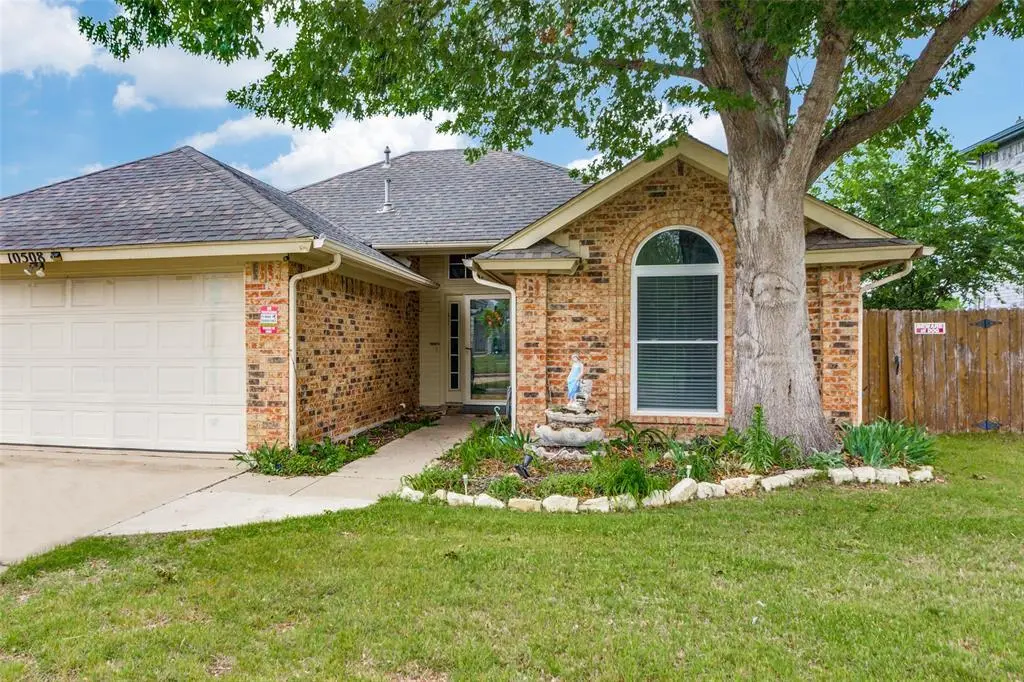
10508 Maria Dr · Fort Worth, TX
Flood risk 1/10 · Minimal
- FEMA flood zone
- X (unshaded)
- Chance of flooding over 30 yrs
- 0.0%
- Est. flood insurance / yr
- $507 – $1,088
Fire risk 5/10 · Moderate
- Est. fire insurance / yr
- $1,222 – $2,270
Heat risk 7/10 · Major
- Hot days now (above 108°F)
- 7 days/yr
- Hot days in 30 yrs
- 23 days/yr
Wind risk 4/10 · Minor
- Chance of severe wind over 30 yrs
- 21.0%
Air-quality risk 3/10 · Minor
- Unhealthy air days now
- 3 days/yr
- Unhealthy air days in 30 yrs
- 4 days/yr
Risk factors via First Street. Map © Google.
Why this score? — see what drove the D grade
The composite is a weighted blend of 9 inputs, each scored 0–100. Each bar is that input's sub-score; the figure is the points it added to the 100-point composite (weight × sub-score).
- ARV discount +15.0/15.0
- Cash flow +8.9/30.0
- Livability +4.0/5.0
- 1% rule +3.9/10.0
- Schools +3.5/10.0
- DSCR +2.5/10.0
- Rent growth +2.5/5.0
- Condition / age +2.5/5.0
- Appreciation +0.0/10.0
$215,000
🖨 Deal sheet (PDF) 📄 Offer letter ✓ Due diligence
Listing remarks MLS
Charming home featuring split bedroom arrangement, tile floors, cozy fireplace and a very spacious backyard. The inviting backyard patio is covered by a wood pergola and there is lovely landscaping front and back. Windows have Energy Star rating and tilt in for easy cleaning. Trane HVAC, storm doors front & back, 2 blinds and a sprinkler system make this home efficient for cooling and heating.
Key facts
- Near schools
- Near shopping
- Large backyard
Tags
Property features AI
Finance
- Other: Excludes minerals, gas and oil rights
- Financial info: No second mortgage reported; Listing is For Sale
- HOA & community: No homeowners association
Exterior
- Parking: Two covered spaces; Driveway; Attached garage with 2 garage spaces and a garage that faces the front (2-car single door)
- Utilities: City water; City sewer; Not in a municipal utility district
- Home design: Single-family residence; One story
- Construction: Built in 1988
- Exterior features: Lot under 0.5 acre (approx. 0.195 acres); Subdivision: Chapel Creek Ranch Add
Interior
- Kitchen: Dishwasher; Garbage disposal; Electric range; Microwave
- Bedrooms: Three bedrooms (all on the main level); Primary bedroom on the main level
- Bathrooms: Two full bathrooms
- Interior features: Cable TV available; One living area; One dining area; Total of 6 rooms; Living room fireplace
Neighborhood map
What this means for you Summary
Snapshot
- This is a 3-bed/2.0-bath single-family listed at $215k.
Deal economics
- At list price, monthly cash flow is $-173 ($-2k/yr) — negative.
- To cash-flow at today's rent, offer at most $184k (14.2% below list).
- To meet the 1% rule (rent ≥ 1% of price), the offer needs to be $191k (11.4% below list).
- Recommended offer: $184k (14.2% below list) — sets the bar for cash-flow.
- Cap rate 5.3% vs local median 3.9% in Fort Worth — top-decile yield for the area; either an underpriced asset or a hidden risk that comps aren't pricing in. Stress-test before assuming the spread holds.
Location & tenants
- Location reads 80/100 on livability (#49 in TX, #1,954 nationally) — a professional / high-income tenant draw. Strengths: amenities A+, cost of living A+, housing A+; Watch: crime F.
- White Settlement ISD (rural): math 35% / reading 44% proficiency, ranked #396 of 826 in TX (top 48%) — families likely to look elsewhere, expect single-tenant / working-renter base with shorter leases.
- Zoned schools: Blue Haze El (math 34% / reading 39%, grade F, #1,883 of 4,322 statewide, top 44%, 613 students, 56% FRL); Brewer Middle (math 33% / reading 48%, grade F, #637 of 1,662 statewide, top 39%, 1,047 students, 63% FRL); Brewer H S (math 25% / reading 45%, grade F, #954 of 1,632 statewide, top 59%, 2,183 students, 56% FRL).
- Market conditions: Rents soft (-0.2%/yr); 553 active listings in the ZIP; 40 comparable units currently listed for rent nearby; rentals at typical pace (median 26d on market — plan ~3-4 weeks tenant-placement turnaround); 45% of comp listings sitting > 30 days — soft ceiling on asking rent; solid renter incomes; 18,938 units permitted in Tarrant County in 2024 (8,336 in 5+ unit buildings).
Forward outlook
- Local home prices are declining (-3.0%/yr); year-one equity from $1k of loan paydown is wiped out by about $6k of value loss. Plan a longer hold.
- Tarrant County population projected at +41% by 2050 — long-run rental-demand tailwind backs the buy-and-hold thesis.
Negotiation context
- It's been on market 49 days — a 3% lower offer ($209k) is reasonable based on typical stale-listing flexibility.
- 3 sale attempts since 17y ago; this cycle's ask has dropped $70k (25%) from the opening price — seller is motivated, your offer sets the floor, not the list.
Risks & watch-outs
- Watch-outs: property tax is 2.6% of price.
- Climate carrying-cost: moderate wildfire risk; extreme-heat days projected 7→23/yr by 2055 (HVAC capex compounding) — expect insurance premiums to compound above CPI over the hold.
Questions for the listing agent
- What do current leases actually rent for vs. the listed asking? Can we see a recent rent roll and the last 12 months of T-12 income?
- It's been on market 49 days. Have you received any prior offers? Is the seller open to a 14% concession, seller financing, or rate buy-down credit?
- Property tax is high relative to price — has the assessment been appealed recently, and will the sale trigger a re-assessment?
- Is there a deadline driving the sale (1031 exchange, divorce, estate, relocation)? That informs how much negotiation room exists.
- Schools are D-rated, which usually means shorter tenancies and higher turnover. Who's the typical renter profile here, and what's been the actual vacancy rate?
- Crime grade is F in this area — have there been break-ins, vandalism, or insurance claims at this property in the last 3 years? What carrier currently insures it and at what premium?
- The area grade is low — what's the realistic commute time and amenity access for the typical tenant pool here? Any planned neighborhood developments (good or bad) we should know about?
- What's the average days-on-market for RENTAL listings here right now (not sales)? A rising rental-DOM trend means longer vacancies and softer asking-rent achievability than the comps imply.
- What's the recent tenant-quality profile in this submarket — average credit score on applications, eviction rate, late-payment / NSF rate, and stable-employment percentage? A property-management company in the area should have these aggregated.
- How much new for-sale + rental construction is in the pipeline within 1–3 miles? Heavy new supply typically softens prices + rents 12–24 months out; constrained supply supports both.
Investment metrics
- 1% rule
- 0.89% ✗
- Cap rate
- 5.33%
- Cash-on-cash
- -3.45%
- DSCR
- 0.85
- GRM
- 9.4
CMA / ARV
- ARV (median comp)
- $277,621
- List price
- $215,000
- Delta
- -22.56%
- Verdict
- UNDERPRICED
- Comps
- 20 within 1.0 mi
Show comp detail 12 sales within ~0.75 mi
| Address | Dist | Beds/Ba | Sqft | Sold | Price | $/sf | Match |
|---|---|---|---|---|---|---|---|
| 425 Little Fox Ln | 0.51mi | 3/2.0 | 1,322 (+2%) | 1mo | $264,900 | $200 | 72 |
| 700 Blue Haze Dr | 0.31mi | 3/2.0 | 1,392 (+7%) | 2mo | $280,000 | $201 | 72 |
| 10220 Little Fox Ct | 0.50mi | 3/2.0 | 1,356 (+4%) | 1mo | $260,000 | $192 | 68 |
| 10232 Sunset View Dr | 0.23mi | 3/2.0 | 1,109 (-14%) | 1mo | $255,000 | $230 | 64 |
| 705 Admiralty Way | 0.66mi | 3/2.0 | 1,323 (+2%) | 2mo | $205,000 | $155 | 64 |
| 751 Tumbleweed Ct | 0.69mi | 3/2.0 | 1,323 (+2%) | 1mo | $255,000 | $193 | 64 |
| 825 Reveille Rd | 0.68mi | 3/2.0 | 1,258 (-3%) | 2mo | $240,000 | $191 | 61 |
| 456 Little Valley Ct | 0.22mi | 2/2.0 (-1) | 1,115 (-14%) | 1mo | $215,000 | $193 | 61 |
| 10813 Tall Oak Dr | 0.32mi | 3/2.0 | 1,488 (+15%) | 1mo | $199,900 | $134 | 60 |
| 10045 Westpoint Blvd | 0.68mi | 4/2.0 (+1) | 1,283 (-1%) | 4mo | $180,000 | $140 | 59 |
| 1124 Terrace View Dr | 0.67mi | 3/2.0 | 1,391 (+7%) | 0mo | $285,000 | $205 | 56 |
| 937 Burlington Ave | 0.71mi | 3/2.0 | 1,175 (-9%) | 2mo | $299,900 | $255 | 49 |
Match score weights: distance 35% · size 25% · config 20% · recency 20%. Top-matched comps best support the ARV.
Projected returns pro-forma
-3.0% appreciation · 0.0% rent growth · sell at horizon
- IRR
- -25.9%
- Equity multiple
- 0.15×
- Total profit
- $-51,286
- Equity at exit
- $32,057
- IRR
- -39.3%
- Equity multiple
- -0.33×
- Total profit
- $-79,817
- Equity at exit
- $18,589
Cash invested: $60,200 (down + closing). Projections, not guarantees.
Landlord ↔ Tenant lean methodology
- Overall (STATE)
- 87 Strongly Landlord-Friendly
- State Texas
- 87 Strongly Landlord-Friendly · R+5
- County
- — inherits STATE
- City
- — inherits STATE
ZIP-level market 76108
- Home prices YoY
- -32.5%
- Rents YoY
- -0.2%
- Active inventory
- 553
- Price-to-rent
- 9.4×
Monthly cashflow live
- Estimated rent
- $1,905 high interval (Pro) →
- Mortgage (P&I)
- −$1,127
- Tax from tax record
- −$461 /mo · $5,532/yr
- Insurance
- −$90
- HOA
- −$0
- Vacancy / Maint / Mgmt
- −$400
- Net cashflow
- $-173
Break-even live
Sensitivity live
| Price | -10% $-51 | -5% $-112 | +0% $-173 | +5% $-234 | +10% $-295 |
|---|---|---|---|---|---|
| Rent | -10% $-323 | -5% $-248 | +0% $-173 | +5% $-98 | +10% $-22 |
| Rate | -1.0pp $-65 | -0.5pp $-118 | base $-173 | +0.5pp $-229 | +1.0pp $-285 |
UW: 25.0% down · 7.5% · 30yr · 1.5% tax · 5.0% vac · 8.0% maint · 8.0% mgmt
Financing live
Cash to close
- Down payment
- $53,750
- Closing costs
- $6,450
- Reserves months
- —
- Total cash needed
- —
Loan-product check · same deal, 3 products live
Conventional
25% down · 7.5% · 30yr
- Down + closing
- —
- Monthly P&I
- —
- Monthly cashflow
- —
- DSCR
- —
- Eligible?
- —
Personal DTI + credit; lowest rate.
DSCR
20% down · 8.5% · 30yr
- Down + closing
- —
- Monthly P&I
- —
- Monthly cashflow
- —
- DSCR
- —
- Eligible?
- —
No personal income docs; deal must DSCR.
Hard money
10% down · 12.0% · 12mo
- Down + closing
- —
- Monthly P&I
- —
- Monthly cashflow
- —
- DSCR
- —
- Eligible?
- —
Short-term bridge; refi at stabilization.
Rent comps 40 comps
| Address | Beds | Baths | Sqft | Rent | $/sqft | DOM | Units | Dist |
|---|---|---|---|---|---|---|---|---|
| 613 Deauville Dr Unit rent one bd-one bath Fort Worth, TX | 3.0 | 2.0 | 1460 | $900 | $0.62 | 45d | 1 | 0.15mi |
| 10248 Westward Dr Fort Worth, TX | 3.0 | 2.0 | 1575 | $2,250 | $1.43 | 14d | 1 | 0.18mi |
| 10275 Aurora Dr Fort Worth, TX | 2.0 | 2.0 | 880 | $1,450 | $1.65 | 45d | 1 | 0.18mi |
| 10253 Sunset View Dr Fort Worth, TX | 4.0 | 2.0 | 1640 | $2,095 | $1.28 | 45d | 1 | 0.19mi |
| 10258 Aurora Dr Fort Worth, TX | 2.0 | 2.0 | 1231 | $1,150 | $0.93 | 45d | 1 | 0.19mi |
| 459 Little Valley Ct Fort Worth, TX | 3.0 | 2.0 | 1382 | $1,895 | $1.37 | 0d | 1 | 0.20mi |
| 10258 Maverick Dr Unit 58 Fort Worth, TX | 3.0 | 2.0 | 940 | $1,595 | $1.70 | 3d | 1 | 0.21mi |
| 453 Little Valley Ct Fort Worth, TX | 3.0 | 2.0 | 1300 | $1,795 | $1.38 | 0d | 1 | 0.21mi |
| 10317 Lone Pine Ln Fort Worth, TX | 3.0 | 2.0 | 1180 | $1,750 | $1.48 | 7d | 1 | 0.24mi |
| 10307 Lone Pine Ln Fort Worth, TX | 3.0 | 2.0 | 1174 | $1,500 | $1.28 | 9d | 1 | 0.25mi |
| 10517 Lone Pine Ln Fort Worth, TX | 3.0 | 2.0 | 1706 | $2,145 | $1.26 | 45d | 1 | 0.27mi |
| 10721 Deauville Dr Fort Worth, TX | 3.0 | 1.5 | 1091 | $1,695 | $1.55 | 0d | 1 | 0.28mi |
| 556 Blue Haze Dr Fort Worth, TX | 3.0 | 2.0 | 1402 | $1,980 | $1.41 | 45d | 1 | 0.29mi |
| 10217 Maverick Dr Fort Worth, TX | 3.0 | 2.0 | 1492 | $2,045 | $1.37 | 45d | 1 | 0.30mi |
| 10205 Lone Pine Ln Fort Worth, TX | 3.0 | 2.0 | 1681 | $1,850 | $1.10 | 45d | 1 | 0.38mi |
| 851 Village Point Ln Fort Worth, TX | 3.0 | 2.5 | 1322 | $1,799 | $1.36 | 24d | 1 | 0.39mi |
| 10913 Ives St Fort Worth, TX | 3.0 | 2.0 | 1575 | $1,751 | $1.11 | 24d | 1 | 0.53mi |
| 10909 Deauville Cir S Fort Worth, TX | 3.0 | 2.0 | 1360 | $1,900 | $1.40 | 22d | 1 | 0.54mi |
| 10917 Ives St Fort Worth, TX | 4.0 | 2.0 | 1772 | $2,170 | $1.22 | 26d | 1 | 0.54mi |
| 10116 Bugle Dr Fort Worth, TX | 3.0 | 2.0 | 1341 | $1,850 | $1.38 | 45d | 1 | 0.57mi |
| 120 Flaxseed Ln Fort Worth, TX | 3.0 | 2.0 | 1406 | $1,950 | $1.39 | 45d | 1 | 0.59mi |
| 10129 Peppertree Ln Fort Worth, TX | 3.0 | 2.0 | 1094 | $1,795 | $1.64 | 4d | 1 | 0.60mi |
| 616 Reveille Rd Fort Worth, TX | 3.0 | 2.0 | 1100 | $1,695 | $1.54 | 3d | 1 | 0.62mi |
| 701 Admiralty Way Fort Worth, TX | 3.0 | 2.0 | 1265 | $1,775 | $1.40 | 26d | 1 | 0.65mi |
| 11012 Gray Mare Dr Fort Worth, TX | 3.0 | 2.0 | 1316 | $2,010 | $1.53 | 26d | 1 | 0.67mi |
| 904 Burlington Ave Fort Worth, TX | 3.0–5.0 | 2.0–2.5 | 1895 | $2,220 | $1.17 | 0d | 1 | 0.67mi |
| 101 N Bugle Dr Fort Worth, TX | 4.0 | 1.0 | 1231 | $1,650 | $1.34 | 4d | 1 | 0.69mi |
| 10008 Buffalo Grove Rd Fort Worth, TX | 3.0 | 2.0 | 1801 | $1,979 | $1.10 | 4d | 1 | 0.70mi |
| 217 N Bugle Dr Fort Worth, TX | 3.0 | 2.0 | 1170 | $1,900 | $1.62 | 14d | 1 | 0.71mi |
| 933 Burlington Ave Fort Worth, TX | 3.0 | 2.0 | 1316 | $2,010 | $1.53 | 45d | 1 | 0.74mi |
| 1144 Terrace View Dr Fort Worth, TX | 3.0 | 2.0 | 1680 | $1,975 | $1.18 | 14d | 1 | 0.76mi |
| 708 Annapolis Dr Fort Worth, TX | 3.0 | 2.0 | 1360 | $1,700 | $1.25 | 45d | 1 | 0.78mi |
| 10124 Lone Eagle Dr Fort Worth, TX | 3.0 | 2.0 | 1040 | $1,495 | $1.44 | 26d | 1 | 0.79mi |
| 10061 Pronghorn Ln Fort Worth, TX | 3.0 | 2.0 | 1694 | $1,995 | $1.18 | 3d | 1 | 0.80mi |
| 108 Prospector Ct Fort Worth, TX | 3.0 | 1.5 | 1143 | $1,695 | $1.48 | 45d | 1 | 0.81mi |
| 533 Annapolis Dr Fort Worth, TX | 3.0 | 2.0 | 1323 | $1,795 | $1.36 | 45d | 1 | 0.83mi |
| 9908 Runnymeade Pl Fort Worth, TX | 3.0 | 2.0 | 1191 | $1,825 | $1.53 | 45d | 1 | 0.90mi |
| 9904 Ivy Leaf Ln Fort Worth, TX | 3.0 | 2.0 | 1697 | $2,195 | $1.29 | 45d | 1 | 0.91mi |
| 120 Callender Dr Fort Worth, TX | 3.0 | 2.0 | 1574 | $1,767 | $1.12 | 45d | 1 | 0.91mi |
| 132 Callender Dr Fort Worth, TX | 3.0 | 2.5 | 1739 | $1,810 | $1.04 | 45d | 1 | 0.92mi |
Listing history 31 events
-
2026-06-21days on market $215,000 Active 49 DOM
-
2026-06-18days on market $215,000 Active 46 DOM
-
2026-06-17price $215,000 Active 45 DOM
-
2026-06-17days on market $220,000 Active 45 DOM
-
2026-06-16days on market $220,000 Active 44 DOM
-
2026-06-15price $220,000 Active 43 DOM
-
2026-06-15days on market $230,000 Active 43 DOM
-
2026-06-13days on market $230,000 Active 41 DOM
-
2026-06-09days on market $230,000 Active 37 DOM
-
2026-06-08days on market $230,000 Active 36 DOM
-
2026-06-07days on market $230,000 Active 35 DOM
-
2026-06-04days on market $230,000 Active 32 DOM
-
2026-06-03pricedays on market $230,000 Active 31 DOM
-
2026-06-02days on market $239,900 Active 30 DOM
-
2026-06-01days on market $239,900 Active 29 DOM
-
2026-05-31days on market $239,900 Active 28 DOM
-
2026-05-09price $275,000 406-char remark
-
2026-05-03$285,000 Active 406-char remark
-
2025-03-26soldstatus
-
2021-06-25soldstatus
-
2013-07-08soldstatus
-
2013-07-05soldstatus Closed 402-char remark
Show marketing remark (402 chars)
Charming home featuring split bedroom arrangement, tile floors, cozy fireplace and a very spacious backyard. The inviting backyard patio is covered by a wood pergola and there is lovely landscaping front and back. Windows have Energy Star rating and tilt in for easy cleaning. Trane HVAC, storm doors front & back, 2 blinds and a sprinkler system make this home efficient for cooling and heating.
-
2013-06-17status Pending 402-char remark
Show marketing remark (402 chars)
Charming home featuring split bedroom arrangement, tile floors, cozy fireplace and a very spacious backyard. The inviting backyard patio is covered by a wood pergola and there is lovely landscaping front and back. Windows have Energy Star rating and tilt in for easy cleaning. Trane HVAC, storm doors front & back, 2 blinds and a sprinkler system make this home efficient for cooling and heating.
-
2013-06-06historical Active Option Contract 402-char remark
Show marketing remark (402 chars)
Charming home featuring split bedroom arrangement, tile floors, cozy fireplace and a very spacious backyard. The inviting backyard patio is covered by a wood pergola and there is lovely landscaping front and back. Windows have Energy Star rating and tilt in for easy cleaning. Trane HVAC, storm doors front & back, 2 blinds and a sprinkler system make this home efficient for cooling and heating.
-
2013-06-03$99,900 Active 402-char remark
Show marketing remark (402 chars)
Charming home featuring split bedroom arrangement, tile floors, cozy fireplace and a very spacious backyard. The inviting backyard patio is covered by a wood pergola and there is lovely landscaping front and back. Windows have Energy Star rating and tilt in for easy cleaning. Trane HVAC, storm doors front & back, 2 blinds and a sprinkler system make this home efficient for cooling and heating.
-
2009-10-22soldstatus
-
2009-10-20soldstatus
Show marketing remark (376 chars)
Charming 3 BR, 2 BA with split floor plan. Cozy fireplace, tile floors and 2 car garage. Enjoy your evenings sitting under the wood pergola out back overlooking the good sized yard with pretty landscaping. Main windows replaced in October 2008 with Energy Star Rated custom thermally efficient Weatherbeater windows with transferrable manufacturer's lifetime limited warranty.
-
2009-09-20historical
Show marketing remark (376 chars)
Charming 3 BR, 2 BA with split floor plan. Cozy fireplace, tile floors and 2 car garage. Enjoy your evenings sitting under the wood pergola out back overlooking the good sized yard with pretty landscaping. Main windows replaced in October 2008 with Energy Star Rated custom thermally efficient Weatherbeater windows with transferrable manufacturer's lifetime limited warranty.
-
2009-06-29$118,000
Show marketing remark (376 chars)
Charming 3 BR, 2 BA with split floor plan. Cozy fireplace, tile floors and 2 car garage. Enjoy your evenings sitting under the wood pergola out back overlooking the good sized yard with pretty landscaping. Main windows replaced in October 2008 with Energy Star Rated custom thermally efficient Weatherbeater windows with transferrable manufacturer's lifetime limited warranty.
-
1989-09-06soldstatus
-
1989-05-02soldstatus
ⓘ Source: listings_history table (triggers on properties + properties_extension) + one-shot
backfill from property_details.listing_events for pre-trigger history.
Tax reassessment forecast TX · Resets to sale price
- Current annual tax
- $5,532 · $461/mo
- Projected year-2 tax
- $5,532 · $461/mo
- Expected delta
- $0/yr ($0/mo · 0.0%)
ⓘ Screening estimate from a state-policy table — verify with the county assessor before closing.
Climate risk First Street
- Flood 1/10 Low FEMA zone X (unshaded) · 0% chance over 30 yrs
- Wildfire 5/10 Major
- Heat 7/10 Severe 7 d/yr ≥108°F today · 23 d/yr by 30 yrs out
- Wind 4/10 Moderate 21% chance of damaging wind over 30 yrs
- Air quality 3/10 Moderate 3 unhealthy d/yr today · 4 by 30 yrs out
Nearby sold comps map
Loading sold comps map…
Walkable amenities ~0.75 mi
Loading nearby amenities…
Taxation est. · year 1
- Rental income
- $22,864
- − Mortgage interest
- −$12,043
- − Property taxes
- −$5,532
- − Insurance
- −$1,075
- − Repairs & maintenance
- −$1,829
- − Management
- −$1,829
- − Depreciation
- −$6,255
- Taxable loss
- −$5,699
- Est. tax savings @ 24.0%
- +$1,368
- After-tax cash flow
- $-706/yr
For passive investors: Depreciation is non-cash, so a rental often shows a tax loss while cash-flowing — sheltering income. Rental losses are passive: they offset passive income freely, and up to $25,000/yr can offset ordinary (W-2) income if you actively participate and your MAGI is under $100k (phasing out to $0 by $150k); unused losses carry forward. On sale, claimed depreciation is recaptured at up to 25%, and gains may owe capital-gains tax (a 1031 exchange can defer both). Figures are a year-1 estimate at your 24.0% rate — not tax advice; consult a CPA.
Schools (NCES district)
- District
- White Settlement ISD
- NCES district ID
- 4845540
- Math proficiency
- 35% ▼ -10.00%
- Reading proficiency
- 44% ▼ -4.00%
- Median HH income
- $56,055
- Composite
- 34.63/100
- National rank
- #5151
- State rank
- #396 of 826 in TX
Livability — Fort Worth
- Score
- 80/100
- State rank
- #49
- US rank
- #1954
Category grades
Schools grade is shown separately in the Schools card above.
Census & demographics
- Census place
- Fort Worth, TX
- County
- Tarrant County · 2,033,669 people
- City population
- 911,619
- Metro
- Dallas-Fort Worth-Arlington, TX
- Population (ZIP)
- 45,537
- Household income
- $80,412
- Rent vs Own
- Severe rent burden
- 774.0
Population outlook (Tarrant County) Hauer SSP2
- Today (2025)
- 2,380,417 people
- By 2030
- 2,578,900 · +8.3%
- By 2040
- 2,974,995 · +25.0%
- By 2050
- 3,350,489 · +40.8%
- By 2075
- 4,216,909 · +77.2%
- By 2100
- 4,741,527 · +99.2%
Race, ethnicity, and origin ACS 2023
- Neighborhood character
- Diverse neighborhood (Simpson 0.62)
- Race & ethnicity
- White 52% Hispanic / Latino 32% Two or more races 17% Black 8% Asian 3% Native American 1%
- Hispanic origin (detail)
- Mexican 26% Puerto Rican 1%
- Common ancestry
- Slovak 2% Lithuanian 1% Romanian 1%
- Foreign-born
- 11% · Canada, Vietnam
- Languages at home
- 76% English-only · Spanish 21% Vietnamese 1% Tagalog/Filipino 1%
Political lean MEDSL · Tarrant
- 2024 margin
- Lean R (+5.1) · D 46.7% · R 51.9% · Other 1.4%
- 2008→2024 swing
- +6.6pp toward D · 2008: -11.7pp · 2024: -5.1pp
- All cycles
- 2024: R+5.1 2020: D+0.2 2016: R+8.7 2012: R+15.7 2008: R+11.7
Not yet ingested
- Civics
- —
Market trends
- HPI YoY
- ▼ -141.39%
- Current HPI
- 294.2459
- Rent YoY
- ▼ -0.18%
- Metro
- Dallas-Fort Worth-Arlington, TX
- State GDP YoY
- ▲ 3.95%
- F500 in state
- 110
Industry mix (Fortune 500 HQ in TX)
| Industry | F500 HQs | Revenue |
|---|---|---|
| Energy | 16 | $1,198B |
|
||
| Technology | 5 | $198B |
|
||
| Engineering / Construction | 4 | $72B |
|
||
| Energy Services | 3 | $60B |
|
||
| Utilities | 3 | $41B |
|
||
| Healthcare | 2 | $330B |
|
||
Price history
+82.2% since first listed20 events — show timeline
- 2026-06-17 Price Changed $215,000 NTREIS
- 2026-06-15 Price Changed $220,000 NTREIS
- 2026-06-03 Price Changed $230,000 NTREIS
- 2026-05-29 Price Changed $239,900 NTREIS
- 2026-05-20 Price Changed $250,000 NTREIS
- 2026-05-09 Price Changed $275,000 NTREIS
- 2026-05-03 Listed $285,000 NTREIS
- 2025-03-26 Sold (Public Records) — Public Records
- 2021-06-25 Sold (Public Records) — Public Records
- 2013-07-08 Sold (Public Records) — Public Records
- 2013-07-05 Sold (MLS) — NTREIS
- 2013-06-17 Pending — NTREIS
- 2013-06-06 Contingent — NTREIS
- 2013-06-03 Listed $99,900 NTREIS
- 2009-10-22 Sold (Public Records) — Public Records
- 2009-10-20 Sold (MLS) — NTREIS
- 2009-09-20 Listing Removed — NTREIS
- 2009-06-29 Listed $118,000 NTREIS
- 1989-09-06 Sold (Public Records) — Public Records
- 1989-05-02 Sold (Public Records) — Public Records
Property tax history
+4.6%/yrLatest (2025): $5,532 · +6.9% YoY. Source: county tax records.
Cash-flow waterfall
monthlySold comps — $/sqft
last 12 mo · ≤1 miLoading sold comps…