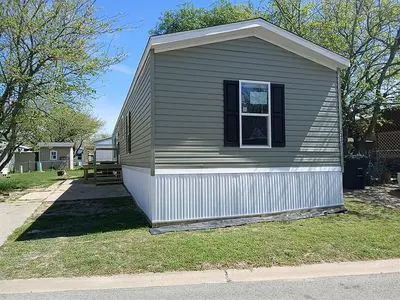
305 W Elms Rd · Killeen, TX
Flood risk 1/10 · Minimal
- FEMA flood zone
- X (unshaded)
- Chance of flooding over 30 yrs
- 0.0%
- Est. flood insurance / yr
- $507 – $1,088
Fire risk 5/10 · Moderate
- Est. fire insurance / yr
- $1,222 – $2,270
Heat risk 7/10 · Major
- Hot days now (above 107°F)
- 6 days/yr
- Hot days in 30 yrs
- 19 days/yr
Wind risk 6/10 · Moderate
- Chance of severe wind over 30 yrs
- 56.0%
Air-quality risk 1/10 · Minimal
- Unhealthy air days now
- 0 days/yr
- Unhealthy air days in 30 yrs
- 0 days/yr
Risk factors via First Street. Map © Google.
Why this score? — see what drove the C grade
The composite is a weighted blend of 9 inputs, each scored 0–100. Each bar is that input's sub-score; the figure is the points it added to the 100-point composite (weight × sub-score).
- Cash flow +26.0/30.0
- DSCR +8.7/10.0
- ARV discount +7.5/15.0
- 1% rule +6.9/10.0
- Livability +3.2/5.0
- Schools +3.0/10.0
- Condition / age +2.5/5.0
- Rent growth +2.0/5.0
- Appreciation +0.0/10.0
$89,900
🖨 Deal sheet 📄 Offer letter ✓ Due diligence
Listing remarks
This is a brand new 3 bedroom, 2 bathroom home available now for purchase with a monthly lot rent of $450. The home features an open concept layout, a kitchen island and pantry, and three spacious rooms. One bathroom has a double vanity too. The kitchen is fully equipped with a dishwasher, fridge, and oven. The home is located in the community Southern Hill Manufactured Home Community in Killeen, and some of the amenities you can enjoy are a basketball court and an on-site mail area.
Key facts
- Pantry
- Double vanity
- Basketball court
Tags
Neighborhood map
What this means for you Summary
Snapshot
- This is a 3-bed/2.0-bath other listed at $90k.
Deal economics
- At list price, monthly cash flow is $223 ($3k/yr) — positive.
- The deal already cash-flows at list — no discount required.
- Meets the 1% rule at list price ($1k rent vs $90k).
- Cap rate 9.3% vs local median 3.9% in Killeen — top-decile yield for the area; either an underpriced asset or a hidden risk that comps aren't pricing in. Stress-test before assuming the spread holds.
Location & tenants
- Location reads 63/100 on livability (#853 in TX) — a middle-class / working-renter tenant base. Strengths: cost of living A+, housing A+; Watch: schools D+, amenities D, employment D.
- Killeen ISD (urban): math 31% / reading 38% proficiency, ranked #524 of 826 in TX (top 63%) — families likely to look elsewhere, expect single-tenant / working-renter base with shorter leases.
- Market conditions: Rents soft (-1.9%/yr); 643 active listings in the ZIP; 40 comparable units currently listed for rent nearby; rentals lingering (median 44d on market — plan ~5-8 weeks vacancy on turnover, expect pricing pressure); 58% of comp listings sitting > 30 days — soft ceiling on asking rent; 3,222 units permitted in Bell County in 2024 (246 in 5+ unit buildings).
- This rent is only 17% of the median local income ($74k/yr) — well below the 30% rent-burden line; pricing power to push rent on renewal without tenant pushback.
Forward outlook
- Local home prices are declining (-3.0%/yr); year-one equity from $622 of loan paydown is wiped out by about $3k of value loss. Plan a longer hold.
- Bell County population projected at +21% by 2050 — long-run rental-demand tailwind backs the buy-and-hold thesis.
Negotiation context
- Only 8 days on market — expect competitive offers; lowballing is unlikely to land.
Risks & watch-outs
- Climate carrying-cost: major wind risk, 56% chance of damaging wind over 30y; moderate wildfire risk; extreme-heat days projected 6→19/yr by 2055 (HVAC capex compounding) — expect insurance premiums to compound above CPI over the hold.
Questions for the listing agent
- Is there a deadline driving the sale (1031 exchange, divorce, estate, relocation)? That informs how much negotiation room exists.
- Schools are D-rated, which usually means shorter tenancies and higher turnover. Who's the typical renter profile here, and what's been the actual vacancy rate?
- Crime grade is D in this area — have there been break-ins, vandalism, or insurance claims at this property in the last 3 years? What carrier currently insures it and at what premium?
- What's the average days-on-market for RENTAL listings here right now (not sales)? A rising rental-DOM trend means longer vacancies and softer asking-rent achievability than the comps imply.
- What's the recent tenant-quality profile in this submarket — average credit score on applications, eviction rate, late-payment / NSF rate, and stable-employment percentage? A property-management company in the area should have these aggregated.
- How much new for-sale + rental construction is in the pipeline within 1–3 miles? Heavy new supply typically softens prices + rents 12–24 months out; constrained supply supports both.
Investment metrics
- 1% rule
- 1.19% ✓
- Cap rate
- 9.26%
- Cash-on-cash
- 10.61%
- DSCR
- 1.47
- GRM
- 7.0
CMA / ARV
No comps found within radius.
Projected returns pro-forma
-3.0% appreciation · 0.0% rent growth · sell at horizon
- IRR
- -3.8%
- Equity multiple
- 0.86×
- Total profit
- $-3,503
- Equity at exit
- $13,404
- IRR
- 2.0%
- Equity multiple
- 1.13×
- Total profit
- $3,175
- Equity at exit
- $7,773
Cash invested: $25,172 (down + closing). Projections, not guarantees.
Landlord ↔ Tenant lean methodology
- Overall (STATE)
- 87 Strongly Landlord-Friendly
- State Texas
- 87 Strongly Landlord-Friendly · R+5
- County
- — inherits STATE
- City
- — inherits STATE
ZIP-level market 76542
- Home prices YoY
- -21.7%
- Rents YoY
- -1.9%
- Active inventory
- 643
- Price-to-rent
- 7.0×
Monthly cashflow live
- Estimated rent
- $1,068 high interval (Pro) →
- Mortgage (P&I)
- −$471
- Tax est. 1.5%
- −$112 /mo · $1,348/yr
- Insurance
- −$37
- HOA
- −$0
- Vacancy / Maint / Mgmt
- −$224
- Net cashflow
- $223
Break-even live
UW: 25.0% down · 7.5% · 30yr · 1.5% tax · 5.0% vac · 8.0% maint · 8.0% mgmt
Financing live
Cash to close
- Down payment
- $22,475
- Closing costs
- $2,697
- Reserves months
- —
- Total cash needed
- —
Loan-product check · same deal, 3 products live
Conventional
25% down · 7.5% · 30yr
- Down + closing
- —
- Monthly P&I
- —
- Monthly cashflow
- —
- DSCR
- —
- Eligible?
- —
Personal DTI + credit; lowest rate.
DSCR
20% down · 8.5% · 30yr
- Down + closing
- —
- Monthly P&I
- —
- Monthly cashflow
- —
- DSCR
- —
- Eligible?
- —
No personal income docs; deal must DSCR.
Hard money
10% down · 12.0% · 12mo
- Down + closing
- —
- Monthly P&I
- —
- Monthly cashflow
- —
- DSCR
- —
- Eligible?
- —
Short-term bridge; refi at stabilization.
Rent comps 40 comps
| Address | Beds | Baths | Sqft | Rent | $/sqft | DOM | Units | Dist |
|---|---|---|---|---|---|---|---|---|
| 3804 Charolais Dr Unit C Killeen, TX | 2.0 | 1.5 | 890 | $850 | $0.96 | 23d | 1 | 0.15mi |
| 3810 Charolais Dr Apt B Killeen, TX | 2.0 | 1.5 | — | $795 | — | 23d | 1 | 0.15mi |
| 3904 Charolais Dr Killeen, TX | 2.0 | 1.5 | 1005 | $795 | $0.79 | 43d | 1 | 0.18mi |
| 206 Castellon Ct Unit A Killeen, TX | 3.0 | 2.0 | 1200 | $1,205 | $1.00 | 43d | 1 | 0.19mi |
| 3907 Charolais Dr Unit B Killeen, TX | 2.0 | 1.0 | — | $700 | — | 43d | 1 | 0.20mi |
| 101 E Elms Rd #149 Killeen, TX | 3.0 | 2.0 | 1080 | $1,250 | $1.16 | 13d | 1 | 0.21mi |
| 108 Castellon Ct Unit B Killeen, TX | 3.0 | 2.0 | 1020 | $1,150 | $1.13 | 43d | 1 | 0.21mi |
| 505 Longhorn Cir Unit C Killeen, TX | 2.0 | 1.5 | 1021 | $700 | $0.69 | 23d | 1 | 0.22mi |
| 103 Castellon Ct Unit A Killeen, TX | 3.0 | 2.0 | 997 | $1,077 | $1.08 | 23d | 1 | 0.24mi |
| 103 Castellon Ct Unit B Killeen, TX | 3.0 | 2.0 | 977 | $1,097 | $1.12 | 43d | 1 | 0.24mi |
| 103 Castellon Ct Killeen, TX | 3.0 | 2.0 | 977 | $1,077 | $1.10 | 43d | 1 | 0.24mi |
| 3702 Hereford Ln Apt A Killeen, TX | 2.0 | 1.5 | 1100 | $795 | $0.72 | 43d | 1 | 0.27mi |
| 3312 Cantabrian Dr Unit C Killeen, TX | 2.0 | 1.5 | 2016 | $750 | $0.37 | 23d | 1 | 0.30mi |
| 3312 Cantabrian Dr Unit D Killeen, TX | 3.0 | 2.0 | 2016 | $1,050 | $0.52 | 43d | 1 | 0.30mi |
| 3409 Toledo Dr Killeen, TX | 3.0 | 2.0 | 1134 | $900 | $0.79 | 21d | 1 | 0.30mi |
| 3407 Toledo Dr Unit D Killeen, TX | 3.0 | 2.0 | 1184 | $800 | $0.68 | 23d | 1 | 0.31mi |
| 3407 Toledo Dr Unit C Killeen, TX | 3.0 | 2.0 | 1184 | $800 | $0.68 | 43d | 1 | 0.31mi |
| 3803 Ys Pak Ct Unit C Killeen, TX | 2.0 | 1.5 | 3388 | $775 | $0.23 | 43d | 1 | 0.32mi |
| 3400 Cantabrian Dr Unit A Killeen, TX | 2.0 | 1.0 | 889 | $795 | $0.89 | 43d | 1 | 0.33mi |
| 3705 Ys Pak Ct Unit B Killeen, TX | 2.0 | 1.5 | 927 | $775 | $0.84 | 13d | 1 | 0.33mi |
| 3402 Hereford Ln Killeen, TX | 3.0 | 2.0 | 1172 | $750 | $0.64 | 13d | 1 | 0.33mi |
| 3302 Alicante Ct Unit B Killeen, TX | 3.0 | 2.0 | 1100 | $1,210 | $1.10 | 23d | 1 | 0.34mi |
| 3402 Cantabrian Dr Unit B Killeen, TX | 3.0 | 2.0 | 4640 | $850 | $0.18 | 43d | 1 | 0.34mi |
| 3407 Hereford Ln Apt A Killeen, TX | 3.0 | 2.0 | 1134 | $795 | $0.70 | 13d | 1 | 0.34mi |
| 3701 Ys Pak Ct Apt F Killeen, TX | 2.0 | 1.5 | 915 | $675 | $0.74 | 43d | 1 | 0.35mi |
| 3405 Hereford Ln Unit C Killeen, TX | 3.0 | 2.0 | 1134 | $775 | $0.68 | 43d | 1 | 0.35mi |
| 502 Sladecek Dr Unit A Killeen, TX | 3.0 | 2.0 | 1304 | $1,275 | $0.98 | 43d | 1 | 0.35mi |
| 3408 Barcelona Dr Apt C Killeen, TX | 3.0 | 2.0 | 1100 | $895 | $0.81 | 13d | 1 | 0.36mi |
| 3307 Toledo Dr Unit B Killeen, TX | 3.0 | 2.0 | 4536 | $750 | $0.17 | 23d | 1 | 0.36mi |
| 3307 Toledo Dr Unit B Killeen, TX | 3.0 | 2.0 | 1134 | $750 | $0.66 | 43d | 1 | 0.36mi |
| 3304 Hereford Ln Unit D Killeen, TX | 3.0 | 2.0 | 1134 | $795 | $0.70 | 43d | 1 | 0.37mi |
| 3307 Hereford Ln Unit D Killeen, TX | 3.0 | 2.0 | — | $875 | — | 23d | 1 | 0.37mi |
| 3303 Toledo Dr Unit D Killeen, TX | 3.0 | 2.0 | 1100 | $895 | $0.81 | 13d | 1 | 0.38mi |
| 3303 Toledo Dr Apt C Killeen, TX | 3.0 | 2.0 | 1100 | $1,050 | $0.95 | 23d | 1 | 0.38mi |
| 3210 Toledo Dr Unit A Killeen, TX | 3.0 | 2.0 | 2234 | $1,150 | $0.51 | 43d | 1 | 0.39mi |
| 2800 Cantabrian Dr Unit A Killeen, TX | 3.0 | 2.0 | 1134 | $1,195 | $1.05 | 43d | 1 | 0.39mi |
| 601 Sladecek Dr Unit B Killeen, TX | 3.0 | 2.0 | 1340 | $1,500 | $1.12 | 43d | 1 | 0.39mi |
| 601 Sladecek Dr Killeen, TX | 3.0 | 2.0 | 1340 | $1,200 | $0.90 | 43d | 1 | 0.39mi |
| 3301 Toledo Dr Apt D Killeen, TX | 3.0 | 2.0 | 1172 | $950 | $0.81 | 43d | 1 | 0.40mi |
| 2802 Cantabrian Dr Killeen, TX | 3.0 | 2.0 | 4592 | $950 | $0.21 | 43d | 1 | 0.40mi |
Listing history 7 events
-
2026-06-18days on market $89,900 Active 8 DOM
-
2026-06-17days on market $89,900 Active 7 DOM
-
2026-06-16days on market $89,900 Active 6 DOM
-
2026-06-15days on market $89,900 Active 5 DOM
-
2026-06-14days on market $89,900 Active 3 DOM
-
2026-06-13remarks 488-char remark
-
2026-06-13$89,900 Active 2 DOM
ⓘ Source: listings_history table (triggers on properties + properties_extension) + one-shot
backfill from property_details.listing_events for pre-trigger history.
Climate risk First Street
- Flood 1/10 Low FEMA zone X (unshaded) · 0% chance over 30 yrs
- Wildfire 5/10 Major
- Heat 7/10 Severe 6 d/yr ≥107°F today · 19 d/yr by 30 yrs out
- Wind 6/10 Major 56% chance of damaging wind over 30 yrs
- Air quality 1/10 Low 0 unhealthy d/yr today · 0 by 30 yrs out
Nearby sold comps map
Loading sold comps map…
Walkable amenities ~0.75 mi
Loading nearby amenities…
Taxation est. · year 1
- Rental income
- $12,819
- − Mortgage interest
- −$5,036
- − Property taxes
- −$1,348
- − Insurance
- −$450
- − Repairs & maintenance
- −$1,026
- − Management
- −$1,026
- − Depreciation
- −$2,615
- Taxable income
- $1,319
- Est. tax owed @ 24.0%
- −$317
- After-tax cash flow
- $2,355/yr
For passive investors: Depreciation is non-cash, so a rental often shows a tax loss while cash-flowing — sheltering income. Rental losses are passive: they offset passive income freely, and up to $25,000/yr can offset ordinary (W-2) income if you actively participate and your MAGI is under $100k (phasing out to $0 by $150k); unused losses carry forward. On sale, claimed depreciation is recaptured at up to 25%, and gains may owe capital-gains tax (a 1031 exchange can defer both). Figures are a year-1 estimate at your 24.0% rate — not tax advice; consult a CPA.
Schools (NCES district)
- District
- Killeen ISD
- NCES district ID
- 4825660
- Math proficiency
- 31% ▼ -16.00%
- Reading proficiency
- 38% ▼ -3.00%
- Median HH income
- $47,665
- Composite
- 29.69/100
- National rank
- #6458
- State rank
- #524 of 826 in TX
Livability — Killeen
- Score
- 63/100
- State rank
- #853
- US rank
- #15359
Category grades
Schools grade is shown separately in the Schools card above.
Census & demographics
- Census place
- Killeen, TX
- County
- Bell County · 345,090 people
- City population
- 163,398
- Metro
- Killeen-Temple, TX
- Population (ZIP)
- 53,892
- Household income
- $74,055
- Rent vs Own
- Severe rent burden
- 1167.0
Population outlook (Bell County) Hauer SSP2
- Today (2025)
- 371,114 people
- By 2030
- 389,104 · +4.8%
- By 2040
- 420,592 · +13.3%
- By 2050
- 447,779 · +20.7%
- By 2075
- 499,130 · +34.5%
- By 2100
- 505,680 · +36.3%
Race, ethnicity, and origin ACS 2023
- Neighborhood character
- Highly diverse neighborhood (Simpson 0.74)
- Race & ethnicity
- Black 34% White 27% Hispanic / Latino 26% Two or more races 17% Asian 5%
- Hispanic origin (detail)
- Mexican 13% Puerto Rican 9%
- Common ancestry
- Italian 1% Lithuanian 1% Slovak 1%
- Foreign-born
- 10% · Canada, South Korea, Vietnam
- Languages at home
- 79% English-only · Spanish 15% Korean 1% German/W. Germanic 1%
Political lean MEDSL · Bell
- 2024 margin
- R (+16.2) · D 41.3% · R 57.6% · Other 1.1%
- 2008→2024 swing
- -6.5pp toward R · 2008: -9.8pp · 2024: -16.2pp
- All cycles
- 2024: R+16.2 2020: R+8.5 2016: R+15.1 2012: R+16.4 2008: R+9.8
Not yet ingested
- Civics
- —
Market trends
- HPI YoY
- ▼ -43.94%
- Current HPI
- 158.4385
- Rent YoY
- ▼ -1.85%
- Metro
- Killeen-Temple, TX
- State GDP YoY
- ▲ 3.95%
- F500 in state
- 110
Industry mix (Fortune 500 HQ in TX)
| Industry | F500 HQs | Revenue |
|---|---|---|
| Energy | 16 | $1,198B |
|
||
| Technology | 5 | $198B |
|
||
| Engineering / Construction | 4 | $72B |
|
||
| Energy Services | 3 | $60B |
|
||
| Utilities | 3 | $41B |
|
||
| Healthcare | 2 | $330B |
|
||
Price history
1 event — show timeline
- 2026-06-11 Listed $89,900 FSBO.com
Property tax history
+63.2%/yrLatest (2026): $63,293 · +11.3% YoY. Source: county tax records.
Cash-flow waterfall
monthlySold comps — $/sqft
last 12 mo · ≤1 miLoading sold comps…