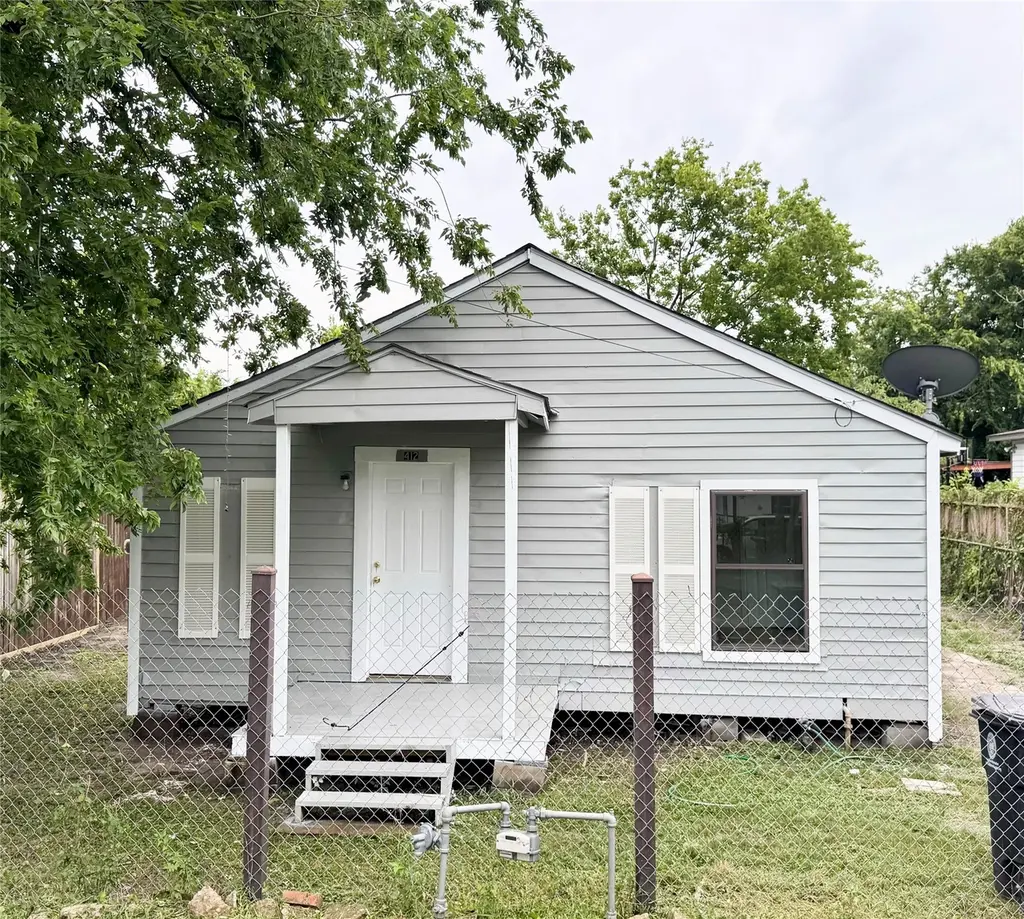
412 Owens St · Houston, TX
Flood risk 5/10 · Moderate
- FEMA flood zone
- X (unshaded)
- Chance of flooding over 30 yrs
- 0.53%
- Est. flood insurance / yr
- $507 – $1,088
Fire risk 3/10 · Minor
- Est. fire insurance / yr
- $1,222 – $2,270
Heat risk 9/10 · Severe
- Hot days now (above 109°F)
- 7 days/yr
- Hot days in 30 yrs
- 22 days/yr
Wind risk 9/10 · Severe
- Chance of severe wind over 30 yrs
- 99.0%
Air-quality risk 2/10 · Minimal
- Unhealthy air days now
- 2 days/yr
- Unhealthy air days in 30 yrs
- 2 days/yr
Risk factors via First Street. Map © Google.
Why this score? — see what drove the B- grade
The composite is a weighted blend of 9 inputs, each scored 0–100. Each bar is that input's sub-score; the figure is the points it added to the 100-point composite (weight × sub-score).
- Cash flow +19.8/30.0
- ARV discount +13.2/15.0
- Appreciation +10.0/10.0
- DSCR +6.3/10.0
- 1% rule +5.2/10.0
- Livability +3.7/5.0
- Schools +2.8/10.0
- Rent growth +2.5/5.0
- Condition / age +2.5/5.0
$125,000
🖨 Deal sheet 📄 Offer letter ✓ Due diligence
Listing remarks MLS
LOOKING FOR AN AFFORDABLE HOME OR INVESTMENT PROPERTY? COZY AND COMFORTABLE 3/1 BEDROOM LOCATED IN CUL DE SAC. RECENT LAMINATE FLOORING THROUGHOUT. QUARTZ COUNTERTOPS AND SUBWAY TILE BACKSPLASH IN KITCHEN AND BATHROOM! LARGE FENCED BACKYARD. SELLER WILL INSTALL MINISPLIT AT CLOSING. COME AND TOUR THIS HOME TODAY!
Key facts
- 5,000 sq ft lot
- Built 1940
- Listed 9 days
Neighborhood map
What this means for you Summary
Snapshot
- This is a 2-bed/1.0-bath single-family listed at $125k.
Deal economics
- At list price, monthly cash flow is $148 ($2k/yr) — positive.
- The deal already cash-flows at list — no discount required.
- Meets the 1% rule at list price ($1k rent vs $125k).
- Cap rate 7.7% vs local median 3.2% in Houston — top-decile yield for the area; either an underpriced asset or a hidden risk that comps aren't pricing in. Stress-test before assuming the spread holds.
Location & tenants
- Location reads 74/100 on livability (#184 in TX, #4,771 nationally) — a middle-class / working-renter tenant base. Strengths: amenities A+, cost of living A+, housing A+; Watch: schools D, crime F.
- Galena Park ISD (suburban): math 32% / reading 33% proficiency, ranked #578 of 826 in TX (top 70%) — families likely to look elsewhere, expect single-tenant / working-renter base with shorter leases; 74% free/reduced lunch — lower-income household profile, screen leases tightly.
- Market conditions: 153 active listings in the ZIP; 9 comparable units currently listed for rent nearby; rentals at typical pace (median 15d on market — plan ~3-4 weeks tenant-placement turnaround); 29,883 units permitted in Harris County in 2024 (8,621 in 5+ unit buildings).
- This rent runs 32% of the median local income ($48k/yr) — at the standard rent-burdened threshold; future hikes will face affordability resistance.
Forward outlook
- In year one you build about $13k of equity ($864 loan paydown + $12k appreciation (10.0% local appreciation)).
- Harris County population projected at +47% by 2050 — long-run rental-demand tailwind backs the buy-and-hold thesis.
- At projected returns (10.0% appreciation + 3.0% rent growth), your $35k cash investment doubles in ~3 years — after that, you're playing with house money.
- By year 3, paydown + projected appreciation supports a ~$34k cash-out refi (75% LTV) — recoverable capital for the next deal without selling this one.
Negotiation context
- Only 10 days on market — expect competitive offers; lowballing is unlikely to land.
- 4 sale attempts since 26y ago; this cycle's ask has dropped $24k (16%) from the opening price — seller is motivated, your offer sets the floor, not the list.
- Current owner paid $4k; list at $125k implies a 2678% gain — meaningful room to come down on a strong offer.
Risks & watch-outs
- Watch-outs: built in 1940 — expect roof / HVAC / electrical / plumbing capex.
- Climate carrying-cost: moderate flood risk; severe wind risk, 99% chance of damaging wind over 30y; extreme-heat days projected 7→22/yr by 2055 (HVAC capex compounding) — expect insurance premiums to compound above CPI over the hold.
Questions for the listing agent
- Built in 1940 — when were the roof, HVAC, electrical panel, plumbing, and water heater last replaced?
- Is there a deadline driving the sale (1031 exchange, divorce, estate, relocation)? That informs how much negotiation room exists.
- Schools are D-rated, which usually means shorter tenancies and higher turnover. Who's the typical renter profile here, and what's been the actual vacancy rate?
- Crime grade is F in this area — have there been break-ins, vandalism, or insurance claims at this property in the last 3 years? What carrier currently insures it and at what premium?
- What's the average days-on-market for RENTAL listings here right now (not sales)? A rising rental-DOM trend means longer vacancies and softer asking-rent achievability than the comps imply.
- What's the recent tenant-quality profile in this submarket — average credit score on applications, eviction rate, late-payment / NSF rate, and stable-employment percentage? A property-management company in the area should have these aggregated.
- How much new for-sale + rental construction is in the pipeline within 1–3 miles? Heavy new supply typically softens prices + rents 12–24 months out; constrained supply supports both.
Investment metrics
- 1% rule
- 1.02% ✓
- Cap rate
- 7.72%
- Cash-on-cash
- 5.09%
- DSCR
- 1.23
- GRM
- 8.1
CMA / ARV
- ARV (median comp)
- $143,031
- List price
- $125,000
- Delta
- -12.61%
- Verdict
- UNDERPRICED
- Comps
- 20 within 1.0 mi
Show comp detail 10 sales within ~0.75 mi
| Address | Dist | Beds/Ba | Sqft | Sold | Price | $/sf | Match |
|---|---|---|---|---|---|---|---|
| 506 Sage Dr | 0.35mi | 2/1.0 | 1,008 (+4%) | 4mo | $137,000 | $136 | 74 |
| 1304 Pugh Dr | 0.58mi | 2/1.0 | 955 (-1%) | 5mo | $194,000 | $203 | 66 |
| 1101 Bank Dr | 0.08mi | 2/1.0 | 1,104 (+14%) | 19mo | $130,000 | $118 | 57 |
| 2106 6th St | 0.70mi | 3/1.0 (+1) | 936 (-3%) | 1mo | $140,000 | $150 | 56 |
| 1407 Craig Dr | 0.45mi | 2/1.0 | 872 (-10%) | 10mo | $161,500 | $185 | 54 |
| 153 De Haven St | 0.37mi | 2/1.0 | 880 (-9%) | 23mo | $150,000 | $170 | 48 |
| 2219 8th St | 0.48mi | 3/1.0 (+1) | 1,080 (+12%) | 12mo | $140,000 | $130 | 43 |
| 2113 10th St | 0.63mi | 2/2.0 | 1,103 (+14%) | 7mo | $135,000 | $122 | 38 |
| 2107 7th St | 0.70mi | 2/1.0 | 889 (-8%) | 21mo | $140,000 | $157 | 36 |
| 2016 13th St | 0.72mi | 3/1.0 (+1) | 1,080 (+12%) | 22mo | $176,000 | $163 | 24 |
Match score weights: distance 35% · size 25% · config 20% · recency 20%. Top-matched comps best support the ARV.
Projected returns pro-forma
10.0% appreciation · 3.0% rent growth · sell at horizon
- IRR
- 28.0%
- Equity multiple
- 3.22×
- Total profit
- $77,549
- Equity at exit
- $112,610
- IRR
- 24.4%
- Equity multiple
- 7.31×
- Total profit
- $220,971
- Equity at exit
- $242,848
Cash invested: $35,000 (down + closing). Projections, not guarantees.
Landlord ↔ Tenant lean methodology
- Overall (STATE)
- 87 Strongly Landlord-Friendly
- State Texas
- 87 Strongly Landlord-Friendly · R+5
- County
- — inherits STATE
- City
- — inherits STATE
ZIP-level market 77029
- Home prices YoY
- 7.2%
- Active inventory
- 153
- Price-to-rent
- 8.1×
Monthly cashflow live
- Estimated rent
- $1,279 high interval (Pro) →
- Mortgage (P&I)
- −$656
- Tax from tax record
- −$154 /mo · $1,851/yr
- Insurance
- −$52
- HOA
- −$0
- Vacancy / Maint / Mgmt
- −$269
- Net cashflow
- $148
Break-even live
UW: 25.0% down · 7.5% · 30yr · 1.5% tax · 5.0% vac · 8.0% maint · 8.0% mgmt
Financing live
Cash to close
- Down payment
- $31,250
- Closing costs
- $3,750
- Reserves months
- —
- Total cash needed
- —
Loan-product check · same deal, 3 products live
Conventional
25% down · 7.5% · 30yr
- Down + closing
- —
- Monthly P&I
- —
- Monthly cashflow
- —
- DSCR
- —
- Eligible?
- —
Personal DTI + credit; lowest rate.
DSCR
20% down · 8.5% · 30yr
- Down + closing
- —
- Monthly P&I
- —
- Monthly cashflow
- —
- DSCR
- —
- Eligible?
- —
No personal income docs; deal must DSCR.
Hard money
10% down · 12.0% · 12mo
- Down + closing
- —
- Monthly P&I
- —
- Monthly cashflow
- —
- DSCR
- —
- Eligible?
- —
Short-term bridge; refi at stabilization.
Rent comps 9 comps
| Address | Beds | Baths | Sqft | Rent | $/sqft | DOM | Units | Dist |
|---|---|---|---|---|---|---|---|---|
| 335 Delaware St Houston, TX | 2.0 | 1.0 | 784 | $940 | $1.20 | 12d | 1 | 0.18mi |
| 403 Armstrong St Houston, TX | 3.0 | 2.0 | 909 | $1,435 | $1.58 | 5d | 1 | 0.27mi |
| 423 Armstrong St Houston, TX | 3.0 | 2.0 | 1090 | $1,515 | $1.39 | 2d | 1 | 0.28mi |
| 9743 Veyblum St Unit B Houston, TX | 3.0 | 2.0 | 872 | $1,145 | $1.31 | 5d | 1 | 0.63mi |
| 9713 Stedman St Unit b Houston, TX | 3.0 | 2.0 | 872 | $1,095 | $1.26 | 43d | 1 | 0.78mi |
| 9806 Fillmore St Houston, TX | 2.0 | 2.0 | 850 | $1,850 | $2.18 | 43d | 1 | 1.22mi |
| 9907 Lanewell St Unit a Houston, TX | 3.0 | 2.0 | 872 | $1,154 | $1.32 | 22d | 1 | 1.30mi |
| 1726 Switzer St Houston, TX | 1.0 | 1.0 | 620 | $500 | $0.81 | 15d | 1 | 1.36mi |
| 1726 Switzer St Unit 4 Houston, TX | 1.0 | 1.0 | 620 | $500 | $0.81 | 19d | 1 | 1.36mi |
Listing history 27 events
-
2026-06-18days on market $125,000 Active 10 DOM
-
2026-06-17days on market $125,000 Active 9 DOM
-
2026-06-16days on market $125,000 Active 8 DOM
-
2026-06-15days on market $125,000 Active 7 DOM
-
2026-06-13days on market $125,000 Active 5 DOM
-
2026-06-13days on market $125,000 Active 4 DOM
-
2026-06-09days on market $125,000 Active 1 DOM
-
2026-05-06price $125,000 316-char remark
Show marketing remark (316 chars)
LOOKING FOR AN AFFORDABLE HOME OR INVESTMENT PROPERTY? COZY AND COMFORTABLE 3/1 BEDROOM LOCATED IN CUL DE SAC. RECENT LAMINATE FLOORING THROUGHOUT. QUARTZ COUNTERTOPS AND SUBWAY TILE BACKSPLASH IN KITCHEN AND BATHROOM! LARGE FENCED BACKYARD. SELLER WILL INSTALL MINISPLIT AT CLOSING. COME AND TOUR THIS HOME TODAY!
-
2026-04-12price $129,000 316-char remark
Show marketing remark (316 chars)
LOOKING FOR AN AFFORDABLE HOME OR INVESTMENT PROPERTY? COZY AND COMFORTABLE 3/1 BEDROOM LOCATED IN CUL DE SAC. RECENT LAMINATE FLOORING THROUGHOUT. QUARTZ COUNTERTOPS AND SUBWAY TILE BACKSPLASH IN KITCHEN AND BATHROOM! LARGE FENCED BACKYARD. SELLER WILL INSTALL MINISPLIT AT CLOSING. COME AND TOUR THIS HOME TODAY!
-
2026-02-28price $134,900 316-char remark
Show marketing remark (316 chars)
LOOKING FOR AN AFFORDABLE HOME OR INVESTMENT PROPERTY? COZY AND COMFORTABLE 3/1 BEDROOM LOCATED IN CUL DE SAC. RECENT LAMINATE FLOORING THROUGHOUT. QUARTZ COUNTERTOPS AND SUBWAY TILE BACKSPLASH IN KITCHEN AND BATHROOM! LARGE FENCED BACKYARD. SELLER WILL INSTALL MINISPLIT AT CLOSING. COME AND TOUR THIS HOME TODAY!
-
2026-02-12price $139,000 316-char remark
Show marketing remark (316 chars)
LOOKING FOR AN AFFORDABLE HOME OR INVESTMENT PROPERTY? COZY AND COMFORTABLE 3/1 BEDROOM LOCATED IN CUL DE SAC. RECENT LAMINATE FLOORING THROUGHOUT. QUARTZ COUNTERTOPS AND SUBWAY TILE BACKSPLASH IN KITCHEN AND BATHROOM! LARGE FENCED BACKYARD. SELLER WILL INSTALL MINISPLIT AT CLOSING. COME AND TOUR THIS HOME TODAY!
-
2026-01-25price $145,000 316-char remark
Show marketing remark (316 chars)
LOOKING FOR AN AFFORDABLE HOME OR INVESTMENT PROPERTY? COZY AND COMFORTABLE 3/1 BEDROOM LOCATED IN CUL DE SAC. RECENT LAMINATE FLOORING THROUGHOUT. QUARTZ COUNTERTOPS AND SUBWAY TILE BACKSPLASH IN KITCHEN AND BATHROOM! LARGE FENCED BACKYARD. SELLER WILL INSTALL MINISPLIT AT CLOSING. COME AND TOUR THIS HOME TODAY!
-
2026-01-13$149,000 Active 316-char remark
Show marketing remark (316 chars)
LOOKING FOR AN AFFORDABLE HOME OR INVESTMENT PROPERTY? COZY AND COMFORTABLE 3/1 BEDROOM LOCATED IN CUL DE SAC. RECENT LAMINATE FLOORING THROUGHOUT. QUARTZ COUNTERTOPS AND SUBWAY TILE BACKSPLASH IN KITCHEN AND BATHROOM! LARGE FENCED BACKYARD. SELLER WILL INSTALL MINISPLIT AT CLOSING. COME AND TOUR THIS HOME TODAY!
-
2026-01-02historical
-
2025-11-21price $149,900
-
2025-10-29price $154,000
-
2025-09-15price $159,000
-
2025-08-13price $164,000
-
2025-07-05$169,000 Active
-
2025-07-02historical
-
2025-06-27$185,000 Active
-
2013-10-28soldstatus
-
2002-02-07soldstatus
-
2001-11-19historical
-
2000-08-30$35,500
-
2000-05-22soldstatus
-
1998-03-01soldstatus $4,500
ⓘ Source: listings_history table (triggers on properties + properties_extension) + one-shot
backfill from property_details.listing_events for pre-trigger history.
Tax reassessment forecast TX · Resets to sale price
- Current annual tax
- $1,851 · $154/mo
- Projected year-2 tax
- $2,288 · $191/mo
- Expected delta
- +$436/yr (+$36/mo · 23.6%)
ⓘ Screening estimate from a state-policy table — verify with the county assessor before closing.
Climate risk First Street
- Flood 5/10 Major FEMA zone X (unshaded) · 53% chance over 30 yrs
- Wildfire 3/10 Moderate
- Heat 9/10 Extreme 7 d/yr ≥109°F today · 22 d/yr by 30 yrs out
- Wind 9/10 Extreme 99% chance of damaging wind over 30 yrs
- Air quality 2/10 Low 2 unhealthy d/yr today · 2 by 30 yrs out
Nearby sold comps map
Loading sold comps map…
Walkable amenities ~0.75 mi
Loading nearby amenities…
Taxation est. · year 1
- Rental income
- $15,346
- − Mortgage interest
- −$7,002
- − Property taxes
- −$1,851
- − Insurance
- −$625
- − Repairs & maintenance
- −$1,228
- − Management
- −$1,228
- − Depreciation
- −$3,636
- Taxable loss
- −$224
- Est. tax savings @ 24.0%
- +$54
- After-tax cash flow
- $1,835/yr
For passive investors: Depreciation is non-cash, so a rental often shows a tax loss while cash-flowing — sheltering income. Rental losses are passive: they offset passive income freely, and up to $25,000/yr can offset ordinary (W-2) income if you actively participate and your MAGI is under $100k (phasing out to $0 by $150k); unused losses carry forward. On sale, claimed depreciation is recaptured at up to 25%, and gains may owe capital-gains tax (a 1031 exchange can defer both). Figures are a year-1 estimate at your 24.0% rate — not tax advice; consult a CPA.
Schools (NCES district)
- District
- Galena Park ISD
- NCES district ID
- 4820250
- Math proficiency
- 32% ▼ -20.00%
- Reading proficiency
- 33% ▼ -7.00%
- Median HH income
- $43,158
- Composite
- 27.62/100
- National rank
- #6927
- State rank
- #578 of 826 in TX
Livability — Houston
- Score
- 74/100
- State rank
- #184
- US rank
- #4771
Category grades
Schools grade is shown separately in the Schools card above.
Census & demographics
- Census place
- Houston, TX
- County
- Harris County · 4,702,590 people
- City population
- 3,226,434
- Metro
- Houston-The Woodlands-Sugar Land, TX
- Population (ZIP)
- 16,154
- Household income
- $48,279
- Rent vs Own
- Severe rent burden
- 457.0
Population outlook (Harris County) Hauer SSP2
- Today (2025)
- 5,571,493 people
- By 2030
- 6,089,821 · +9.3%
- By 2040
- 7,142,806 · +28.2%
- By 2050
- 8,185,864 · +46.9%
- By 2075
- 10,574,329 · +89.8%
- By 2100
- 12,109,958 · +117.4%
Race, ethnicity, and origin ACS 2023
- Neighborhood character
- Predominantly Hispanic (72%)
- Race & ethnicity
- Hispanic / Latino 72% Two or more races 32% Black 22% White 5%
- Hispanic origin (detail)
- Mexican 66%
- Foreign-born
- 31% · Canada
- Languages at home
- 39% English-only · Spanish 61%
Political lean MEDSL · Harris
- 2024 margin
- Lean D (+5.5) · D 52.0% · R 46.4% · Other 1.6%
- 2008→2024 swing
- +3.9pp toward D · 2008: 1.6pp · 2024: 5.5pp
- All cycles
- 2024: D+5.5 2020: D+13.3 2016: D+12.4 2012: D+0.1 2008: D+1.6
Not yet ingested
- Civics
- —
Market trends
- HPI YoY
- ▲ 18.53%
- Current HPI
- 276.1811
- Rent YoY
- —
- Metro
- Houston-The Woodlands-Sugar Land, TX
- State GDP YoY
- ▲ 3.95%
- F500 in state
- 110
Industry mix (Fortune 500 HQ in TX)
| Industry | F500 HQs | Revenue |
|---|---|---|
| Energy | 16 | $1,198B |
|
||
| Technology | 5 | $198B |
|
||
| Engineering / Construction | 4 | $72B |
|
||
| Energy Services | 3 | $60B |
|
||
| Utilities | 3 | $41B |
|
||
| Healthcare | 2 | $330B |
|
||
Price history
+2677.8% since first listed20 events — show timeline
- 2026-05-06 Price Changed $125,000 HARMLS
- 2026-04-12 Price Changed $129,000 HARMLS
- 2026-02-28 Price Changed $134,900 HARMLS
- 2026-02-12 Price Changed $139,000 HARMLS
- 2026-01-25 Price Changed $145,000 HARMLS
- 2026-01-13 Listed $149,000 HARMLS
- 2026-01-02 Listing Removed — HARMLS
- 2025-11-21 Price Changed $149,900 HARMLS
- 2025-10-29 Price Changed $154,000 HARMLS
- 2025-09-15 Price Changed $159,000 HARMLS
- 2025-08-13 Price Changed $164,000 HARMLS
- 2025-07-05 Listed $169,000 HARMLS
- 2025-07-02 Listing Removed — HARMLS
- 2025-06-27 Listed $185,000 HARMLS
- 2013-10-28 Sold (Public Records) — Public Records
- 2002-02-07 Sold (Public Records) — Public Records
- 2001-11-19 Listing Removed — HARMLS
- 2000-08-30 Listed $35,500 HARMLS
- 2000-05-22 Sold (Public Records) — Public Records
- 1998-03-01 Sold (Public Records) $4,500 Public Records
Property tax history
+9.9%/yrLatest (2025): $1,851 · -9.9% YoY. Source: county tax records.
Cash-flow waterfall
monthlySold comps — $/sqft
last 12 mo · ≤1 miLoading sold comps…