7635 Blackhawk Rd · Micco, FL
Flood risk 1/10 · Minimal
- FEMA flood zone
- X (unshaded)
- Chance of flooding over 30 yrs
- 0.0%
- Est. flood insurance / yr
- $507 – $1,088
Fire risk 4/10 · Minor
- Est. fire insurance / yr
- $947 – $1,759
Heat risk 10/10 · Severe
- Hot days now (above 105°F)
- 7 days/yr
- Hot days in 30 yrs
- 25 days/yr
Wind risk 10/10 · Severe
- Chance of severe wind over 30 yrs
- 99.0%
Air-quality risk 1/10 · Minimal
- Unhealthy air days now
- 0 days/yr
- Unhealthy air days in 30 yrs
- 0 days/yr
Risk factors via First Street. Map © Google.
Why this score? — see what drove the C- grade
The composite is a weighted blend of 9 inputs, each scored 0–100. Each bar is that input's sub-score; the figure is the points it added to the 100-point composite (weight × sub-score).
- Cash flow +18.8/30.0
- ARV discount +7.5/15.0
- DSCR +5.9/10.0
- 1% rule +4.9/10.0
- Schools +4.7/10.0
- Livability +3.2/5.0
- Rent growth +2.5/5.0
- Condition / age +2.5/5.0
- Appreciation +0.0/10.0
$185,000
🖨 Deal sheet 📄 Offer letter ✓ Due diligence
Listing remarks
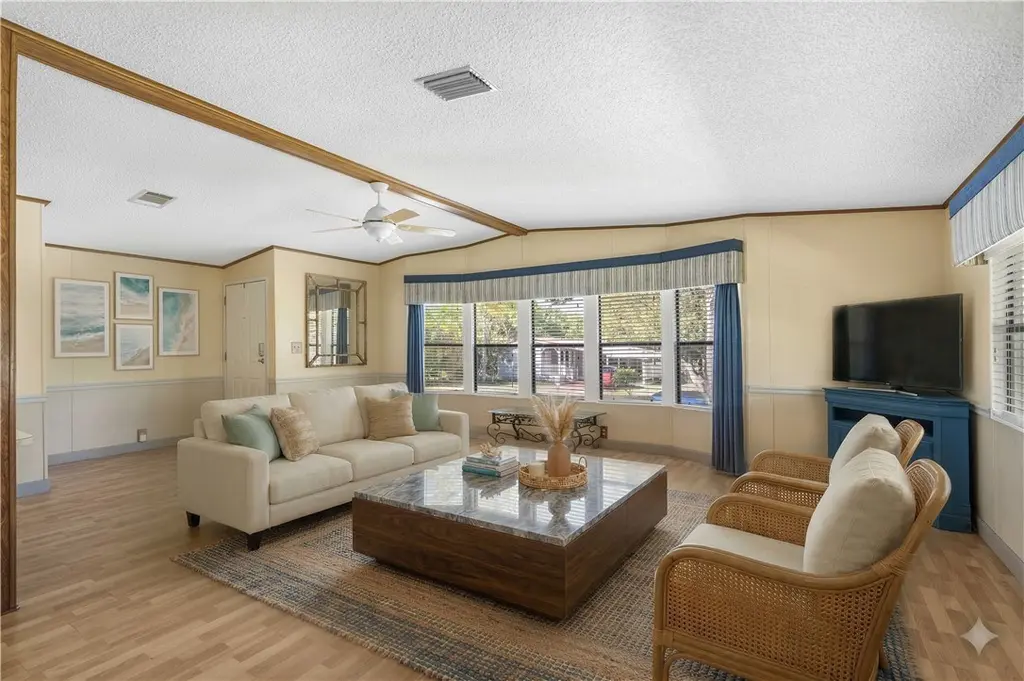
Discover coastal living in this light & bright home, perfectly situated just 2 houses from the Indian River Lagoon, a true paradise for fishermen and boaters. Enjoy peek-a-boo water views & a prime location just minutes from the Sebastian Inlet & waterfront dining. This open-concept home features vaulted, beamed ceilings & a raised enclosed porch for year-round enjoyment. Recent upgrades offer peace of mind, including a 2024 4-point inspection, '19 HVAC, '23 refrigerator & stove, and new LVP flooring. Community dues cover fantastic amenities: pool, sauna, fitness room, pickle ball courts.
Key facts
- Open-concept home
- Prime location
- Indian river lagoon
Tags
Property features AI
Finance
- Other: Assessed value available
- Financial info: Lease considered; Pets allowed (with number limit)
- HOA & community: Snug Harbor Master association; Monthly association fee of $80; Association fee covers common areas, recreation facilities, reserve fund, and trash; Community amenities include fitness center, game room, library, and pool; Senior community; Dues paid monthly
Exterior
- Parking: Assigned parking; Carport (1 space); Driveway
- Security: Smoke detector(s)
- Utilities: Public water; Public sewer
- Home design: Manufactured home; 1 story; Faces west
- Construction: Manufactured construction
- Exterior features: Porch (enclosed); Awning(s); Shed(s); Community pool; Property has a view; Lot less than quarter acre; Lot dimensions approximately 65 x 116
Interior
- Kitchen: Range; Microwave; Dishwasher; Refrigerator; Water purifier; Electric water heater
- Bedrooms: Bedroom (13 x 13); Bedroom (13 x 14)
- Flooring: Laminate; Tile
- Bathrooms: 2 full bathrooms
- Heating & cooling: Central heating (electric); Central air (electric, one unit)
- Interior features: Bay windows; Tinted windows; Window treatments; Walk-in closet(s); Unfurnished
- Laundry & utility: Laundry room; Washer; Dryer
Neighborhood map
What this means for you Summary
Snapshot
- This is a 2-bed/2.0-bath manufactured listed at $185k.
Deal economics
- At list price, monthly cash flow is $186 ($2k/yr) — positive.
- The deal already cash-flows at list — no discount required.
- To meet the 1% rule (rent ≥ 1% of price), the offer needs to be $183k (1.2% below list).
- Recommended offer: $174k (6.0% below list) — sets the bar for market timing.
Location & tenants
- Location reads 65/100 on livability (#633 in FL) — a middle-class / working-renter tenant base. Strengths: cost of living A+, housing A+; Watch: employment D, schools F, amenities F.
- Brevard (suburban): math 53% / reading 57% proficiency, ranked #19 of 73 in FL (top 26%) — acceptable for families but not a draw, mixed tenant base, ~2y average lease.
- Market conditions: 185 active listings in the ZIP; 19 comparable units currently listed for rent nearby; rentals at typical pace (median 24d on market — plan ~3-4 weeks tenant-placement turnaround); 4,602 units permitted in Brevard County in 2024 (702 in 5+ unit buildings).
Forward outlook
- Local home prices are declining (-3.0%/yr); year-one equity from $1k of loan paydown is wiped out by about $6k of value loss. Plan a longer hold.
- Brevard County population projected at +15% by 2050 — modest demand growth; plan on rents tracking national, not racing it.
Negotiation context
- It's been on market 87 days — a 6% lower offer ($174k) is reasonable based on typical stale-listing flexibility.
- 4 sale attempts since 9y ago with the ask held roughly flat each time — persistent listings suggest the price (not the market) is what's stuck; bring a comps-based counter.
- Current owner paid $105k; list at $185k implies a 76% gain — meaningful room to come down on a strong offer.
Risks & watch-outs
- Climate carrying-cost: severe wind risk, 99% chance of damaging wind over 30y; extreme-heat days projected 7→25/yr by 2055 (HVAC capex compounding) — expect insurance premiums to compound above CPI over the hold.
Questions for the listing agent
- It's been on market 87 days. Have you received any prior offers? Is the seller open to a 6% concession, seller financing, or rate buy-down credit?
- What does the HOA fee cover, when was the last increase, and are there any pending special assessments or reserve-fund shortfalls?
- Why hasn't it sold? Are there any deal-killer items the seller is aware of (foundation, flood, title, zoning, code violations)?
- Is there a deadline driving the sale (1031 exchange, divorce, estate, relocation)? That informs how much negotiation room exists.
- Schools are F-rated, which usually means shorter tenancies and higher turnover. Who's the typical renter profile here, and what's been the actual vacancy rate?
- What's the average days-on-market for RENTAL listings here right now (not sales)? A rising rental-DOM trend means longer vacancies and softer asking-rent achievability than the comps imply.
- What's the recent tenant-quality profile in this submarket — average credit score on applications, eviction rate, late-payment / NSF rate, and stable-employment percentage? A property-management company in the area should have these aggregated.
- How much new for-sale + rental construction is in the pipeline within 1–3 miles? Heavy new supply typically softens prices + rents 12–24 months out; constrained supply supports both.
Investment metrics
- 1% rule
- 0.99% ✗
- Cap rate
- 7.50%
- Cash-on-cash
- 4.31%
- DSCR
- 1.19
- GRM
- 8.4
CMA / ARV
No comps found within radius.
Projected returns pro-forma
-3.0% appreciation · 3.0% rent growth · sell at horizon
- IRR
- -9.6%
- Equity multiple
- 0.65×
- Total profit
- $-18,120
- Equity at exit
- $27,584
- IRR
- -0.1%
- Equity multiple
- 0.99×
- Total profit
- $-468
- Equity at exit
- $15,995
Cash invested: $51,800 (down + closing). Projections, not guarantees.
Landlord ↔ Tenant lean methodology
- Overall (STATE)
- 87 Strongly Landlord-Friendly
- State Florida
- 87 Strongly Landlord-Friendly · R+3
- County
- — inherits STATE
- City
- — inherits STATE
ZIP-level market 32976
- Home prices YoY
- -18.6%
- Active inventory
- 185
- Price-to-rent
- 8.4×
Monthly cashflow live
- Estimated rent
- $1,827 high interval (Pro) →
- Mortgage (P&I)
- −$970
- Tax from tax record
- −$130 /mo · $1,563/yr
- Insurance
- −$77
- HOA
- −$80
- Vacancy / Maint / Mgmt
- −$384
- Net cashflow
- $186
Break-even live
UW: 25.0% down · 7.5% · 30yr · 1.5% tax · 5.0% vac · 8.0% maint · 8.0% mgmt
Financing live
Cash to close
- Down payment
- $46,250
- Closing costs
- $5,550
- Reserves months
- —
- Total cash needed
- —
Loan-product check · same deal, 3 products live
Conventional
25% down · 7.5% · 30yr
- Down + closing
- —
- Monthly P&I
- —
- Monthly cashflow
- —
- DSCR
- —
- Eligible?
- —
Personal DTI + credit; lowest rate.
DSCR
20% down · 8.5% · 30yr
- Down + closing
- —
- Monthly P&I
- —
- Monthly cashflow
- —
- DSCR
- —
- Eligible?
- —
No personal income docs; deal must DSCR.
Hard money
10% down · 12.0% · 12mo
- Down + closing
- —
- Monthly P&I
- —
- Monthly cashflow
- —
- DSCR
- —
- Eligible?
- —
Short-term bridge; refi at stabilization.
Rent comps 19 comps
| Address | Beds | Baths | Sqft | Rent | $/sqft | DOM | Units | Dist |
|---|---|---|---|---|---|---|---|---|
| 7597 Cedar Bark Rd Sebastian, FL | 2.0 | 2.0 | 902 | $1,700 | $1.88 | 23d | 1 | 0.16mi |
| 7606 Cedar Bark Rd Sebastian, FL | 2.0 | 2.0 | 1273 | $1,800 | $1.41 | 23d | 1 | 0.18mi |
| 7629 Chasta Rd Sebastian, FL | 2.0 | 2.0 | 958 | $1,600 | $1.67 | 23d | 1 | 0.20mi |
| 415 Plover Dr Sebastian, FL | 3.0 | 2.0 | 1200 | $2,400 | $2.00 | 23d | 1 | 0.32mi |
| 7419 Tourmaline Dr Unit Annual Grant-Valkaria, FL | 3.0 | 2.0 | 1676 | $2,200 | $1.31 | 23d | 1 | 0.52mi |
| 7349 Tourmaline Dr Grant, FL | 3.0 | 2.0 | 1735 | $2,200 | $1.27 | 23d | 1 | 0.57mi |
| 7181 Blue Shore Rd Grant, FL | 3.0 | 2.0 | 1598 | $1,995 | $1.25 | 23d | 1 | 0.62mi |
| 909 Sequoia St Sebastian, FL | 2.0 | 2.0 | 1156 | $1,845 | $1.60 | 23d | 1 | 0.74mi |
| 621 Hyacinth Cir Sebastian, FL | 2.0 | 2.0 | 1324 | $1,850 | $1.40 | 23d | 1 | 0.79mi |
| 706 Hyacinth Cir Sebastian, FL | 2.0 | 2.0 | 1062 | $1,750 | $1.65 | 23d | 1 | 0.85mi |
| 629 W Marlin Cir Unit NA Sebastian, FL | 2.0 | 2.0 | 1104 | $1,400 | $1.27 | 14d | 1 | 0.87mi |
| 805 Beech Ct Sebastian, FL | 2.0 | 2.0 | 1556 | $1,995 | $1.28 | 23d | 1 | 0.92mi |
| 904 Red Bud Rd Sebastian, FL | 3.0 | 2.0 | 1278 | $1,500 | $1.17 | 23d | 1 | 0.94mi |
| 914 Pecan Cir Sebastian, FL | 2.0 | 1.0 | 1000 | $1,600 | $1.60 | 23d | 1 | 1.11mi |
| 830 Lychee Dr Sebastian, FL | 2.0 | 2.0 | 1269 | $2,000 | $1.58 | 23d | 1 | 1.16mi |
| 1207 Marigold Dr Sebastian, FL | 2.0 | 2.0 | 1104 | $1,500 | $1.36 | 23d | 1 | 1.18mi |
| 8520 US Highway 1 Unit D5 Sebastian, FL | 2.0 | 2.0 | 1533 | $1,250 | $0.82 | 14d | 1 | 1.19mi |
| 8520 US Highway 1 #10 Sebastian, FL | 2.0 | 2.0 | 1091 | $1,800 | $1.65 | 23d | 1 | 1.19mi |
| 702 Lark Dr Sebastian, FL | 3.0 | 2.0 | 1296 | $1,775 | $1.37 | 23d | 1 | 1.28mi |
HOA detail
- Monthly dues
- $80 · $960/yr
- Likely covers
- waterpool
Listing history 24 events
-
2026-06-18days on market $185,000 Active 87 DOM
-
2026-06-17days on market $185,000 Active 86 DOM
-
2026-06-16days on market $185,000 Active 85 DOM
-
2026-06-15days on market $185,000 Active 84 DOM
-
2026-06-14days on market $185,000 Active 82 DOM
-
2026-06-10pricedays on market $185,000 Active 79 DOM
-
2026-06-08days on market $190,000 Active 77 DOM
-
2026-06-07days on market $190,000 Active 76 DOM
-
2026-06-05days on market $190,000 Active 73 DOM
-
2026-06-03days on market $190,000 Active 72 DOM
-
2026-06-02days on market $190,000 Active 71 DOM
-
2026-06-01days on market $190,000 Active 70 DOM
-
2026-05-31days on market $190,000 Active 69 DOM
-
2026-05-31days on market $190,000 Active 68 DOM
-
2026-03-24$190,000 Active
-
2026-03-23$190,000 Active
-
2019-05-03soldstatus $105,000
-
2017-04-27soldstatus $88,000
-
2017-04-26soldstatus $88,000
-
2017-04-11historical
-
2017-03-02$89,500
-
2017-03-02$89,500
-
2003-03-11soldstatus $68,000
-
1996-09-16soldstatus $45,000
ⓘ Source: listings_history table (triggers on properties + properties_extension) + one-shot
backfill from property_details.listing_events for pre-trigger history.
Tax reassessment forecast FL · Resets to sale price
- Current annual tax
- $1,563 · $130/mo
- Projected year-2 tax
- $1,563 · $130/mo
- Expected delta
- $0/yr ($0/mo · 0.0%)
ⓘ Screening estimate from a state-policy table — verify with the county assessor before closing.
Climate risk First Street
- Flood 1/10 Low FEMA zone X (unshaded) · 0% chance over 30 yrs
- Wildfire 4/10 Moderate
- Heat 10/10 Extreme 7 d/yr ≥105°F today · 25 d/yr by 30 yrs out
- Wind 10/10 Extreme 99% chance of damaging wind over 30 yrs
- Air quality 1/10 Low 0 unhealthy d/yr today · 0 by 30 yrs out
Nearby sold comps map
Loading sold comps map…
Walkable amenities ~0.75 mi
Loading nearby amenities…
Taxation est. · year 1
- Rental income
- $21,926
- − Mortgage interest
- −$10,363
- − Property taxes
- −$1,563
- − Insurance
- −$925
- − Repairs & maintenance
- −$1,754
- − Management
- −$1,754
- − HOA
- −$960
- − Depreciation
- −$5,382
- Taxable loss
- −$775
- Est. tax savings @ 24.0%
- +$186
- After-tax cash flow
- $2,417/yr
For passive investors: Depreciation is non-cash, so a rental often shows a tax loss while cash-flowing — sheltering income. Rental losses are passive: they offset passive income freely, and up to $25,000/yr can offset ordinary (W-2) income if you actively participate and your MAGI is under $100k (phasing out to $0 by $150k); unused losses carry forward. On sale, claimed depreciation is recaptured at up to 25%, and gains may owe capital-gains tax (a 1031 exchange can defer both). Figures are a year-1 estimate at your 24.0% rate — not tax advice; consult a CPA.
Schools (NCES district)
- District
- Brevard
- NCES district ID
- 1200150
- Math proficiency
- 53% ▼ -9.00%
- Reading proficiency
- 57% ▼ -4.00%
- Median HH income
- $49,426
- Composite
- 46.86/100
- National rank
- #2370
- State rank
- #19 of 73 in FL
Livability — Micco
- Score
- 65/100
- State rank
- #633
- US rank
- #12408
Category grades
Schools grade is shown separately in the Schools card above.
Census & demographics
- Census place
- Micco, FL
- Population (ZIP)
- 9,237
Population outlook (Brevard County) Hauer SSP2
- Today (2025)
- 623,254 people
- By 2030
- 648,420 · +4.0%
- By 2040
- 690,009 · +10.7%
- By 2050
- 715,669 · +14.8%
- By 2075
- 775,744 · +24.5%
- By 2100
- 776,687 · +24.6%
Race, ethnicity, and origin ACS 2023
- Neighborhood character
- Predominantly White (93%)
- Race & ethnicity
- White 93% Hispanic / Latino 4% Two or more races 1% Asian 1%
- Common ancestry
- Lithuanian 5% Romanian 4% Iranian 2%
- Foreign-born
- 4% · Canada, Jamaica
- Languages at home
- 95% English-only · Spanish 3%
Political lean MEDSL · Brevard
- 2024 margin
- Strong R (+20.8) · D 39.1% · R 59.9% · Other 1.0%
- 2008→2024 swing
- -10.4pp toward R · 2008: -10.4pp · 2024: -20.8pp
- All cycles
- 2024: R+20.8 2020: R+16.4 2016: R+19.8 2012: R+12.7 2008: R+10.4
Not yet ingested
- Civics
- —
Market trends
- HPI YoY
- ▼ -73.57%
- Current HPI
- 321.5196
- Rent YoY
- —
- Metro
- —
- State GDP YoY
- ▲ 3.28%
- F500 in state
- 36
Industry mix (Fortune 500 HQ in FL)
| Industry | F500 HQs | Revenue |
|---|---|---|
| Industrial Technology | 2 | $29B |
|
||
| Insurance | 2 | $17B |
|
||
| Retail | 1 | $60B |
|
||
| Technology Distribution | 1 | $58B |
|
||
| Homebuilding | 1 | $35B |
|
||
| Technology Manufacturing | 1 | $35B |
|
||
Price history
+322.2% since first listed10 events — show timeline
- 2026-03-24 Listed $190,000 SCMLS
- 2026-03-23 Listed $190,000 RAIRCMLS
- 2019-05-03 Sold (Public Records) $105,000 Public Records
- 2017-04-27 Sold (Public Records) $88,000 Public Records
- 2017-04-26 Sold (MLS) $88,000 RAIRCMLS
- 2017-04-11 Listing Removed — Beaches MLS
- 2017-03-02 Listed $89,500 Beaches MLS
- 2017-03-02 Listed $89,500 SCMLS
- 2003-03-11 Sold (Public Records) $68,000 Public Records
- 1996-09-16 Sold (Public Records) $45,000 Public Records
Property tax history
+7.7%/yrLatest (2025): $1,563 · +7.1% YoY. Source: county tax records.
Cash-flow waterfall
monthlySold comps — $/sqft
last 12 mo · ≤1 miLoading sold comps…