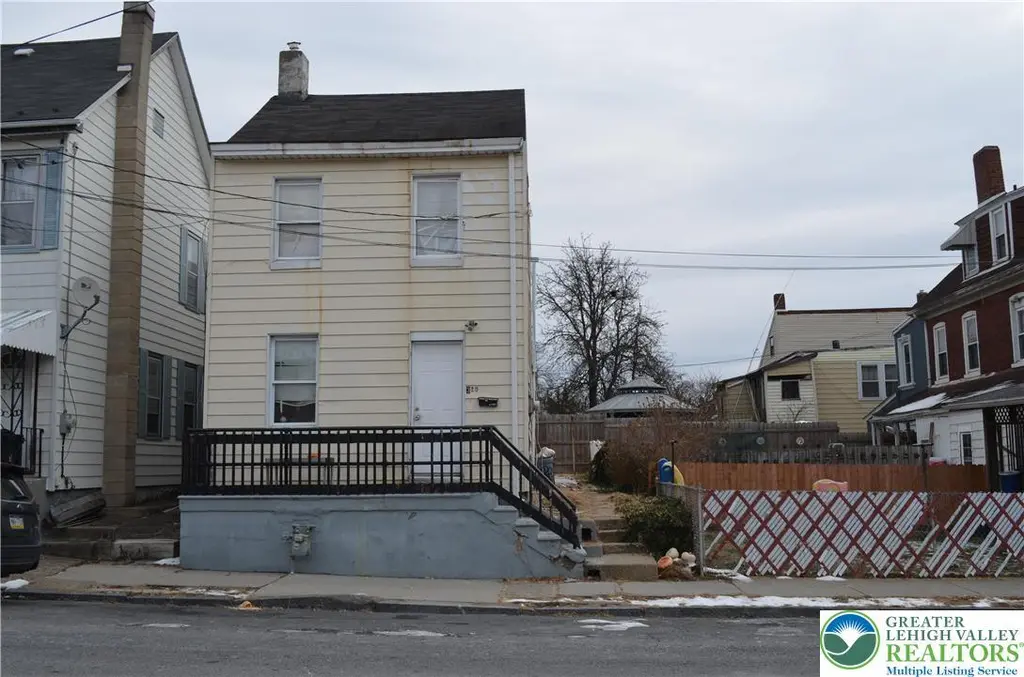
320 S 11th St · Easton, PA
Flood risk 1/10 · Minimal
- FEMA flood zone
- X (unshaded)
- Chance of flooding over 30 yrs
- 0.0%
- Est. flood insurance / yr
- $473 – $860
Fire risk 1/10 · Minimal
- Est. fire insurance / yr
- $511 – $949
Heat risk 5/10 · Moderate
- Hot days now (above 100°F)
- 7 days/yr
- Hot days in 30 yrs
- 15 days/yr
Wind risk 4/10 · Minor
- Chance of severe wind over 30 yrs
- 16.0%
Air-quality risk 3/10 · Minor
- Unhealthy air days now
- 3 days/yr
- Unhealthy air days in 30 yrs
- 5 days/yr
Risk factors via First Street. Map © Google.
Why this score? — see what drove the C+ grade
The composite is a weighted blend of 9 inputs, each scored 0–100. Each bar is that input's sub-score; the figure is the points it added to the 100-point composite (weight × sub-score).
- Cash flow +20.1/30.0
- ARV discount +15.0/15.0
- DSCR +6.4/10.0
- 1% rule +5.5/10.0
- Livability +4.2/5.0
- Rent growth +3.7/5.0
- Schools +3.3/10.0
- Condition / age +2.5/5.0
- Appreciation +0.0/10.0
$195,000
🖨 Deal sheet (PDF) 📄 Offer letter ✓ Due diligence
Listing remarks MLS
Turnkey Single-Unit Investment Opportunity This 4-bedroom, 1-bath single-unit property offers an excellent turnkey investment opportunity, currently rented and producing immediate income. The functional layout and multiple bedrooms support strong rental demand and consistent occupancy. Ideally located near major commuter routes including Routes 22, 33, and 78, the property provides convenient access to surrounding employment centers, a thriving downtown Easton, making it especially appealing to long-term tenants. Its location and bedroom count combine to support reliable cash flow and long-term value. A solid addition to any investment portfolio, this property delivers income from day one with potential for future appreciation in a well-connected area. Can be combined with mls#: 769986 for a package deal.
Key facts
- Reliable cash flow
- Multiple bedrooms
- Convenient access
Tags
Neighborhood map
What this means for you Summary
Snapshot
- This is a 4-bed/1.0-bath single-family listed at $195k.
Deal economics
- At list price, monthly cash flow is $244 ($3k/yr) — positive.
- The deal already cash-flows at list — no discount required.
- Meets the 1% rule at list price ($2k rent vs $195k).
- Recommended offer: $172k (12.0% below list) — sets the bar for market timing.
- Cap rate 7.8% vs local median 4.2% in Easton — top-decile yield for the area; either an underpriced asset or a hidden risk that comps aren't pricing in. Stress-test before assuming the spread holds.
Location & tenants
- Location reads 84/100 on livability (#92 in PA, #667 nationally) — a professional / high-income tenant draw. Strengths: amenities A+, cost of living A+, housing A+; Watch: schools C-.
- Easton Area SD (suburban): math 31% / reading 44% proficiency, ranked #364 of 539 in PA (top 68%) — families likely to look elsewhere, expect single-tenant / working-renter base with shorter leases.
- Market conditions: Rents rising fast (+4.9%/yr); 185 active listings in the ZIP; 34 comparable units currently listed for rent nearby; rentals at typical pace (median 25d on market — plan ~3-4 weeks tenant-placement turnaround); solid renter incomes; 567 units permitted in Northampton County in 2024 (151 in 5+ unit buildings).
- This rent runs 32% of the median local income ($78k/yr) — at the standard rent-burdened threshold; future hikes will face affordability resistance.
Forward outlook
- Local home prices are declining (-3.0%/yr); year-one equity from $1k of loan paydown is wiped out by about $6k of value loss. Plan a longer hold.
Negotiation context
- It's been on market 164 days — a 12% lower offer ($172k) is reasonable based on typical stale-listing flexibility.
- 5 sale attempts since 26y ago; this cycle's ask has dropped $30k (13%) from the opening price — seller is motivated, your offer sets the floor, not the list.
- Current owner paid $100k; list at $195k implies a 95% gain — meaningful room to come down on a strong offer.
Risks & watch-outs
- Watch-outs: built in 1900 — expect roof / HVAC / electrical / plumbing capex.
- Climate carrying-cost: extreme-heat days projected 7→15/yr by 2055 (HVAC capex compounding) — expect insurance premiums to compound above CPI over the hold.
Questions for the listing agent
- It's been on market 164 days. Have you received any prior offers? Is the seller open to a 12% concession, seller financing, or rate buy-down credit?
- Built in 1900 — when were the roof, HVAC, electrical panel, plumbing, and water heater last replaced?
- Why hasn't it sold? Are there any deal-killer items the seller is aware of (foundation, flood, title, zoning, code violations)?
- Is there a deadline driving the sale (1031 exchange, divorce, estate, relocation)? That informs how much negotiation room exists.
- What's the average days-on-market for RENTAL listings here right now (not sales)? A rising rental-DOM trend means longer vacancies and softer asking-rent achievability than the comps imply.
- What's the recent tenant-quality profile in this submarket — average credit score on applications, eviction rate, late-payment / NSF rate, and stable-employment percentage? A property-management company in the area should have these aggregated.
- How much new for-sale + rental construction is in the pipeline within 1–3 miles? Heavy new supply typically softens prices + rents 12–24 months out; constrained supply supports both.
Investment metrics
- 1% rule
- 1.05% ✓
- Cap rate
- 7.79%
- Cash-on-cash
- 5.36%
- DSCR
- 1.24
- GRM
- 7.9
CMA / ARV
- ARV (median comp)
- $236,452
- List price
- $195,000
- Delta
- -17.53%
- Verdict
- UNDERPRICED
- Comps
- 20 within 1.0 mi
Show comp detail 12 sales within ~0.75 mi
| Address | Dist | Beds/Ba | Sqft | Sold | Price | $/sf | Match |
|---|---|---|---|---|---|---|---|
| 129 S 13th St | 0.27mi | 4/1.0 | 1,488 (+8%) | 5mo | $240,000 | $161 | 71 |
| 204 N 9th St | 0.49mi | 3/1.0 (-1) | 1,450 (+5%) | 2mo | $267,000 | $184 | 62 |
| 541 Wilkes Barre St | 0.51mi | 3/1.5 (-1) | 1,401 (+1%) | 8mo | $220,000 | $157 | 61 |
| 1524 Bushkill St | 0.67mi | 4/1.0 | 1,450 (+5%) | 4mo | $306,000 | $211 | 57 |
| 1133 Spring Garden St | 0.46mi | 3/1.5 (-1) | 1,486 (+8%) | 4mo | $220,000 | $148 | 56 |
| 722 Wolf Ave | 0.28mi | 3/2.0 (-1) | 1,540 (+11%) | 4mo | $230,000 | $149 | 56 |
| 737 W Lincoln St | 0.61mi | 3/1.5 (-1) | 1,336 (-3%) | 7mo | $212,000 | $159 | 53 |
| 138 S 17th St | 0.60mi | 3/1.5 (-1) | 1,442 (+4%) | 7mo | $287,500 | $199 | 52 |
| 245 W Nesquehoning St | 0.72mi | 3/1.0 (-1) | 1,328 (-4%) | 9mo | $120,000 | $90 | 48 |
| 804 Lincoln St | 0.63mi | 3/1.0 (-1) | 1,192 (-14%) | 2mo | $192,500 | $161 | 41 |
| 103 N Oak St | 0.54mi | 3/1.5 (-1) | 1,196 (-14%) | 6mo | $185,925 | $155 | 40 |
| 249 Nesquehoning St | 0.71mi | 3/1.0 (-1) | 1,236 (-11%) | 9mo | $120,000 | $97 | 37 |
Match score weights: distance 35% · size 25% · config 20% · recency 20%. Top-matched comps best support the ARV.
Projected returns pro-forma
-3.0% appreciation · 4.94% rent growth · sell at horizon
- IRR
- -5.8%
- Equity multiple
- 0.78×
- Total profit
- $-11,965
- Equity at exit
- $29,075
- IRR
- 6.1%
- Equity multiple
- 1.50×
- Total profit
- $27,123
- Equity at exit
- $16,860
Cash invested: $54,600 (down + closing). Projections, not guarantees.
Landlord ↔ Tenant lean methodology
- Overall (STATE)
- 62 Landlord-Friendly
- State Pennsylvania
- 62 Landlord-Friendly · EVEN
- County
- — inherits STATE
- City
- — inherits STATE
ZIP-level market 18042
- Rents YoY
- 4.9%
- Active inventory
- 185
- Price-to-rent
- 7.9×
Monthly cashflow live
- Estimated rent
- $2,045 high interval (Pro) →
- Mortgage (P&I)
- −$1,023
- Tax from tax record
- −$268 /mo · $3,217/yr
- Insurance
- −$81
- HOA
- −$0
- Vacancy / Maint / Mgmt
- −$429
- Net cashflow
- $244
Break-even live
Sensitivity live
| Price | -10% $354 | -5% $299 | +0% $244 | +5% $188 | +10% $133 |
|---|---|---|---|---|---|
| Rent | -10% $82 | -5% $163 | +0% $244 | +5% $324 | +10% $405 |
| Rate | -1.0pp $342 | -0.5pp $293 | base $244 | +0.5pp $193 | +1.0pp $142 |
UW: 25.0% down · 7.5% · 30yr · 1.5% tax · 5.0% vac · 8.0% maint · 8.0% mgmt
Financing live
Cash to close
- Down payment
- $48,750
- Closing costs
- $5,850
- Reserves months
- —
- Total cash needed
- —
Loan-product check · same deal, 3 products live
Conventional
25% down · 7.5% · 30yr
- Down + closing
- —
- Monthly P&I
- —
- Monthly cashflow
- —
- DSCR
- —
- Eligible?
- —
Personal DTI + credit; lowest rate.
DSCR
20% down · 8.5% · 30yr
- Down + closing
- —
- Monthly P&I
- —
- Monthly cashflow
- —
- DSCR
- —
- Eligible?
- —
No personal income docs; deal must DSCR.
Hard money
10% down · 12.0% · 12mo
- Down + closing
- —
- Monthly P&I
- —
- Monthly cashflow
- —
- DSCR
- —
- Eligible?
- —
Short-term bridge; refi at stabilization.
Rent comps 34 comps
| Address | Beds | Baths | Sqft | Rent | $/sqft | DOM | Units | Dist |
|---|---|---|---|---|---|---|---|---|
| 1108 Butler St Unit 7 Easton, PA | 3.0 | 1.0 | 1146 | $1,575 | $1.37 | 45d | 1 | 0.03mi |
| 1051 Washington St Easton, PA | 3.0 | 1.0 | 900 | $1,550 | $1.72 | 15d | 1 | 0.06mi |
| 1237 Butler St Unit 2 Easton, PA | 3.0 | 1.0 | 900 | $1,700 | $1.89 | 4d | 1 | 0.17mi |
| 810 Pine St Easton, PA | 3.0 | 1.0 | 1120 | $1,800 | $1.61 | 24d | 1 | 0.34mi |
| 810 Pine St Easton, PA | 3.0 | 1.0 | 1120 | $1,800 | $1.61 | 45d | 1 | 0.34mi |
| 35 N 9th St Easton, PA | 4.0 | 2.0 | 1512 | $2,250 | $1.49 | 4d | 1 | 0.42mi |
| 912 Spring Garden St Easton, PA | 4.0 | 2.0 | 1534 | $2,400 | $1.56 | 45d | 1 | 0.46mi |
| 122 N 13th St Easton, PA | 4.0 | 3.0 | 1736 | $2,300 | $1.32 | 4d | 1 | 0.47mi |
| 35 N 7th St Easton, PA | 3.0 | 1.0 | 1088 | $1,750 | $1.61 | 15d | 1 | 0.50mi |
| 204 N 9th St Easton, PA | 3.0 | 1.0 | 1450 | $1,900 | $1.31 | 4d | 1 | 0.50mi |
| 142 S Union St Easton, PA | 3.0 | 2.0 | 1300 | $1,895 | $1.46 | 45d | 1 | 0.51mi |
| 1619 Butler St Easton, PA | 3.0 | 1.0 | 965 | $2,050 | $2.12 | 24d | 1 | 0.53mi |
| 1616 Ferry St Unit 2 Easton, PA | 3.0 | 1.0 | 1316 | $1,700 | $1.29 | 4d | 1 | 0.58mi |
| 909 Jackson St Unit 2 Easton, PA | 3.0 | 1.0 | 1300 | $2,350 | $1.81 | 45d | 1 | 0.62mi |
| 276 W Saint Joseph St Easton, PA | 3.0 | 1.5 | 1315 | $1,700 | $1.29 | 45d | 1 | 0.65mi |
| 804 Reynolds St Easton, PA | 5.0 | 1.0 | 1260 | $2,200 | $1.75 | 24d | 1 | 0.77mi |
| 303 W Lincoln St Easton, PA | 3.0 | 1.0 | 1796 | $2,175 | $1.21 | 45d | 1 | 0.80mi |
| 322 Saint John St Easton, PA | 3.0 | 1.5 | 1583 | $1,895 | $1.20 | 45d | 1 | 0.81mi |
| 2001 Ferry St Easton, PA | 3.0 | 1.0 | 1440 | $2,200 | $1.53 | 45d | 1 | 0.92mi |
| 1065 Bushkill Dr Easton, PA | 3.0 | 1.5 | 1250 | $2,500 | $2.00 | 45d | 1 | 1.04mi |
| 2248 Birch St Easton, PA | 3.0 | 1.5 | 1425 | $1,850 | $1.30 | 45d | 1 | 1.04mi |
| 2125 Northampton St Easton, PA | 3.0 | 1.0 | 1440 | $2,000 | $1.39 | 15d | 1 | 1.09mi |
| 312 Lehigh Dr Easton, PA | 3.0 | 1.5 | 1664 | $3,250 | $1.95 | 4d | 1 | 1.11mi |
| 2406 Birch St Easton, PA | 3.0 | 1.5 | 1265 | $2,300 | $1.82 | 15d | 1 | 1.14mi |
| 2406 Birch St Easton, PA | 3.0 | 1.5 | 1265 | $2,300 | $1.82 | 4d | 1 | 1.14mi |
| 2246 2nd St Easton, PA | 3.0 | 1.5 | 1449 | $2,150 | $1.48 | 4d | 1 | 1.15mi |
| 2306 3rd St Easton, PA | 3.0 | 1.0 | 1240 | $2,000 | $1.61 | 15d | 1 | 1.17mi |
| 2434 Birch St Easton, PA | 3.0 | 1.0 | 1294 | $1,900 | $1.47 | 4d | 1 | 1.19mi |
| 43-45 S Main St Unit 3 Phillipsburg, NJ | 3.0 | 2.0 | 1200 | $2,200 | $1.83 | 24d | 1 | 1.22mi |
| 2474 Lincoln Ave Easton, PA | 3.0 | 1.0 | 1500 | $1,800 | $1.20 | 45d | 1 | 1.34mi |
| 700 Hamilton St Unit 2 Easton, PA | 4.0 | 2.0 | 1050 | $2,000 | $1.90 | 4d | 1 | 1.40mi |
| 210 Washington St Phillipsburg, NJ | 4.0 | 1.5 | 1000 | $2,300 | $2.30 | 4d | 1 | 1.46mi |
| 513 Cattell St Easton, PA | 3.0 | 1.5 | 1536 | $2,300 | $1.50 | 45d | 1 | 1.47mi |
| 199 Cedar Park Blvd Easton, PA | 1.0–3.0 | 1.0–4.0 | 1410 | $3,077 | $2.18 | 0d | 9 | 1.50mi |
Listing history 28 events
-
2026-06-18days on market $195,000 Active 164 DOM
-
2026-06-17days on market $195,000 Active 163 DOM
-
2026-06-16days on market $195,000 Active 162 DOM
-
2026-06-15days on market $195,000 Active 161 DOM
-
2026-06-14days on market $195,000 Active 159 DOM
-
2026-06-13days on market $195,000 Active 158 DOM
-
2026-06-10days on market $195,000 Active 156 DOM
-
2026-06-09days on market $195,000 Active 155 DOM
-
2026-06-08days on market $195,000 Active 154 DOM
-
2026-06-07days on market $195,000 Active 153 DOM
-
2026-06-05days on market $195,000 Active 150 DOM
-
2026-06-03days on market $195,000 Active 149 DOM
-
2026-06-02days on market $195,000 Active 148 DOM
-
2026-06-01days on market $195,000 Active 147 DOM
-
2026-05-31days on market $195,000 Active 146 DOM
-
2026-05-31days on market $195,000 Active 145 DOM
-
2026-04-22price $210,000 819-char remark
Show marketing remark (819 chars)
Turnkey Single-Unit Investment Opportunity This 4-bedroom, 1-bath single-unit property offers an excellent turnkey investment opportunity, currently rented and producing immediate income. The functional layout and multiple bedrooms support strong rental demand and consistent occupancy. Ideally located near major commuter routes including Routes 22, 33, and 78, the property provides convenient access to surrounding employment centers, a thriving downtown Easton, making it especially appealing to long-term tenants. Its location and bedroom count combine to support reliable cash flow and long-term value. A solid addition to any investment portfolio, this property delivers income from day one with potential for future appreciation in a well-connected area. Can be combined with mls#: 769986 for a package deal.
-
2026-01-03$225,000 Active 819-char remark
Show marketing remark (819 chars)
Turnkey Single-Unit Investment Opportunity This 4-bedroom, 1-bath single-unit property offers an excellent turnkey investment opportunity, currently rented and producing immediate income. The functional layout and multiple bedrooms support strong rental demand and consistent occupancy. Ideally located near major commuter routes including Routes 22, 33, and 78, the property provides convenient access to surrounding employment centers, a thriving downtown Easton, making it especially appealing to long-term tenants. Its location and bedroom count combine to support reliable cash flow and long-term value. A solid addition to any investment portfolio, this property delivers income from day one with potential for future appreciation in a well-connected area. Can be combined with mls#: 769986 for a package deal.
-
2012-05-15historical
-
2011-11-15$87,900
-
2009-11-20soldstatus $100,000
-
2009-09-26historical
-
2009-09-26historical
-
2009-07-25$84,500
-
2009-07-25$84,500
-
2009-01-14soldstatus $85,000
-
2001-01-01historical
-
2000-07-03$33,900
ⓘ Source: listings_history table (triggers on properties + properties_extension) + one-shot
backfill from property_details.listing_events for pre-trigger history.
Tax reassessment forecast PA · Partial reset (capped growth)
- Current annual tax
- $3,217 · $268/mo
- Projected year-2 tax
- $3,217 · $268/mo
- Expected delta
- $0/yr ($0/mo · 0.0%)
ⓘ Screening estimate from a state-policy table — verify with the county assessor before closing.
Climate risk First Street
- Flood 1/10 Low FEMA zone X (unshaded) · 0% chance over 30 yrs
- Wildfire 1/10 Low
- Heat 5/10 Major 7 d/yr ≥100°F today · 15 d/yr by 30 yrs out
- Wind 4/10 Moderate 16% chance of damaging wind over 30 yrs
- Air quality 3/10 Moderate 3 unhealthy d/yr today · 5 by 30 yrs out
Nearby sold comps map
Loading sold comps map…
Walkable amenities ~0.75 mi
Loading nearby amenities…
Taxation est. · year 1
- Rental income
- $24,540
- − Mortgage interest
- −$10,923
- − Property taxes
- −$3,217
- − Insurance
- −$975
- − Repairs & maintenance
- −$1,963
- − Management
- −$1,963
- − Depreciation
- −$5,673
- Taxable loss
- −$174
- Est. tax savings @ 24.0%
- +$42
- After-tax cash flow
- $2,966/yr
For passive investors: Depreciation is non-cash, so a rental often shows a tax loss while cash-flowing — sheltering income. Rental losses are passive: they offset passive income freely, and up to $25,000/yr can offset ordinary (W-2) income if you actively participate and your MAGI is under $100k (phasing out to $0 by $150k); unused losses carry forward. On sale, claimed depreciation is recaptured at up to 25%, and gains may owe capital-gains tax (a 1031 exchange can defer both). Figures are a year-1 estimate at your 24.0% rate — not tax advice; consult a CPA.
Schools (NCES district)
- District
- Easton Area SD
- NCES district ID
- 4208850
- Math proficiency
- 31% ▼ -2.00%
- Reading proficiency
- 44% ▼ -11.00%
- Median HH income
- $61,390
- Composite
- 33.46/100
- National rank
- #5457
- State rank
- #364 of 539 in PA
Livability — Easton
- Score
- 84/100
- State rank
- #92
- US rank
- #667
Category grades
Schools grade is shown separately in the Schools card above.
Census & demographics
- Census place
- Easton, PA
- County
- Northampton County · 236,814 people
- City population
- 75,961
- Metro
- Allentown-Bethlehem-Easton, PA-NJ
- Population (ZIP)
- 45,532
- Household income
- $77,556
- Rent vs Own
- Severe rent burden
- 1590.0
Population outlook (Northampton County) Hauer SSP2
- Today (2025)
- 312,227 people
- By 2030
- 314,769 · +0.8%
- By 2040
- 316,914 · +1.5%
- By 2050
- 318,037 · +1.9%
- By 2075
- 334,003 · +7.0%
- By 2100
- 344,696 · +10.4%
Race, ethnicity, and origin ACS 2023
- Neighborhood character
- Diverse neighborhood (Simpson 0.61)
- Race & ethnicity
- White 57% Hispanic / Latino 21% Black 12% Two or more races 12% Asian 3%
- Hispanic origin (detail)
- Mexican 3% Puerto Rican 7% Dominican 3%
- Common ancestry
- Romanian 3% Polish 2% Iranian 1%
- Foreign-born
- 13% · Canada, China, Jamaica
- Languages at home
- 80% English-only · Spanish 15% Other Indo-European 1% Arabic 1%
Political lean MEDSL · Northampton
- 2024 margin
- Toss-up / Even · D 48.6% · R 50.4%
- 2008→2024 swing
- -14.1pp toward R · 2008: 12.3pp · 2024: -1.8pp
- All cycles
- 2024: R+1.8 2020: D+0.7 2016: R+3.8 2012: D+4.6 2008: D+12.3
Not yet ingested
- Civics
- —
Market trends
- HPI YoY
- ▼ -460.52%
- Current HPI
- 254.8776
- Rent YoY
- ▲ 4.94%
- Metro
- Allentown-Bethlehem-Easton, PA-NJ
- State GDP YoY
- ▲ 1.68%
- F500 in state
- 34
Industry mix (Fortune 500 HQ in PA)
| Industry | F500 HQs | Revenue |
|---|---|---|
| Healthcare | 2 | $309B |
|
||
| Insurance | 2 | $27B |
|
||
| Telecommunications / Media | 1 | $124B |
|
||
| Industrial Distribution | 1 | $22B |
|
||
| Financial Services | 1 | $20B |
|
||
| Chemicals / Materials | 1 | $18B |
|
||
Price history
+519.5% since first listed12 events — show timeline
- 2026-04-22 Price Changed $210,000 GLVRMLS
- 2026-01-03 Listed $225,000 GLVRMLS
- 2012-05-15 Listing Removed — GLVRMLS
- 2011-11-15 Listed $87,900 GLVRMLS
- 2009-11-20 Sold (Public Records) $100,000 Public Records
- 2009-09-26 Listing Removed — GLVRMLS
- 2009-09-26 Listing Removed — GLVRMLS
- 2009-07-25 Listed $84,500 GLVRMLS
- 2009-07-25 Listed $84,500 GLVRMLS
- 2009-01-14 Sold (Public Records) $85,000 Public Records
- 2001-01-01 Listing Removed — GLVRMLS
- 2000-07-03 Listed $33,900 GLVRMLS
Property tax history
+1.3%/yrLatest (2026): $3,217 · +2.3% YoY. Source: county tax records.
Cash-flow waterfall
monthlySold comps — $/sqft
last 12 mo · ≤1 miLoading sold comps…