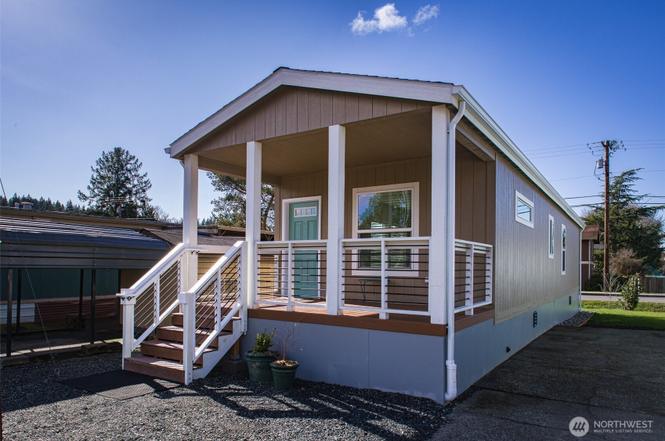
2400 DONOVAN Ave #4 · Bellingham, WA
Flood risk 4/10 · Minor
- FEMA flood zone
- X (unshaded)
- Chance of flooding over 30 yrs
- 0.24%
- Est. flood insurance / yr
- $507 – $1,088
Fire risk 2/10 · Minimal
- Est. fire insurance / yr
- $604 – $1,122
Heat risk 3/10 · Minor
- Hot days now (above 83°F)
- 8 days/yr
- Hot days in 30 yrs
- 20 days/yr
Wind risk 1/10 · Minimal
- Chance of severe wind over 30 yrs
- —
Air-quality risk 6/10 · Moderate
- Unhealthy air days now
- 9 days/yr
- Unhealthy air days in 30 yrs
- 10 days/yr
Risk factors via First Street. Map © Google.
Why this score? — see what drove the D+ grade
The composite is a weighted blend of 9 inputs, each scored 0–100. Each bar is that input's sub-score; the figure is the points it added to the 100-point composite (weight × sub-score).
- Cash flow +16.2/30.0
- ARV discount +7.5/15.0
- DSCR +5.0/10.0
- Schools +4.8/10.0
- 1% rule +4.4/10.0
- Livability +4.0/5.0
- Rent growth +3.2/5.0
- Condition / age +2.5/5.0
- Appreciation +0.0/10.0
$220,000
🖨 Deal sheet 📄 Offer letter ✓ Due diligence
Listing remarks
Brand Spanking New! A NW Energy-Efficient Manufactured Housing (NEEM) Champion Home has just arrived! Grab this spotless 2 BR with 1 Full Bath and all new appliances, before it gets away! A perfectly situated 55+ community as well! Enjoy Airquest cooling and heating year round, with the added security of an earthquake proofing structure. Enjoy watching the sunrise with your morning coffee on the large east-facing front deck, which adds another "room" in the warmer months. Wide quality blinds allow plenty of natural light, and the lovely neutral palette may just inspire your inner designer! Create a small private area on the home's sunny southside. Both the attractive trim and sidi
Key facts
- Large front deck
- Private area
- Energy efficient
Tags
Property features AI
Finance
- Other: Bus line nearby; Calculated building area 789 square feet; Direction faces east; Double pane windows (energy efficient)
- Financial info: Land lease: $800/month; Listing terms: Cash or Conventional
- HOA & community: Located in South End Mobile Estates (park of 83 homes); Clubhouse in park; Park approved for sale; Senior community (check pet rules in remarks)
Exterior
- Parking: 2 open/uncovered parking spaces
- Utilities: Electric energy source; Public water (City of Bellingham); Sewer (SSC); Puget Sound Energy; Electric water heater in closet; Cable: XFINITY; Internet: XFINITY
- Home design: Manufactured single-wide home; One-story; Faces east; Mobile home remains on site; Very good condition
- Construction: Cement plank construction; Composition roof; Tie-down foundation; Manufacturer: CHAMPION; Model: HCW1652H21A6G
- Exterior features: Cement planked exterior; Patio/porch/deck; Dead-end street; Paved access; Has a view
Interior
- Kitchen: Dishwasher; Garbage disposal; Refrigerator; Stove/Range
- Bedrooms: 2 bedrooms
- Flooring: Laminate
- Bathrooms: 1 full bathroom with bathtub and shower
- Heating & cooling: Forced air heating; Forced air cooling
- Interior features: Water heater; Kitchen without eating space; Living room
- Laundry & utility: Washer; Dryer
Neighborhood map
What this means for you Summary
Snapshot
- This is a 2-bed/1.0-bath manufactured listed at $220k.
Deal economics
- At list price, monthly cash flow is $118 ($1k/yr) — positive.
- The deal already cash-flows at list — no discount required.
- To meet the 1% rule (rent ≥ 1% of price), the offer needs to be $207k (5.7% below list).
- Recommended offer: $200k (9.0% below list) — sets the bar for market timing.
- Cap rate 6.9% vs local median 2.0% in Bellingham — top-decile yield for the area; either an underpriced asset or a hidden risk that comps aren't pricing in. Stress-test before assuming the spread holds.
Location & tenants
- Location reads 80/100 on livability (#102 in WA, #1,947 nationally) — a professional / high-income tenant draw. Strengths: amenities A+, commute A+, health & safety A+; Watch: crime F, cost of living F.
- Bellingham School District (urban): math 47% / reading 63% proficiency, ranked #106 of 291 in WA (top 36%) — acceptable for families but not a draw, mixed tenant base, ~2y average lease.
- Market conditions: Rents rising (+2.7%/yr); 235 active listings in the ZIP; 26 comparable units currently listed for rent nearby; rentals at typical pace (median 21d on market — plan ~3-4 weeks tenant-placement turnaround); 1,190 units permitted in Whatcom County in 2024 (327 in 5+ unit buildings).
- This rent runs 39% of the median local income ($64k/yr) — at the standard rent-burdened threshold; future hikes will face affordability resistance.
Forward outlook
- Local home prices are declining (-3.0%/yr); year-one equity from $2k of loan paydown is wiped out by about $7k of value loss. Plan a longer hold.
- Whatcom County population projected at +28% by 2050 — long-run rental-demand tailwind backs the buy-and-hold thesis.
Negotiation context
- It's been on market 111 days — a 9% lower offer ($200k) is reasonable based on typical stale-listing flexibility.
- 2 sale attempts since 18y ago with the ask held roughly flat each time — persistent listings suggest the price (not the market) is what's stuck; bring a comps-based counter.
Questions for the listing agent
- It's been on market 111 days. Have you received any prior offers? Is the seller open to a 9% concession, seller financing, or rate buy-down credit?
- Why hasn't it sold? Are there any deal-killer items the seller is aware of (foundation, flood, title, zoning, code violations)?
- Is there a deadline driving the sale (1031 exchange, divorce, estate, relocation)? That informs how much negotiation room exists.
- Schools are B-rated — typically a magnet for longer-tenancy family renters. What's the average tenant stay here, and is there a school-zone premium baked into asking?
- Crime grade is F in this area — have there been break-ins, vandalism, or insurance claims at this property in the last 3 years? What carrier currently insures it and at what premium?
- The area grade is low — what's the realistic commute time and amenity access for the typical tenant pool here? Any planned neighborhood developments (good or bad) we should know about?
- What's the average days-on-market for RENTAL listings here right now (not sales)? A rising rental-DOM trend means longer vacancies and softer asking-rent achievability than the comps imply.
- What's the recent tenant-quality profile in this submarket — average credit score on applications, eviction rate, late-payment / NSF rate, and stable-employment percentage? A property-management company in the area should have these aggregated.
- How much new for-sale + rental construction is in the pipeline within 1–3 miles? Heavy new supply typically softens prices + rents 12–24 months out; constrained supply supports both.
Investment metrics
- 1% rule
- 0.94% ✗
- Cap rate
- 6.94%
- Cash-on-cash
- 2.30%
- DSCR
- 1.10
- GRM
- 8.8
CMA / ARV
- ARV (on-the-fly)
- $126,492
- Comps found
- 9
Show comp detail 9 sales within ~0.75 mi
| Address | Dist | Beds/Ba | Sqft | Sold | Price | $/sf | Match |
|---|---|---|---|---|---|---|---|
| 2400 Donovan Ave #59 | 0.00mi | 2/1.0 | 924 (-7%) | 1mo | $119,500 | $129 | 87 |
| 2400 Donovan #67 | 0.00mi | 2/2.0 | 960 (-4%) | 10mo | $92,500 | $96 | 82 |
| 2400 Donovan Ave #36 | 0.00mi | 2/2.0 | 924 (-7%) | 12mo | $160,000 | $173 | 74 |
| 2400 Donovan Ave #41 | 0.00mi | 2/1.0 | 864 (-13%) | 13mo | $56,000 | $65 | 67 |
| 2400 Donovan Ave Unit 14C | 0.00mi | 2/1.0 | 846 (-15%) | 15mo | $106,000 | $125 | 62 |
| 2400 Donovan Ave #38 | 0.00mi | 3/2.0 (+1) | 1,120 (+12%) | 20mo | $142,000 | $127 | 54 |
| 425 Chuckanut Dr N #47 | 0.69mi | 2/1.5 | 1,024 (+3%) | 19mo | $75,000 | $73 | 45 |
| 425 Chuckanut Dr N #26 | 0.73mi | 2/1.0 | 924 (-7%) | 12mo | $150,000 | $162 | 44 |
| 425 Chuckanut Dr N #17 | 0.66mi | 2/2.0 | 1,080 (+8%) | 13mo | $265,000 | $245 | 40 |
Match score weights: distance 35% · size 25% · config 20% · recency 20%. Top-matched comps best support the ARV.
Projected returns pro-forma
-3.0% appreciation · 2.67% rent growth · sell at horizon
- IRR
- -13.0%
- Equity multiple
- 0.53×
- Total profit
- $-28,788
- Equity at exit
- $32,803
- IRR
- -4.5%
- Equity multiple
- 0.71×
- Total profit
- $-18,061
- Equity at exit
- $19,022
Cash invested: $61,600 (down + closing). Projections, not guarantees.
Landlord ↔ Tenant lean methodology
- Overall (STATE)
- 28 Tenant-Leaning
- State Washington
- 28 Tenant-Leaning · D+8
- County
- — inherits STATE
- City
- — inherits STATE
ZIP-level market 98225
- Rents YoY
- 2.7%
- Active inventory
- 235
- Price-to-rent
- 8.8×
Monthly cashflow live
- Estimated rent
- $2,074 high interval (Pro) →
- Mortgage (P&I)
- −$1,154
- Tax est. 1.5%
- −$275 /mo · $3,300/yr
- Insurance
- −$92
- HOA
- −$0
- Vacancy / Maint / Mgmt
- −$436
- Net cashflow
- $118
Break-even live
UW: 25.0% down · 7.5% · 30yr · 1.5% tax · 5.0% vac · 8.0% maint · 8.0% mgmt
Financing live
Cash to close
- Down payment
- $55,000
- Closing costs
- $6,600
- Reserves months
- —
- Total cash needed
- —
Loan-product check · same deal, 3 products live
Conventional
25% down · 7.5% · 30yr
- Down + closing
- —
- Monthly P&I
- —
- Monthly cashflow
- —
- DSCR
- —
- Eligible?
- —
Personal DTI + credit; lowest rate.
DSCR
20% down · 8.5% · 30yr
- Down + closing
- —
- Monthly P&I
- —
- Monthly cashflow
- —
- DSCR
- —
- Eligible?
- —
No personal income docs; deal must DSCR.
Hard money
10% down · 12.0% · 12mo
- Down + closing
- —
- Monthly P&I
- —
- Monthly cashflow
- —
- DSCR
- —
- Eligible?
- —
Short-term bridge; refi at stabilization.
Rent comps 26 comps
| Address | Beds | Baths | Sqft | Rent | $/sqft | DOM | Units | Dist |
|---|---|---|---|---|---|---|---|---|
| 2214 Wilson Ave Unit B Bellingham, WA | 2.0 | 1.5 | 900 | $1,900 | $2.11 | 13d | 1 | 0.17mi |
| 2707 Connelly Ave Bellingham, WA | 2.0 | 2.0 | 1018 | $2,495 | $2.45 | 13d | 1 | 0.19mi |
| 2102 Harris Ave Unit 2106-3 Bellingham, WA | 2.0 | 1.0 | 850 | $1,825 | $2.15 | 13d | 1 | 0.41mi |
| 3129 Old Fairhaven Pkwy Bellingham, WA | 2.0 | 1.0 | 711 | $2,310 | $3.25 | 13d | 2 | 0.41mi |
| 2506 Douglas Ave Bellingham, WA | 2.0 | 1.0 | 880 | $1,875 | $2.13 | 13d | 2 | 0.56mi |
| 1021 24th St Unit 1021 9 Bellingham, WA | 2.0 | 1.0 | 800 | $1,595 | $1.99 | 21d | 1 | 0.56mi |
| 1014 23rd St Unit 12 Bellingham, WA | 2.0 | 1.0 | 784 | $1,745 | $2.23 | 21d | 1 | 0.58mi |
| 2170 Douglas Ave Bellingham, WA | 3.0–4.0 | 2.0 | 1069 | $2,325 | $2.17 | 13d | 4 | 0.62mi |
| 2305 Douglas Ave Bellingham, WA | 1.0–4.0 | 1.0–4.0 | 1089 | $2,222 | $2.04 | 13d | 16 | 0.65mi |
| 926 23rd St Bellingham, WA | 2.0 | 1.0 | 862 | $1,835 | $2.13 | 13d | 8 | 0.67mi |
| 930 22nd St Bellingham, WA | 1.0–3.0 | 1.0–2.0 | 900 | $2,008 | $2.23 | 21d | 5 | 0.68mi |
| 926 22nd St Unit 926-19 Bellingham, WA | 2.0 | 1.0 | 850 | $1,800 | $2.12 | 21d | 1 | 0.68mi |
| 920 22nd St Bellingham, WA | 3.0 | 1.5 | 1000 | $2,638 | $2.64 | 13d | 3 | 0.70mi |
| 910 21st St Unit 103 Bellingham, WA | 2.0 | 1.0 | 672 | $1,650 | $2.46 | 21d | 1 | 0.74mi |
| 910 20th St Apt 201 Bellingham, WA | 2.0 | 1.0 | 765 | $1,650 | $2.16 | 21d | 1 | 0.76mi |
| 808 21st St Bellingham, WA | 2.0 | 1.0 | 699 | $1,750 | $2.50 | 21d | 4 | 0.81mi |
| 1130 13th St Bellingham, WA | 1.0 | 1.0 | 631 | $1,700 | $2.69 | 21d | 1 | 0.87mi |
| 705 32nd St Bellingham, WA | 3.0 | 1.0–2.0 | 792 | $2,095 | $2.65 | 21d | 23 | 0.93mi |
| 1440 10th St Bellingham, WA | 2.0 | 1.0–2.0 | 761 | $2,565 | $3.37 | 13d | 5 | 0.95mi |
| 524 32nd St Bellingham, WA | 3.0 | 2.0 | 1100 | $2,480 | $2.25 | 21d | 3 | 1.04mi |
| 1002 11th St Bellingham, WA | 2.0 | 1.0 | 900 | $2,130 | $2.37 | 43d | 1 | 1.07mi |
| 487 31st St Bellingham, WA | 1.0–2.0 | 1.0 | 697 | $1,890 | $2.71 | 21d | 33 | 1.10mi |
| 490 S State St Bellingham, WA | 2.0 | 1.0 | 911 | $2,595 | $2.85 | 13d | 3 | 1.32mi |
| 230 32nd St Unit 250-106 (ADA) Bellingham, WA | 2.0 | 1.0 | 738 | $1,725 | $2.34 | 13d | 1 | 1.34mi |
| 3805 Elwood Ave Bellingham, WA | 4.0 | 1.0–2.5 | 1213 | $2,418 | $1.99 | 13d | 49 | 1.39mi |
| 222 S Forest St Bellingham, WA | 1.0 | 1.0 | 910 | $2,700 | $2.97 | 21d | 1 | 1.44mi |
Listing history 19 events
-
2026-06-18days on market $220,000 Active 111 DOM
-
2026-06-17days on market $220,000 Active 110 DOM
-
2026-06-16days on market $220,000 Active 109 DOM
-
2026-06-15days on market $220,000 Active 108 DOM
-
2026-06-14days on market $220,000 Active 106 DOM
-
2026-06-13days on market $220,000 Active 105 DOM
-
2026-06-10days on market $220,000 Active 103 DOM
-
2026-06-09days on market $220,000 Active 102 DOM
-
2026-06-08days on market $220,000 Active 101 DOM
-
2026-06-07days on market $220,000 Active 100 DOM
-
2026-06-05days on market $220,000 Active 97 DOM
-
2026-06-03days on market $220,000 Active 96 DOM
-
2026-06-02days on market $220,000 Active 95 DOM
-
2026-06-01days on market $220,000 Active 94 DOM
-
2026-05-31days on market $220,000 Active 93 DOM
-
2026-05-30days on market $220,000 Active 92 DOM
-
2026-02-27$220,000 Active
-
2008-06-25historical
-
2008-06-08
ⓘ Source: listings_history table (triggers on properties + properties_extension) + one-shot
backfill from property_details.listing_events for pre-trigger history.
Climate risk First Street
- Flood 4/10 Moderate FEMA zone X (unshaded) · 24% chance over 30 yrs
- Wildfire 2/10 Low
- Heat 3/10 Moderate 8 d/yr ≥83°F today · 20 d/yr by 30 yrs out
- Wind 1/10 Low
- Air quality 6/10 Major 9 unhealthy d/yr today · 10 by 30 yrs out
Nearby sold comps map
Loading sold comps map…
Walkable amenities ~0.75 mi
Loading nearby amenities…
Taxation est. · year 1
- Rental income
- $24,887
- − Mortgage interest
- −$12,323
- − Property taxes
- −$3,300
- − Insurance
- −$1,100
- − Repairs & maintenance
- −$1,991
- − Management
- −$1,991
- − Depreciation
- −$6,400
- Taxable loss
- −$2,219
- Est. tax savings @ 24.0%
- +$532
- After-tax cash flow
- $1,949/yr
For passive investors: Depreciation is non-cash, so a rental often shows a tax loss while cash-flowing — sheltering income. Rental losses are passive: they offset passive income freely, and up to $25,000/yr can offset ordinary (W-2) income if you actively participate and your MAGI is under $100k (phasing out to $0 by $150k); unused losses carry forward. On sale, claimed depreciation is recaptured at up to 25%, and gains may owe capital-gains tax (a 1031 exchange can defer both). Figures are a year-1 estimate at your 24.0% rate — not tax advice; consult a CPA.
Schools (NCES district)
- District
- Bellingham School District
- NCES district ID
- 5300420
- Math proficiency
- 47% ▼ -6.00%
- Reading proficiency
- 63% ▼ -1.00%
- Median HH income
- $47,678
- Composite
- 48.49/100
- National rank
- #4632
- State rank
- #106 of 291 in WA
Livability — Bellingham
- Score
- 80/100
- State rank
- #102
- US rank
- #1947
Category grades
Schools grade is shown separately in the Schools card above.
Census & demographics
- Census place
- Bellingham, WA
- County
- Whatcom County · 209,776 people
- City population
- 130,296
- Metro
- Bellingham, WA
- Population (ZIP)
- 50,216
- Household income
- $63,941
- Rent vs Own
- Severe rent burden
- 4351.0
Population outlook (Whatcom County) Hauer SSP2
- Today (2025)
- 240,408 people
- By 2030
- 254,667 · +5.9%
- By 2040
- 281,365 · +17.0%
- By 2050
- 307,592 · +27.9%
- By 2075
- 375,576 · +56.2%
- By 2100
- 421,637 · +75.4%
Race, ethnicity, and origin ACS 2023
- Neighborhood character
- Predominantly White (78%)
- Race & ethnicity
- White 78% Hispanic / Latino 10% Two or more races 9% Asian 4% Black 1%
- Hispanic origin (detail)
- Mexican 5%
- Common ancestry
- Italian 5% Portuguese 5% Slovak 4%
- Foreign-born
- 7% · Canada, China, Vietnam
- Languages at home
- 89% English-only · Spanish 6% Chinese 1% Other Indo-European 1%
Political lean MEDSL · Whatcom
- 2024 margin
- Strong D (+24.9) · D 60.8% · R 35.9% · Other 3.3%
- 2008→2024 swing
- +6.9pp toward D · 2008: 18.0pp · 2024: 24.9pp
- All cycles
- 2024: D+24.9 2020: D+23.9 2016: D+17.7 2012: D+12.1 2008: D+18.0
Not yet ingested
- Civics
- —
Market trends
- HPI YoY
- ▼ -1126.32%
- Current HPI
- 463.2721
- Rent YoY
- ▲ 2.67%
- Metro
- Bellingham, WA
- State GDP YoY
- ▲ 4.65%
- F500 in state
- 22
Industry mix (Fortune 500 HQ in WA)
| Industry | F500 HQs | Revenue |
|---|---|---|
| Retail | 2 | $269B |
|
||
| Technology / Retail | 1 | $638B |
|
||
| Technology | 1 | $245B |
|
||
| Telecommunications | 1 | $38B |
|
||
| Food / Beverage | 1 | $36B |
|
||
| Automotive / Trucks | 1 | $34B |
|
||
Price history
3 events — show timeline
- 2026-02-27 Listed $220,000 NWMLS as Distributed by MLS Grid
- 2008-06-25 Delisted — NWMLS as Distributed by MLS Grid
- 2008-06-08 Listed — NWMLS as Distributed by MLS Grid
Property tax history
+2.7%/yrLatest (2026): $144 · -26.3% YoY. Source: county tax records.
Cash-flow waterfall
monthlySold comps — $/sqft
last 12 mo · ≤1 miLoading sold comps…