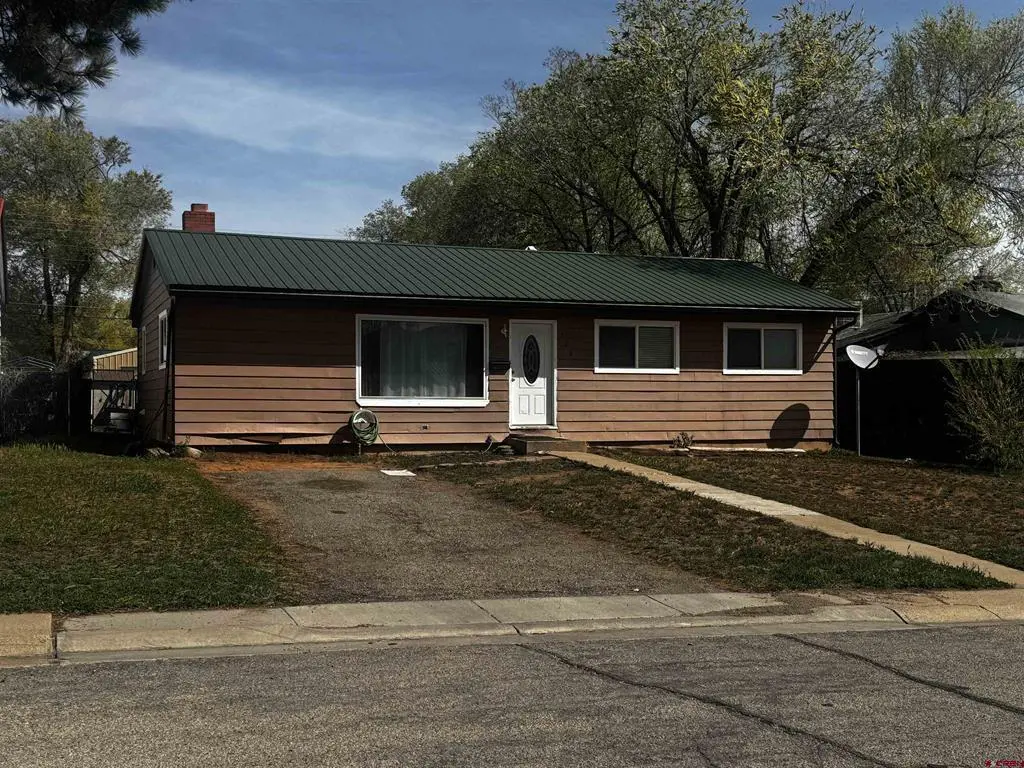
726 E 3rd · Cortez, CO
Flood risk 1/10 · Minimal
- FEMA flood zone
- X (unshaded)
- Chance of flooding over 30 yrs
- 0.0%
- Est. flood insurance / yr
- $507 – $1,088
Fire risk 6/10 · Moderate
- Est. fire insurance / yr
- $939 – $1,743
Heat risk 3/10 · Minor
- Hot days now (above 91°F)
- 7 days/yr
- Hot days in 30 yrs
- 18 days/yr
Wind risk 1/10 · Minimal
- Chance of severe wind over 30 yrs
- —
Air-quality risk 1/10 · Minimal
- Unhealthy air days now
- 0 days/yr
- Unhealthy air days in 30 yrs
- 0 days/yr
Risk factors via First Street. Map © Google.
Why this score? — see what drove the D+ grade
The composite is a weighted blend of 9 inputs, each scored 0–100. Each bar is that input's sub-score; the figure is the points it added to the 100-point composite (weight × sub-score).
- Cash flow +14.9/30.0
- ARV discount +14.5/15.0
- DSCR +4.6/10.0
- Livability +3.4/5.0
- 1% rule +3.0/10.0
- Rent growth +2.5/5.0
- Condition / age +2.5/5.0
- Schools +2.1/10.0
- Appreciation +0.0/10.0
$235,000
🖨 Deal sheet (PDF) 📄 Offer letter ✓ Due diligence
Listing remarks MLS
Great family home with a large, open living area and fireplace. The huge south facing window in the family room allows the natural light to flood in. This home has recently been updated with new carpet, kitchen makeover, bathroom makeover , fresh interior paint and more. Newer efficient furnace (Goodman 80,000 btu w/ 96% efficiency) and metal roof. Nice fenced back yard that includes 2 sheds. Metal workbench and compressor in shed are included. The main level of the home is 1486 (per county) with an unfinished basement that provides many possibilities. At $108/sf, this home is a great buy!
Key facts
- Alley access
- Space to entertain
- Space to relax
Tags
Property features AI
Exterior
- Utilities: Public water; Public sewer; Electricity available; Natural gas available; Cable available; High-speed internet available; Cellular phone reception
- Home design: Single-story; Stick built construction
- Construction: Stick built construction
- Exterior features: Shed; Partial fencing; City street frontage; Residential single-family lot
Interior
- Kitchen: Oven; Range; Dishwasher; Refrigerator; Kitchen island; Eat-in kitchen; Kitchen/dining combo
- Flooring: Hardwood; Partially carpeted; Tile
- Bathrooms: 1 full bathroom
- Heating & cooling: Forced air heating; Natural gas heating; Wood heating; Evaporative cooling
- Interior features: Unfurnished; Eat-in kitchen; Kitchen island; Kitchen/dining combo
- Laundry & utility: Washer; Dryer
Neighborhood map
What this means for you Summary
Snapshot
- This is a 3-bed/1.0-bath single-family listed at $235k.
Deal economics
- At list price, monthly cash flow is $70 ($838/yr) — positive.
- The deal already cash-flows at list — no discount required.
- To meet the 1% rule (rent ≥ 1% of price), the offer needs to be $188k (20.0% below list).
- Recommended offer: $188k (20.0% below list) — sets the bar for 1% rule.
- Cap rate 6.6% vs local median 3.3% in Cortez — top-decile yield for the area; either an underpriced asset or a hidden risk that comps aren't pricing in. Stress-test before assuming the spread holds.
Location & tenants
- Location reads 67/100 on livability (#125 in CO) — a middle-class / working-renter tenant base. Strengths: cost of living A+, health & safety A+, housing A; Watch: schools D-, crime F, amenities F.
- Montezuma-Cortez School District No. Re-1 (town): math 16% / reading 33% proficiency, ranked #70 of 86 in CO (top 81%) — low school quality limits family demand, transient renter base, plan for 1-2y turnover.
- Market conditions: 226 active listings in the ZIP; 4 comparable units currently listed for rent nearby; rentals at typical pace (median 25d on market — plan ~3-4 weeks tenant-placement turnaround); 24 units permitted in Montezuma County in 2024 (0 in 5+ unit buildings).
- This rent runs 38% of the median local income ($60k/yr) — at the standard rent-burdened threshold; future hikes will face affordability resistance.
Forward outlook
- Local home prices are declining (-3.0%/yr); year-one equity from $2k of loan paydown is wiped out by about $7k of value loss. Plan a longer hold.
Negotiation context
- It's been on market 52 days — a 3% lower offer ($228k) is reasonable based on typical stale-listing flexibility.
- 4 sale attempts since 7y ago with the ask held roughly flat each time — persistent listings suggest the price (not the market) is what's stuck; bring a comps-based counter.
- Current owner paid $150k; list at $235k implies a 57% gain — meaningful room to come down on a strong offer.
Risks & watch-outs
- Climate carrying-cost: major wildfire risk — expect insurance premiums to compound above CPI over the hold.
Questions for the listing agent
- It's been on market 52 days. Have you received any prior offers? Is the seller open to a 20% concession, seller financing, or rate buy-down credit?
- Built in 1963 — when were the roof, HVAC, electrical panel, plumbing, and water heater last replaced?
- Is there a deadline driving the sale (1031 exchange, divorce, estate, relocation)? That informs how much negotiation room exists.
- Schools are D-rated, which usually means shorter tenancies and higher turnover. Who's the typical renter profile here, and what's been the actual vacancy rate?
- Crime grade is F in this area — have there been break-ins, vandalism, or insurance claims at this property in the last 3 years? What carrier currently insures it and at what premium?
- The area grade is low — what's the realistic commute time and amenity access for the typical tenant pool here? Any planned neighborhood developments (good or bad) we should know about?
- What's the average days-on-market for RENTAL listings here right now (not sales)? A rising rental-DOM trend means longer vacancies and softer asking-rent achievability than the comps imply.
- What's the recent tenant-quality profile in this submarket — average credit score on applications, eviction rate, late-payment / NSF rate, and stable-employment percentage? A property-management company in the area should have these aggregated.
- How much new for-sale + rental construction is in the pipeline within 1–3 miles? Heavy new supply typically softens prices + rents 12–24 months out; constrained supply supports both.
Investment metrics
- 1% rule
- 0.80% ✗
- Cap rate
- 6.65%
- Cash-on-cash
- 1.27%
- DSCR
- 1.06
- GRM
- 10.4
CMA / ARV
- ARV (on-the-fly)
- $278,586
- Comps found
- 12
Show comp detail 12 sales within ~0.75 mi
| Address | Dist | Beds/Ba | Sqft | Sold | Price | $/sf | Match |
|---|---|---|---|---|---|---|---|
| 214 S Valley Rd | 0.05mi | 3/1.0 | 1,196 (-1%) | 10mo | $260,000 | $217 | 88 |
| 208 E 3rd St | 0.46mi | 3/2.0 | 1,258 (+4%) | 1mo | $200,000 | $159 | 66 |
| 629 E 2nd St | 0.12mi | 3/2.0 | 1,056 (-12%) | 12mo | $284,500 | $269 | 60 |
| 771 Aspen Dr | 0.46mi | 3/2.0 | 1,272 (+6%) | 9mo | $290,000 | $228 | 58 |
| 109 S Madison St | 0.36mi | 2/1.5 (-1) | 1,149 (-5%) | 12mo | $167,000 | $145 | 58 |
| 1322 E North St | 0.45mi | 3/2.0 | 1,144 (-5%) | 14mo | $215,000 | $188 | 55 |
| 201 S Washington St | 0.42mi | 4/2.0 (+1) | 1,300 (+8%) | 5mo | $333,000 | $256 | 54 |
| 502 E Montezuma Ave | 0.45mi | 3/1.5 | 1,278 (+6%) | 19mo | $330,000 | $258 | 51 |
| 608 S Madison St | 0.41mi | 3/1.0 | 1,056 (-12%) | 13mo | $244,000 | $231 | 49 |
| 532 E Arbecam | 0.48mi | 3/2.0 | 1,026 (-15%) | 0mo | $290,000 | $283 | 48 |
| 412 S Ash St | 0.48mi | 3/1.0 | 1,044 (-13%) | 19mo | $225,000 | $216 | 39 |
| 526 Geralds Way | 0.45mi | 3/2.0 | 1,384 (+15%) | 15mo | $375,000 | $271 | 38 |
Match score weights: distance 35% · size 25% · config 20% · recency 20%. Top-matched comps best support the ARV.
Projected returns pro-forma
-3.0% appreciation · 3.0% rent growth · sell at horizon
- IRR
- -14.3%
- Equity multiple
- 0.49×
- Total profit
- $-33,734
- Equity at exit
- $35,039
- IRR
- -5.6%
- Equity multiple
- 0.63×
- Total profit
- $-24,057
- Equity at exit
- $20,319
Cash invested: $65,800 (down + closing). Projections, not guarantees.
Landlord ↔ Tenant lean methodology
- Overall (STATE)
- 38 Tenant-Leaning
- State Colorado
- 38 Tenant-Leaning · D+4
- County
- — inherits STATE
- City
- — inherits STATE
ZIP-level market 81321
- Active inventory
- 226
- Price-to-rent
- 10.4×
Monthly cashflow live
- Estimated rent
- $1,880 medium interval (Pro) →
- Mortgage (P&I)
- −$1,232
- Tax from tax record
- −$85 /mo · $1,017/yr
- Insurance
- −$98
- HOA
- −$0
- Vacancy / Maint / Mgmt
- −$395
- Net cashflow
- $70
Break-even live
Sensitivity live
| Price | -10% $203 | -5% $136 | +0% $70 | +5% $3 | +10% $-63 |
|---|---|---|---|---|---|
| Rent | -10% $-79 | -5% $-4 | +0% $70 | +5% $144 | +10% $218 |
| Rate | -1.0pp $188 | -0.5pp $130 | base $70 | +0.5pp $9 | +1.0pp $-53 |
UW: 25.0% down · 7.5% · 30yr · 1.5% tax · 5.0% vac · 8.0% maint · 8.0% mgmt
Financing live
Cash to close
- Down payment
- $58,750
- Closing costs
- $7,050
- Reserves months
- —
- Total cash needed
- —
Loan-product check · same deal, 3 products live
Conventional
25% down · 7.5% · 30yr
- Down + closing
- —
- Monthly P&I
- —
- Monthly cashflow
- —
- DSCR
- —
- Eligible?
- —
Personal DTI + credit; lowest rate.
DSCR
20% down · 8.5% · 30yr
- Down + closing
- —
- Monthly P&I
- —
- Monthly cashflow
- —
- DSCR
- —
- Eligible?
- —
No personal income docs; deal must DSCR.
Hard money
10% down · 12.0% · 12mo
- Down + closing
- —
- Monthly P&I
- —
- Monthly cashflow
- —
- DSCR
- —
- Eligible?
- —
Short-term bridge; refi at stabilization.
Rent comps 4 comps
| Address | Beds | Baths | Sqft | Rent | $/sqft | DOM | Units | Dist |
|---|---|---|---|---|---|---|---|---|
| 507 S Chestnut St Cortez, CO | 3.0 | 2.0 | 1398 | $1,800 | $1.29 | 3d | 1 | 0.73mi |
| 446 S Linden St Cortez, CO | 2.0 | 1.0 | 1040 | $1,700 | $1.63 | 3d | 1 | 0.83mi |
| 1082 N Mildred Rd Cortez, CO | 3.0 | 2.0 | 1200 | $2,150 | $1.79 | 24d | 1 | 0.95mi |
| 417 S Cedar St Cortez, CO | 2.0 | 1.0 | 760 | $1,350 | $1.78 | 24d | 1 | 1.12mi |
Listing history 24 events
-
2026-06-21days on market $235,000 Active 52 DOM
-
2026-06-18days on market $235,000 Active 49 DOM
-
2026-06-17days on market $235,000 Active 48 DOM
-
2026-06-16days on market $235,000 Active 47 DOM
-
2026-06-15days on market $235,000 Active 46 DOM
-
2026-06-14days on market $235,000 Active 44 DOM
-
2026-06-10days on market $235,000 Active 41 DOM
-
2026-06-09days on market $235,000 Active 40 DOM
-
2026-06-08days on market $235,000 Active 39 DOM
-
2026-06-07days on market $235,000 Active 38 DOM
-
2026-06-05days on market $235,000 Active 35 DOM
-
2026-06-03days on market $235,000 Active 34 DOM
-
2026-06-02days on market $235,000 Active 33 DOM
-
2026-06-01days on market $235,000 Active 32 DOM
-
2026-05-31days on market $235,000 Active 31 DOM
-
2026-05-31days on market $235,000 Active 30 DOM
-
2026-05-15status Active
-
2026-04-06$235,000 Active
-
2024-10-14historical
-
2024-09-27$245,000 Active
-
2019-08-26soldstatus $150,000 596-char remark
Show marketing remark (596 chars)
Great family home with a large, open living area and fireplace. The huge south facing window in the family room allows the natural light to flood in. This home has recently been updated with new carpet, kitchen makeover, bathroom makeover , fresh interior paint and more. Newer efficient furnace (Goodman 80,000 btu w/ 96% efficiency) and metal roof. Nice fenced back yard that includes 2 sheds. Metal workbench and compressor in shed are included. The main level of the home is 1486 (per county) with an unfinished basement that provides many possibilities. At $108/sf, this home is a great buy!
-
2019-08-26soldstatus $150,000
Show marketing remark (596 chars)
Great family home with a large, open living area and fireplace. The huge south facing window in the family room allows the natural light to flood in. This home has recently been updated with new carpet, kitchen makeover, bathroom makeover , fresh interior paint and more. Newer efficient furnace (Goodman 80,000 btu w/ 96% efficiency) and metal roof. Nice fenced back yard that includes 2 sheds. Metal workbench and compressor in shed are included. The main level of the home is 1486 (per county) with an unfinished basement that provides many possibilities. At $108/sf, this home is a great buy!
-
2019-07-23$160,000 596-char remark
Show marketing remark (596 chars)
Great family home with a large, open living area and fireplace. The huge south facing window in the family room allows the natural light to flood in. This home has recently been updated with new carpet, kitchen makeover, bathroom makeover , fresh interior paint and more. Newer efficient furnace (Goodman 80,000 btu w/ 96% efficiency) and metal roof. Nice fenced back yard that includes 2 sheds. Metal workbench and compressor in shed are included. The main level of the home is 1486 (per county) with an unfinished basement that provides many possibilities. At $108/sf, this home is a great buy!
-
2006-01-10soldstatus $77,550
ⓘ Source: listings_history table (triggers on properties + properties_extension) + one-shot
backfill from property_details.listing_events for pre-trigger history.
Tax reassessment forecast CO · Resets to sale price
- Current annual tax
- $1,017 · $85/mo
- Projected year-2 tax
- $1,292 · $108/mo
- Expected delta
- +$275/yr (+$23/mo · 27.0%)
ⓘ Screening estimate from a state-policy table — verify with the county assessor before closing.
Climate risk First Street
- Flood 1/10 Low FEMA zone X (unshaded) · 0% chance over 30 yrs
- Wildfire 6/10 Major
- Heat 3/10 Moderate 7 d/yr ≥91°F today · 18 d/yr by 30 yrs out
- Wind 1/10 Low
- Air quality 1/10 Low 0 unhealthy d/yr today · 0 by 30 yrs out
Nearby sold comps map
Loading sold comps map…
Walkable amenities ~0.75 mi
Loading nearby amenities…
Taxation est. · year 1
- Rental income
- $22,555
- − Mortgage interest
- −$13,164
- − Property taxes
- −$1,017
- − Insurance
- −$1,175
- − Repairs & maintenance
- −$1,804
- − Management
- −$1,804
- − Depreciation
- −$6,836
- Taxable loss
- −$3,246
- Est. tax savings @ 24.0%
- +$779
- After-tax cash flow
- $1,617/yr
For passive investors: Depreciation is non-cash, so a rental often shows a tax loss while cash-flowing — sheltering income. Rental losses are passive: they offset passive income freely, and up to $25,000/yr can offset ordinary (W-2) income if you actively participate and your MAGI is under $100k (phasing out to $0 by $150k); unused losses carry forward. On sale, claimed depreciation is recaptured at up to 25%, and gains may owe capital-gains tax (a 1031 exchange can defer both). Figures are a year-1 estimate at your 24.0% rate — not tax advice; consult a CPA.
Schools (NCES district)
- District
- Montezuma-Cortez School District No. Re-1
- NCES district ID
- 0803090
- Math proficiency
- 16% ▼ -2.00%
- Reading proficiency
- 33% ▼ -1.00%
- Median HH income
- $42,394
- Composite
- 20.85/100
- National rank
- #8499
- State rank
- #70 of 86 in CO
Livability — Cortez
- Score
- 67/100
- State rank
- #125
- US rank
- #10641
Category grades
Schools grade is shown separately in the Schools card above.
Census & demographics
- Census place
- Cortez, CO
- County
- Montezuma County · 18,723 people
- City population
- 14,236
- Metro
- nan
- Population (ZIP)
- 14,236
- Household income
- $59,506
- Rent vs Own
- Severe rent burden
- 403.0
Population outlook (Montezuma County) Hauer SSP2
- Today (2025)
- 26,943 people
- By 2030
- 27,208 · +1.0%
- By 2040
- 27,372 · +1.6%
- By 2050
- 27,180 · +0.9%
- By 2075
- 26,493 · -1.7%
- By 2100
- 23,364 · -13.3%
Race, ethnicity, and origin ACS 2023
- Neighborhood character
- Predominantly White (69%)
- Race & ethnicity
- White 69% Hispanic / Latino 15% Two or more races 10% Native American 9% Asian 1% Black 1%
- Hispanic origin (detail)
- Mexican 9%
- Common ancestry
- Slovak 3% Iranian 3% Italian 2%
- Foreign-born
- 4% · Canada, China
- Languages at home
- 87% English-only · Spanish 6% Chinese 1% Russian/Polish/Slavic 1%
Political lean MEDSL · Montezuma
- 2024 margin
- Strong R (+21.0) · D 38.3% · R 59.3% · Other 2.5%
- 2008→2024 swing
- -1.6pp toward R · 2008: -19.4pp · 2024: -21.0pp
- All cycles
- 2024: R+21.0 2020: R+22.4 2016: R+30.3 2012: R+23.6 2008: R+19.4
Not yet ingested
- Civics
- —
Market trends
- HPI YoY
- ▼ -274.25%
- Current HPI
- 264.2281
- Rent YoY
- —
- Metro
- nan
- State GDP YoY
- ▲ 1.95%
- F500 in state
- 14
Industry mix (Fortune 500 HQ in CO)
| Industry | F500 HQs | Revenue |
|---|---|---|
| Technology Distribution | 1 | $31B |
|
||
| Food / Agriculture | 1 | $18B |
|
||
| Packaging | 1 | $14B |
|
||
| Healthcare | 1 | $13B |
|
||
| Energy | 1 | $10B |
|
||
| Technology | 1 | $4B |
|
||
Price history
+203.0% since first listed8 events — show timeline
- 2026-05-15 Relisted — cren
- 2026-04-06 Listed $235,000 cren
- 2024-10-14 Listing Removed — cren
- 2024-09-27 Listed $245,000 cren
- 2019-08-26 Sold (Public Records) $150,000 Public Records
- 2019-08-26 Sold (MLS) $150,000 cren
- 2019-07-23 Listed $160,000 cren
- 2006-01-10 Sold (Public Records) $77,550 Public Records
Property tax history
+6.9%/yrLatest (2025): $1,017 · +28.8% YoY. Source: county tax records.
Cash-flow waterfall
monthlySold comps — $/sqft
last 12 mo · ≤1 miLoading sold comps…