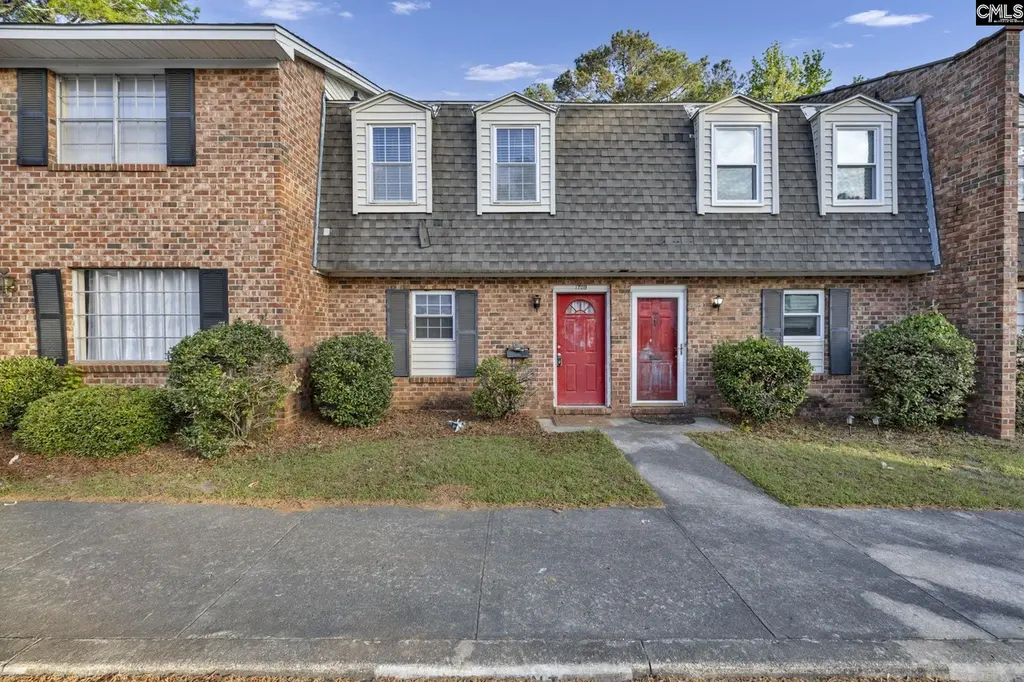
1709 Grays Inn Rd · St. Andrews, SC
Flood risk 1/10 · Minimal
- FEMA flood zone
- X (unshaded)
- Chance of flooding over 30 yrs
- 0.0%
- Est. flood insurance / yr
- $507 – $1,088
Fire risk 1/10 · Minimal
- Est. fire insurance / yr
- $783 – $1,453
Heat risk 7/10 · Major
- Hot days now (above 108°F)
- 7 days/yr
- Hot days in 30 yrs
- 16 days/yr
Wind risk 6/10 · Moderate
- Chance of severe wind over 30 yrs
- 68.0%
Air-quality risk 3/10 · Minor
- Unhealthy air days now
- 2 days/yr
- Unhealthy air days in 30 yrs
- 2 days/yr
Risk factors via First Street. Map © Google.
Why this score? — see what drove the C- grade
The composite is a weighted blend of 9 inputs, each scored 0–100. Each bar is that input's sub-score; the figure is the points it added to the 100-point composite (weight × sub-score).
- Cash flow +19.2/30.0
- 1% rule +9.0/10.0
- ARV discount +7.5/15.0
- DSCR +6.1/10.0
- Rent growth +3.8/5.0
- Schools +2.6/10.0
- Livability +2.5/5.0
- Condition / age +2.5/5.0
- Appreciation +0.0/10.0
$89,000
🖨 Deal sheet 📄 Offer letter ✓ Due diligence
Listing remarks
1709 Grays Inn Road is a well-maintained 2-bedroom, 1.5-bathroom townhome in the St. Andrews area of Columbia, SC, offering approximately 1,050 square feet of living space. The layout features a galley-style kitchen, separate dining area, and a convenient half bath on the main level, with both bedrooms located upstairs. Interior highlights include central HVAC, ceiling fans, in-unit stacked washer and dryer, and a mix of carpet and LVP flooring. The property also offers a private back patio, exterior storage, and includes water, sewer, trash, and yard care for added convenience. Ideally located with easy access to shopping, dining, and major roadways, this home provides comfortable, low-mai
Key facts
- Central hvac
- Exterior storage
- Galley-style kitchen
Tags
Property features AI
Finance
- Other: Listing address: 1709 Grays Inn Rd, Columbia, SC 29210
- HOA & community: Property is part of an association
Exterior
- Parking: Two parking spaces
- Utilities: Public water; Public sewer
- Home design: Two-story residence
- Construction: Slab foundation
- Exterior features: Brick exterior above foundation; Paved road access; Approximately 0.01 acres
Interior
- Bedrooms: Master bedroom located on the second floor
- Bathrooms: One full bathroom; One half bathroom
- Heating & cooling: Central heating; Central cooling
- Interior features: Total heated area approximately 1,050
Neighborhood map
What this means for you Summary
Snapshot
- This is a 2-bed/2.0-bath condo listed at $89k.
Deal economics
- At list price, monthly cash flow is $96 ($1k/yr) — positive.
- The deal already cash-flows at list — no discount required.
- Meets the 1% rule at list price ($1k rent vs $89k).
- Recommended offer: $84k (6.0% below list) — sets the bar for market timing.
Location & tenants
- Location reads: area grade C — affects rentability + tenant quality, not the cash-flow math above.
- Richland 01 (urban): math 26% / reading 36% proficiency, ranked #54 of 80 in SC (top 68%) — families likely to look elsewhere, expect single-tenant / working-renter base with shorter leases; 64% free/reduced lunch — lower-income household profile, screen leases tightly.
- Zoned schools: Carver-Lyon Elementary (math 27% / reading 27%, grade F, #421 of 597 statewide, top 73%, 387 students, 100% FRL); C. A. Johnson High (math 34% / reading 84%, grade C+, #110 of 196 statewide, top 58%, 364 students, 100% FRL) — zoned schools average 100% FRL vs 64% district-wide (36 pts higher); higher-poverty schools than district average — tighter screening recommended.
- Zoned-school proficiency averages 43% at this address vs 31% district-wide (+12 pts) — the actual schools serving this property are materially stronger than the Richland 01 average implies; a family-tenant draw the district grade alone would hide.
- Market conditions: Rents rising fast (+5.0%/yr); 145 active listings in the ZIP; 23 comparable units currently listed for rent nearby; rentals at typical pace (median 19d on market — plan ~3-4 weeks tenant-placement turnaround); 3,472 units permitted in Richland County in 2024 (1,096 in 5+ unit buildings).
Forward outlook
- Local home prices are declining (-3.0%/yr); year-one equity from $615 of loan paydown is wiped out by about $3k of value loss. Plan a longer hold.
- Richland County population projected at +30% by 2050 — long-run rental-demand tailwind backs the buy-and-hold thesis.
Negotiation context
- It's been on market 79 days — a 6% lower offer ($84k) is reasonable based on typical stale-listing flexibility.
- 3 sale attempts since 2y ago; this cycle's ask has dropped $9k (9%) from the opening price — seller is motivated, your offer sets the floor, not the list.
- Current owner paid $56k; list at $89k implies a 59% gain — meaningful room to come down on a strong offer.
Risks & watch-outs
- Climate carrying-cost: major wind risk, 68% chance of damaging wind over 30y; extreme-heat days projected 7→16/yr by 2055 (HVAC capex compounding) — expect insurance premiums to compound above CPI over the hold.
Questions for the listing agent
- It's been on market 79 days. Have you received any prior offers? Is the seller open to a 6% concession, seller financing, or rate buy-down credit?
- Built in 1972 — when were the roof, HVAC, electrical panel, plumbing, and water heater last replaced?
- What does the HOA fee cover, when was the last increase, and are there any pending special assessments or reserve-fund shortfalls?
- Any open or pending special assessments — roof, HVAC, plumbing, elevator, façade? What's the per-unit balance and payoff schedule, and is the seller paying it off at close or rolling it to the buyer?
- Why hasn't it sold? Are there any deal-killer items the seller is aware of (foundation, flood, title, zoning, code violations)?
- Is there a deadline driving the sale (1031 exchange, divorce, estate, relocation)? That informs how much negotiation room exists.
- What's the average days-on-market for RENTAL listings here right now (not sales)? A rising rental-DOM trend means longer vacancies and softer asking-rent achievability than the comps imply.
- What's the recent tenant-quality profile in this submarket — average credit score on applications, eviction rate, late-payment / NSF rate, and stable-employment percentage? A property-management company in the area should have these aggregated.
- How much new apartment / multifamily construction is in the pipeline within 1–3 miles? Heavy new supply (>2% of stock underway) typically softens rents 12–24 months out; light construction supports rent growth.
Investment metrics
- 1% rule
- 1.40% ✓
- Cap rate
- 7.59%
- Cash-on-cash
- 4.64%
- DSCR
- 1.21
- GRM
- 6.0
CMA / ARV
No comps found within radius.
Projected returns pro-forma
-3.0% appreciation · 5.0% rent growth · sell at horizon
- IRR
- -5.8%
- Equity multiple
- 0.78×
- Total profit
- $-5,546
- Equity at exit
- $13,270
- IRR
- 7.0%
- Equity multiple
- 1.59×
- Total profit
- $14,731
- Equity at exit
- $7,695
Cash invested: $24,920 (down + closing). Projections, not guarantees.
Landlord ↔ Tenant lean methodology
- Overall (STATE)
- 90 Strongly Landlord-Friendly
- State South Carolina
- 90 Strongly Landlord-Friendly · R+6
- County
- — inherits STATE
- City
- — inherits STATE
ZIP-level market 29210
- Home prices YoY
- -32.2%
- Rents YoY
- 5.0%
- Active inventory
- 145
- Price-to-rent
- 6.0×
Monthly cashflow live
- Estimated rent
- $1,243 high interval (Pro) →
- Mortgage (P&I)
- −$467
- Tax from tax record
- −$134 /mo · $1,613/yr
- Insurance
- −$37
- HOA
- −$247
- Vacancy / Maint / Mgmt
- −$261
- Net cashflow
- $96
Break-even live
UW: 25.0% down · 7.5% · 30yr · 1.5% tax · 5.0% vac · 8.0% maint · 8.0% mgmt
Financing live
Cash to close
- Down payment
- $22,250
- Closing costs
- $2,670
- Reserves months
- —
- Total cash needed
- —
Loan-product check · same deal, 3 products live
Conventional
25% down · 7.5% · 30yr
- Down + closing
- —
- Monthly P&I
- —
- Monthly cashflow
- —
- DSCR
- —
- Eligible?
- —
Personal DTI + credit; lowest rate.
DSCR
20% down · 8.5% · 30yr
- Down + closing
- —
- Monthly P&I
- —
- Monthly cashflow
- —
- DSCR
- —
- Eligible?
- —
No personal income docs; deal must DSCR.
Hard money
10% down · 12.0% · 12mo
- Down + closing
- —
- Monthly P&I
- —
- Monthly cashflow
- —
- DSCR
- —
- Eligible?
- —
Short-term bridge; refi at stabilization.
Rent comps 23 comps
| Address | Beds | Baths | Sqft | Rent | $/sqft | DOM | Units | Dist |
|---|---|---|---|---|---|---|---|---|
| 313 Cambout St Columbia, SC | 2.0 | 2.0 | 1100 | $1,450 | $1.32 | 23d | 1 | 0.06mi |
| 1601 Longcreek Dr Columbia, SC | 1.0–2.0 | 1.0–2.0 | 706 | $1,051 | $1.49 | 14d | 51 | 0.11mi |
| 1800 Longcreek Dr Columbia, SC | 1.0–3.0 | 1.0–2.0 | 986 | $900 | $0.91 | 11d | 62 | 0.16mi |
| 1401 Longcreek Dr Columbia, SC | 1.0–3.0 | 1.0–2.0 | 1000 | $1,116 | $1.12 | 14d | 9 | 0.26mi |
| 1340 Longcreek Dr Columbia, SC | 1.0–2.0 | 1.0–2.0 | 875 | $1,180 | $1.35 | 11d | 25 | 0.30mi |
| 2112 Chandler Ave Columbia, SC | 3.0 | 3.0 | 1350 | $1,850 | $1.37 | 23d | 1 | 0.53mi |
| 1808 Laredo Dr Columbia, SC | 3.0 | 2.0 | 1250 | $1,661 | $1.33 | 23d | 1 | 0.59mi |
| 1839 Hi Sierra Dr Columbia, SC | 3.0 | 2.0 | 1500 | $1,731 | $1.15 | 23d | 1 | 0.69mi |
| 4501 Bentley Dr Columbia, SC | 1.0–3.0 | 1.0–2.0 | 946 | $1,328 | $1.40 | 11d | 18 | 0.71mi |
| 1725 Kathleen Dr Unit B Columbia, SC | 2.0 | 2.0 | 1100 | $1,275 | $1.16 | 23d | 1 | 0.91mi |
| 825 Menlo Dr Columbia, SC | 1.0–4.0 | 1.0–2.0 | 1083 | $1,300 | $1.20 | 19d | 3 | 1.02mi |
| 324 Menlo Dr Unit BG0324 Columbia, SC | 2.0 | 1.0 | 912 | $1,175 | $1.29 | 14d | 1 | 1.04mi |
| 114 Menlo Dr Unit BG0114 Columbia, SC | 3.0 | 2.0 | 1300 | $1,675 | $1.29 | 19d | 1 | 1.10mi |
| 921 Old Manor Rd Unit BG0921 Columbia, SC | 2.0 | 1.0 | 912 | $1,100 | $1.21 | 23d | 1 | 1.13mi |
| 3900 Bentley Dr Columbia, SC | 1.0–2.0 | 1.0–2.0 | 873 | $1,330 | $1.52 | 11d | 40 | 1.21mi |
| 1510 Saint Andrews Rd Columbia, SC | 3.0 | 2.0 | 1196 | $1,215 | $1.02 | 14d | 36 | 1.23mi |
| 100 Bryton Trce Columbia, SC | 2.0 | 1.0–2.0 | 950 | $1,215 | $1.28 | 21d | 4 | 1.24mi |
| 2218 Apple Valley Rd Apt B Columbia, SC | 2.0 | 1.0 | 900 | $995 | $1.11 | 23d | 1 | 1.24mi |
| 2218 Apple Valley Rd Columbia, SC | 3.0 | 1.0 | 972 | $1,295 | $1.33 | 23d | 1 | 1.24mi |
| 200 Saluda River Rd Columbia, SC | 1.0–2.0 | 1.0–1.5 | 900 | $1,120 | $1.24 | 11d | 8 | 1.34mi |
| 2025 Apple Valley Rd Unit B Columbia, SC | 2.0 | 1.0 | 842 | $925 | $1.10 | 23d | 1 | 1.35mi |
| 716 Zimalcrest Dr Columbia, SC | 2.0 | 1.0–2.0 | 634 | $1,224 | $1.93 | 11d | 24 | 1.37mi |
| 961 Zimalcrest Dr Columbia, SC | 1.0–3.0 | 1.0–2.0 | 915 | $1,062 | $1.16 | 11d | 9 | 1.47mi |
HOA detail condo
- Monthly dues
- $247 · $2,964/yr
- Likely covers
- watersewertrash
- Assessments
- None detected in remarks — confirm with the listing agent.
Listing history 26 events
-
2026-06-18days on market $89,000 Active 79 DOM
-
2026-06-17days on market $89,000 Active 78 DOM
-
2026-06-16days on market $89,000 Active 77 DOM
-
2026-06-15days on market $89,000 Active 76 DOM
-
2026-06-14days on market $89,000 Active 74 DOM
-
2026-06-10days on market $89,000 Active 71 DOM
-
2026-06-09days on market $89,000 Active 70 DOM
-
2026-06-08days on market $89,000 Active 69 DOM
-
2026-06-07days on market $89,000 Active 68 DOM
-
2026-06-03days on market $89,000 Active 64 DOM
-
2026-06-03days on market $89,000 Active 63 DOM
-
2026-06-01days on market $89,000 Active 62 DOM
-
2026-05-31days on market $89,000 Active 61 DOM
-
2026-04-22price $89,000
-
2026-03-31$98,000 Active
-
2026-02-26historical $1,050
-
2026-01-10price $1,050
-
2025-11-06price $1,095
-
2025-08-15$1,195
-
2024-03-14historical $1,095
-
2024-01-18$1,095
-
2022-01-28soldstatus $56,000
-
2021-08-20soldstatus $27,000
-
1997-05-21soldstatus $48,900
-
1995-08-30soldstatus $41,000
-
1987-02-01soldstatus $40,000
ⓘ Source: listings_history table (triggers on properties + properties_extension) + one-shot
backfill from property_details.listing_events for pre-trigger history.
Tax reassessment forecast SC · Resets to sale price
- Current annual tax
- $1,613 · $134/mo
- Projected year-2 tax
- $1,613 · $134/mo
- Expected delta
- $0/yr ($0/mo · 0.0%)
ⓘ Screening estimate from a state-policy table — verify with the county assessor before closing.
Climate risk First Street
- Flood 1/10 Low FEMA zone X (unshaded) · 0% chance over 30 yrs
- Wildfire 1/10 Low
- Heat 7/10 Severe 7 d/yr ≥108°F today · 16 d/yr by 30 yrs out
- Wind 6/10 Major 68% chance of damaging wind over 30 yrs
- Air quality 3/10 Moderate 2 unhealthy d/yr today · 2 by 30 yrs out
Nearby sold comps map
Loading sold comps map…
Walkable amenities ~0.75 mi
Loading nearby amenities…
Taxation est. · year 1
- Rental income
- $14,911
- − Mortgage interest
- −$4,985
- − Property taxes
- −$1,613
- − Insurance
- −$445
- − Repairs & maintenance
- −$1,193
- − Management
- −$1,193
- − HOA
- −$2,964
- − Depreciation
- −$2,589
- Taxable loss
- −$71
- Est. tax savings @ 24.0%
- +$17
- After-tax cash flow
- $1,174/yr
For passive investors: Depreciation is non-cash, so a rental often shows a tax loss while cash-flowing — sheltering income. Rental losses are passive: they offset passive income freely, and up to $25,000/yr can offset ordinary (W-2) income if you actively participate and your MAGI is under $100k (phasing out to $0 by $150k); unused losses carry forward. On sale, claimed depreciation is recaptured at up to 25%, and gains may owe capital-gains tax (a 1031 exchange can defer both). Figures are a year-1 estimate at your 24.0% rate — not tax advice; consult a CPA.
Schools (NCES district)
- District
- Richland 01
- NCES district ID
- 4503360
- Math proficiency
- 26% ▼ -7.00%
- Reading proficiency
- 36% ▼ -5.00%
- Median HH income
- $38,931
- Composite
- 25.94/100
- National rank
- #7335
- State rank
- #54 of 80 in SC
Livability — St. Andrews
No livability data for this city. (Only ~50 U.S. cities are tracked.)
Census & demographics
- Census place
- St. Andrews, SC
- County
- Richland County · 389,530 people
- City population
- 40,504
- Metro
- Columbia, SC
- Population (ZIP)
- 39,962
- Household income
- $50,871
- Rent vs Own
- Severe rent burden
- 2859.0
Population outlook (Richland County) Hauer SSP2
- Today (2025)
- 459,667 people
- By 2030
- 487,524 · +6.1%
- By 2040
- 542,035 · +17.9%
- By 2050
- 595,371 · +29.5%
- By 2075
- 732,998 · +59.5%
- By 2100
- 820,415 · +78.5%
Race, ethnicity, and origin ACS 2023
- Neighborhood character
- Diverse neighborhood (Simpson 0.58)
- Race & ethnicity
- Black 55% White 34% Two or more races 6% Hispanic / Latino 4% Asian 2%
- Common ancestry
- Arab 2% Lithuanian 2% Slovak 1%
- Foreign-born
- 7% · Canada
- Languages at home
- 91% English-only · Spanish 3%
Political lean MEDSL · Richland
- 2024 margin
- Solid D (+34.6) · D 66.4% · R 31.8% · Other 1.8%
- 2008→2024 swing
- +5.7pp toward D · 2008: 28.9pp · 2024: 34.6pp
- All cycles
- 2024: D+34.6 2020: D+38.3 2016: D+32.9 2012: D+33.3 2008: D+28.9
Not yet ingested
- Civics
- —
Market trends
- HPI YoY
- ▼ -107.61%
- Current HPI
- 226.2564
- Rent YoY
- ▲ 5.00%
- Metro
- Columbia, SC
- State GDP YoY
- ▲ 4.51%
- F500 in state
- 2
Industry mix (Fortune 500 HQ in SC)
| Industry | F500 HQs | Revenue |
|---|---|---|
| Packaging | 1 | $7B |
|
||
Price history
+122.5% since first listed13 events — show timeline
- 2026-04-22 Price Changed $89,000 Consolidated MLS
- 2026-03-31 Listed $98,000 Consolidated MLS
- 2026-02-26 Rental Removed $1,050 APPFOLIO
- 2026-01-10 Price Changed $1,050 APPFOLIO
- 2025-11-06 Price Changed $1,095 APPFOLIO
- 2025-08-15 Listed for Rent $1,195 APPFOLIO
- 2024-03-14 Rental Removed $1,095 APPFOLIO
- 2024-01-18 Listed for Rent $1,095 APPFOLIO
- 2022-01-28 Sold (Public Records) $56,000 Public Records
- 2021-08-20 Sold (Public Records) $27,000 Public Records
- 1997-05-21 Sold (Public Records) $48,900 Public Records
- 1995-08-30 Sold (Public Records) $41,000 Public Records
- 1987-02-01 Sold (Public Records) $40,000 Public Records
Property tax history
+14.2%/yrLatest (2025): $1,613 · +2.4% YoY. Source: county tax records.
Cash-flow waterfall
monthlySold comps — $/sqft
last 12 mo · ≤1 miLoading sold comps…