7826 Doctor Strange Dr · Corpus Christi, TX
Flood risk No data
- FEMA flood zone
- —
- Chance of flooding over 30 yrs
- —
- Est. flood insurance / yr
- —
Fire risk No data
- Est. fire insurance / yr
- —
Heat risk No data
- Hot days now (above threshold)
- —
- Hot days in 30 yrs
- —
Wind risk No data
- Chance of severe wind over 30 yrs
- —
Air-quality risk No data
- Unhealthy air days now
- —
- Unhealthy air days in 30 yrs
- —
Risk factors via First Street. Map © Google.
Why this score? — see what drove the D+ grade
The composite is a weighted blend of 9 inputs, each scored 0–100. Each bar is that input's sub-score; the figure is the points it added to the 100-point composite (weight × sub-score).
- Cash flow +13.0/30.0
- ARV discount +12.5/15.0
- DSCR +3.9/10.0
- Livability +3.9/5.0
- 1% rule +3.7/10.0
- Rent growth +3.0/5.0
- Schools +2.8/10.0
- Condition / age +2.5/5.0
- Appreciation +0.0/10.0
$267,999
🖨 Deal sheet (PDF) 📄 Offer letter ✓ Due diligence
Listing remarks
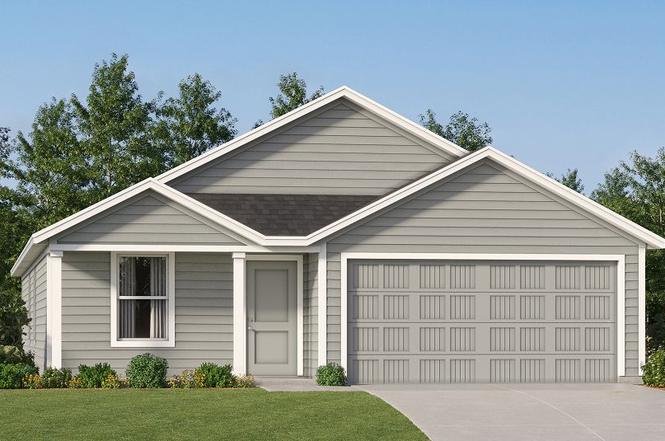
This new single-story design makes smart use of the space available. At the front are all three secondary bedrooms arranged near a convenient full-sized bathroom. Down the foyer is a modern layout connecting a peninsula-style kitchen made for inspired meals, an intimate dining area and a family room ideal for gatherings. Tucked in a quiet corner is the owner's suite with an attached bathroom and walk-in closet.
Key facts
- Intimate dining area
- Walk-in closet
- Single-story design
Tags
Property features AI
Finance
- Financial info: List price $267,999
Exterior
- Parking: 2 total parking spaces; 2-car garage
- Home design: Single-family home (Ramsey plan); New construction (spec)
- Exterior features: Address: 7826 Doctor Strange Dr, Corpus Christi, TX 78414
Interior
- Bedrooms: 4 bedrooms
- Bathrooms: 2 full bathrooms
- Interior features: Spec new-construction plan (Ramsey); Living area approximately 1,667
Neighborhood map
What this means for you Summary
Snapshot
- This is a 4-bed/2.0-bath single-family listed at $268k.
Deal economics
- At list price, monthly cash flow is $-14 ($-173/yr) — negative.
- To cash-flow at today's rent, offer at most $266k (0.8% below list).
- To meet the 1% rule (rent ≥ 1% of price), the offer needs to be $233k (13.2% below list).
- Recommended offer: $233k (13.2% below list) — sets the bar for 1% rule.
- Cap rate 6.2% vs local median 3.6% in Corpus Christi — top-decile yield for the area; either an underpriced asset or a hidden risk that comps aren't pricing in. Stress-test before assuming the spread holds.
Location & tenants
- Location reads 78/100 on livability (#66 in TX, #2,404 nationally) — a middle-class / working-renter tenant base. Strengths: commute A+, cost of living A+, housing A+; Watch: crime F.
- Corpus Christi ISD (urban): math 31% / reading 35% proficiency, ranked #562 of 826 in TX (top 68%) — families likely to look elsewhere, expect single-tenant / working-renter base with shorter leases; 63% free/reduced lunch — lower-income household profile, screen leases tightly.
- Zoned schools: Kolda El (math 51% / reading 59%, grade C, #602 of 4,322 statewide, top 14%, 879 students, 36% FRL); Adkins Middle (math 40% / reading 39%, grade F, #660 of 1,662 statewide, top 41%, 956 students, 48% FRL); Harold T Branch Academy For Career & Technical Ed (math 52% / reading 62%, grade C, #333 of 1,632 statewide, top 22%, 256 students, 72% FRL).
- Zoned-school proficiency averages 50% at this address vs 33% district-wide (+18 pts) — the actual schools serving this property are materially stronger than the Corpus Christi ISD average implies; a family-tenant draw the district grade alone would hide.
- Market conditions: Rents rising (+1.9%/yr); 623 active listings in the ZIP; 20 comparable units currently listed for rent nearby; rentals at typical pace (median 23d on market — plan ~3-4 weeks tenant-placement turnaround); 40% of comp listings sitting > 30 days — soft ceiling on asking rent; solid renter incomes; 1,397 units permitted in Nueces County in 2024 (47 in 5+ unit buildings).
Forward outlook
- Local home prices are declining (-3.0%/yr); year-one equity from $2k of loan paydown is wiped out by about $8k of value loss. Plan a longer hold.
- Nueces County population projected at +36% by 2050 — long-run rental-demand tailwind backs the buy-and-hold thesis.
Negotiation context
- Only 1 days on market — expect competitive offers; lowballing is unlikely to land.
Questions for the listing agent
- What do current leases actually rent for vs. the listed asking? Can we see a recent rent roll and the last 12 months of T-12 income?
- Is there a deadline driving the sale (1031 exchange, divorce, estate, relocation)? That informs how much negotiation room exists.
- Crime grade is F in this area — have there been break-ins, vandalism, or insurance claims at this property in the last 3 years? What carrier currently insures it and at what premium?
- The area grade is low — what's the realistic commute time and amenity access for the typical tenant pool here? Any planned neighborhood developments (good or bad) we should know about?
- What's the average days-on-market for RENTAL listings here right now (not sales)? A rising rental-DOM trend means longer vacancies and softer asking-rent achievability than the comps imply.
- What's the recent tenant-quality profile in this submarket — average credit score on applications, eviction rate, late-payment / NSF rate, and stable-employment percentage? A property-management company in the area should have these aggregated.
- How much new for-sale + rental construction is in the pipeline within 1–3 miles? Heavy new supply typically softens prices + rents 12–24 months out; constrained supply supports both.
Investment metrics
- 1% rule
- 0.87% ✗
- Cap rate
- 6.23%
- Cash-on-cash
- -0.23%
- DSCR
- 0.99
- GRM
- 9.6
CMA / ARV
- ARV (on-the-fly)
- $301,727
- Comps found
- 12
Show comp detail 12 sales within ~0.75 mi
| Address | Dist | Beds/Ba | Sqft | Sold | Price | $/sf | Match |
|---|---|---|---|---|---|---|---|
| 7702 Thor Dr | 0.15mi | 4/2.0 | 1,667 (0%) | 1mo | $259,999 | $156 | 92 |
| 7914 Thor Dr | 0.07mi | 3/2.0 (-1) | 1,634 (-2%) | 1mo | $285,999 | $175 | 88 |
| 7706 Thor Dr | 0.14mi | 3/2.0 (-1) | 1,474 (-12%) | 1mo | $246,999 | $168 | 68 |
| 7817 Bullrider Dr | 0.45mi | 3/2.0 (-1) | 1,614 (-3%) | 1mo | $299,000 | $185 | 68 |
| 7918 Thor Dr | 0.07mi | 3/2.0 (-1) | 1,896 (+14%) | 1mo | $306,999 | $162 | 68 |
| 7614 Lasso Dr | 0.49mi | 4/2.0 | 1,543 (-7%) | 1mo | $269,900 | $175 | 64 |
| 7725 Bullrider Dr | 0.45mi | 3/2.0 (-1) | 1,522 (-9%) | 1mo | $272,000 | $179 | 59 |
| 7718 Lariat Toss Dr | 0.45mi | 3/2.0 (-1) | 1,511 (-9%) | 1mo | $285,000 | $189 | 58 |
| 7621 Krypton Dr | 0.48mi | 3/2.0 (-1) | 1,821 (+9%) | 1mo | $352,499 | $194 | 57 |
| 7625 Rustler | 0.47mi | 3/2.0 (-1) | 1,492 (-10%) | 1mo | $269,900 | $181 | 55 |
| 7613 Krypton Dr | 0.50mi | 4/2.0 | 1,906 (+14%) | 1mo | $350,000 | $184 | 52 |
| 7333 Adler Dr | 0.57mi | 3/2.0 (-1) | 1,831 (+10%) | 1mo | $409,900 | $224 | 52 |
Match score weights: distance 35% · size 25% · config 20% · recency 20%. Top-matched comps best support the ARV.
Projected returns pro-forma
-3.0% appreciation · 1.94% rent growth · sell at horizon
- IRR
- -17.9%
- Equity multiple
- 0.38×
- Total profit
- $-46,767
- Equity at exit
- $39,960
- IRR
- -12.2%
- Equity multiple
- 0.31×
- Total profit
- $-51,628
- Equity at exit
- $23,172
Cash invested: $75,040 (down + closing). Projections, not guarantees.
Landlord ↔ Tenant lean methodology
- Overall (STATE)
- 87 Strongly Landlord-Friendly
- State Texas
- 87 Strongly Landlord-Friendly · R+5
- County
- — inherits STATE
- City
- — inherits STATE
ZIP-level market 78414
- Home prices YoY
- -18.1%
- Rents YoY
- 1.9%
- Active inventory
- 623
- Price-to-rent
- 9.6×
Monthly cashflow live
- Estimated rent
- $2,326 high interval (Pro) →
- Mortgage (P&I)
- −$1,405
- Tax est. 1.5%
- −$335 /mo · $4,020/yr
- Insurance
- −$112
- HOA
- −$0
- Vacancy / Maint / Mgmt
- −$488
- Net cashflow
- $-14
Break-even live
Sensitivity live
| Price | -10% $171 | -5% $78 | +0% $-14 | +5% $-107 | +10% $-200 |
|---|---|---|---|---|---|
| Rent | -10% $-198 | -5% $-106 | +0% $-14 | +5% $77 | +10% $169 |
| Rate | -1.0pp $121 | -0.5pp $54 | base $-14 | +0.5pp $-84 | +1.0pp $-155 |
UW: 25.0% down · 7.5% · 30yr · 1.5% tax · 5.0% vac · 8.0% maint · 8.0% mgmt
Financing live
Cash to close
- Down payment
- $67,000
- Closing costs
- $8,040
- Reserves months
- —
- Total cash needed
- —
Loan-product check · same deal, 3 products live
Conventional
25% down · 7.5% · 30yr
- Down + closing
- —
- Monthly P&I
- —
- Monthly cashflow
- —
- DSCR
- —
- Eligible?
- —
Personal DTI + credit; lowest rate.
DSCR
20% down · 8.5% · 30yr
- Down + closing
- —
- Monthly P&I
- —
- Monthly cashflow
- —
- DSCR
- —
- Eligible?
- —
No personal income docs; deal must DSCR.
Hard money
10% down · 12.0% · 12mo
- Down + closing
- —
- Monthly P&I
- —
- Monthly cashflow
- —
- DSCR
- —
- Eligible?
- —
Short-term bridge; refi at stabilization.
Rent comps 20 comps
| Address | Beds | Baths | Sqft | Rent | $/sqft | DOM | Units | Dist |
|---|---|---|---|---|---|---|---|---|
| 7926 Doctor Strange Dr Corpus Christi, TX | 4.0 | 3.0 | 2196 | $2,400 | $1.09 | 23d | 1 | 0.03mi |
| 7818 Doctor Strange Dr Corpus Christi, TX | 3.0 | 2.0 | 1214 | $2,000 | $1.65 | 45d | 1 | 0.05mi |
| 7925 Wonder Woman Dr Corpus Christi, TX | 4.0 | 3.0 | 1910 | $2,400 | $1.26 | 15d | 1 | 0.06mi |
| 7710 Thor Dr Corpus Christi, TX | 4.0 | 2.5 | 1900 | $2,395 | $1.26 | 15d | 1 | 0.14mi |
| 7705 Wonder Woman Dr Corpus Christi, TX | 3.0 | 2.0 | 1663 | $2,000 | $1.20 | 15d | 1 | 0.15mi |
| 7702 Spiderman Dr Corpus Christi, TX | 4.0 | 2.0 | 1639 | $2,400 | $1.46 | 23d | 1 | 0.20mi |
| 7713 Lariat Toss Dr Corpus Christi, TX | 3.0 | 2.0 | 1518 | $2,300 | $1.52 | 45d | 1 | 0.45mi |
| 7610 Rustler Ln Corpus Christi, TX | 3.0 | 2.0 | 1584 | $2,150 | $1.36 | 23d | 1 | 0.54mi |
| 7822 Fort Griffen Dr Corpus Christi, TX | 3.0 | 2.0 | 1618 | $2,100 | $1.30 | 15d | 1 | 0.65mi |
| 7230 Tristan Dr Corpus Christi, TX | 4.0 | 2.0 | 1838 | $2,395 | $1.30 | 45d | 1 | 0.69mi |
| 7230 Bryson Way Corpus Christi, TX | 4.0 | 2.0 | 1884 | $2,500 | $1.33 | 45d | 1 | 0.71mi |
| 8218 Merlin Pl Corpus Christi, TX | 4.0 | 2.0 | 2088 | $2,300 | $1.10 | 15d | 1 | 1.12mi |
| 3810 Los Arroyos Dr Corpus Christi, TX | 3.0 | 2.0 | 1578 | $2,300 | $1.46 | 23d | 1 | 1.14mi |
| 6865 La Salle Dr Corpus Christi, TX | 4.0 | 2.0 | 2186 | $3,000 | $1.37 | 45d | 1 | 1.21mi |
| 3617 Garnet Ct Corpus Christi, TX | 4.0 | 2.0 | 1758 | $2,125 | $1.21 | 45d | 1 | 1.34mi |
| 3614 Sapphire Ct Corpus Christi, TX | 4.0 | 2.5 | 1998 | $2,195 | $1.10 | 15d | 1 | 1.37mi |
| 8001 Rock Crest Dr Corpus Christi, TX | 3.0 | 2.0 | 1320 | $1,950 | $1.48 | 45d | 1 | 1.39mi |
| 8226 Excalibur Rd Corpus Christi, TX | 3.0 | 2.0 | 1792 | $2,250 | $1.26 | 15d | 1 | 1.44mi |
| 8314 Excalibur Rd Corpus Christi, TX | 4.0 | 2.0 | 2047 | $2,600 | $1.27 | 15d | 1 | 1.48mi |
| 7933 Wolverine Dr Corpus Christi, TX | 3.0 | 2.0 | 1352 | $1,750 | $1.29 | 45d | 1 | 1.50mi |
Listing history 2 events
-
2026-06-22remarks 414-char remark
-
2026-06-22$267,999 Active 1 DOM
ⓘ Source: listings_history table (triggers on properties + properties_extension) + one-shot
backfill from property_details.listing_events for pre-trigger history.
Nearby sold comps map
Loading sold comps map…
Walkable amenities ~0.75 mi
Loading nearby amenities…
Taxation est. · year 1
- Rental income
- $27,913
- − Mortgage interest
- −$15,012
- − Property taxes
- −$4,020
- − Insurance
- −$1,340
- − Repairs & maintenance
- −$2,233
- − Management
- −$2,233
- − Depreciation
- −$7,796
- Taxable loss
- −$4,721
- Est. tax savings @ 24.0%
- +$1,133
- After-tax cash flow
- $960/yr
For passive investors: Depreciation is non-cash, so a rental often shows a tax loss while cash-flowing — sheltering income. Rental losses are passive: they offset passive income freely, and up to $25,000/yr can offset ordinary (W-2) income if you actively participate and your MAGI is under $100k (phasing out to $0 by $150k); unused losses carry forward. On sale, claimed depreciation is recaptured at up to 25%, and gains may owe capital-gains tax (a 1031 exchange can defer both). Figures are a year-1 estimate at your 24.0% rate — not tax advice; consult a CPA.
Schools (NCES district)
- District
- Corpus Christi ISD
- NCES district ID
- 4815270
- Math proficiency
- 31% ▼ -18.00%
- Reading proficiency
- 35% ▼ -7.00%
- Median HH income
- $45,672
- Composite
- 28.27/100
- National rank
- #6793
- State rank
- #562 of 826 in TX
Livability — Corpus Christi
- Score
- 78/100
- State rank
- #66
- US rank
- #2404
Category grades
Schools grade is shown separately in the Schools card above.
Census & demographics
- Census place
- Corpus Christi, TX
- County
- Nueces County · 296,836 people
- City population
- 296,836
- Metro
- Corpus Christi, TX
- Population (ZIP)
- 54,263
- Household income
- $98,771
- Rent vs Own
- Severe rent burden
- 1167.0
Population outlook (Nueces County) Hauer SSP2
- Today (2025)
- 418,037 people
- By 2030
- 447,123 · +7.0%
- By 2040
- 505,911 · +21.0%
- By 2050
- 567,522 · +35.8%
- By 2075
- 729,686 · +74.6%
- By 2100
- 847,087 · +102.6%
Race, ethnicity, and origin ACS 2023
- Neighborhood character
- Diverse neighborhood (Simpson 0.60)
- Race & ethnicity
- Hispanic / Latino 52% White 35% Two or more races 33% Asian 6% Black 3%
- Hispanic origin (detail)
- Mexican 46% Puerto Rican 1%
- Common ancestry
- Lithuanian 1% Slovak 1% Romanian 1%
- Foreign-born
- 9% · Canada, China, South Korea
- Languages at home
- 70% English-only · Spanish 24% Other Indo-European 2% Chinese 1%
Political lean MEDSL · Nueces
- 2024 margin
- R (+11.5) · D 43.8% · R 55.3%
- 2008→2024 swing
- -7.1pp toward R · 2008: -4.4pp · 2024: -11.5pp
- All cycles
- 2024: R+11.5 2020: R+2.9 2016: R+1.5 2012: R+3.2 2008: R+4.4
Not yet ingested
- Civics
- —
Market trends
- HPI YoY
- ▼ -40.16%
- Current HPI
- 182.3229
- Rent YoY
- ▲ 1.94%
- Metro
- Corpus Christi, TX
- State GDP YoY
- ▲ 3.95%
- F500 in state
- 110
Industry mix (Fortune 500 HQ in TX)
| Industry | F500 HQs | Revenue |
|---|---|---|
| Energy | 16 | $1,198B |
|
||
| Technology | 5 | $198B |
|
||
| Engineering / Construction | 4 | $72B |
|
||
| Energy Services | 3 | $60B |
|
||
| Utilities | 3 | $41B |
|
||
| Healthcare | 2 | $330B |
|
||
Cash-flow waterfall
monthlySold comps — $/sqft
last 12 mo · ≤1 miLoading sold comps…