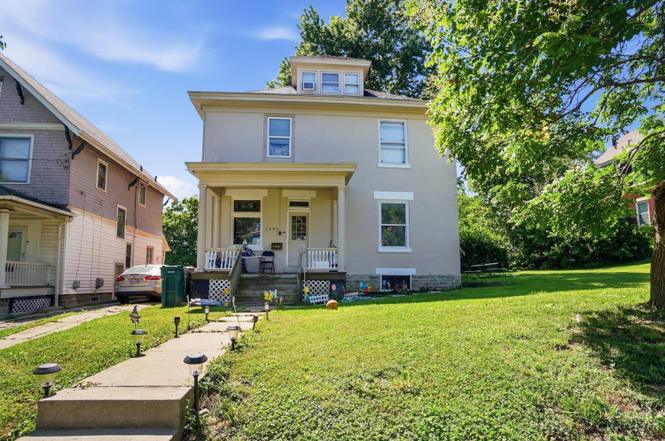
1141 Gilsey Ave · Cincinnati, OH
Flood risk 1/10 · Minimal
- FEMA flood zone
- X (unshaded)
- Chance of flooding over 30 yrs
- 0.0%
- Est. flood insurance / yr
- $473 – $860
Fire risk 1/10 · Minimal
- Est. fire insurance / yr
- $713 – $1,323
Heat risk 4/10 · Minor
- Hot days now (above 103°F)
- 7 days/yr
- Hot days in 30 yrs
- 19 days/yr
Wind risk 2/10 · Minimal
- Chance of severe wind over 30 yrs
- 1.0%
Air-quality risk 3/10 · Minor
- Unhealthy air days now
- 3 days/yr
- Unhealthy air days in 30 yrs
- 5 days/yr
Risk factors via First Street. Map © Google.
Why this score? — see what drove the C grade
The composite is a weighted blend of 9 inputs, each scored 0–100. Each bar is that input's sub-score; the figure is the points it added to the 100-point composite (weight × sub-score).
- Cash flow +23.5/30.0
- DSCR +7.6/10.0
- ARV discount +7.5/15.0
- 1% rule +7.1/10.0
- Livability +4.0/5.0
- Rent growth +3.3/5.0
- Schools +2.5/10.0
- Condition / age +2.5/5.0
- Appreciation +0.0/10.0
$160,000
🖨 Deal sheet 📄 Offer letter ✓ Due diligence
Listing remarks MLS
Well maintained brick 2 family/3 stories tall/owner occupied/215 foot deep level lot/extra parking/separate gas-electric-furnaces-water heaters/equipped kitchens & laundry/spacious rooms/rents projected/warranty included/solid investment!
Key facts
- 0.24 acre lot
- Built 1910
- Listed 8 days
Tags
Property features AI
Finance
- Other: Zoned residential
- HOA & community: No HOA
Exterior
- Parking: On-street parking; Driveway
- Utilities: Public water; Public sewer; Natural gas; Gas water heater
- Home design: Traditional single-family home; Three or more levels; Stone foundation; One fireplace (decorative/dummy)
- Construction: Brick construction; Shingle roof; Stone foundation; Second floor area present
- Exterior features: Porch; Less than 0.5 acre lot; Lot dimensions approximately 50 x 215
Interior
- Kitchen: Wood cabinets; Oven/Range; Refrigerator
- Bedrooms: Seven bedrooms total; Primary bedroom on level 1 (11 x 15); Bedroom 2 on level 2 (19 x 17); Bedroom 3 on level 2 (12 x 10); Bedroom 4 on level 2 (16 x 16); Bedroom 5 on level 2 (12 x 14)
- Bathrooms: Three full bathrooms; Primary bathroom with shower; Two full bathrooms on level 1 and one full bathroom on level 2
- Heating & cooling: Radiator heating; Central air; Window AC unit(s)
- Interior features: 9-foot (or higher) ceilings; Bonus room; Full, unfinished basement
- Laundry & utility: Unfinished basement suitable for utilities or storage
Neighborhood map
What this means for you Summary
Snapshot
- This is a 7-bed/3.0-bath single-family listed at $160k.
Deal economics
- At list price, monthly cash flow is $299 ($4k/yr) — positive.
- The deal already cash-flows at list — no discount required.
- Meets the 1% rule at list price ($2k rent vs $160k).
- Cap rate 8.5% vs local median 3.9% in Cincinnati — top-decile yield for the area; either an underpriced asset or a hidden risk that comps aren't pricing in. Stress-test before assuming the spread holds.
Location & tenants
- Location reads 80/100 on livability (#130 in OH, #1,856 nationally) — a professional / high-income tenant draw. Strengths: amenities A+, commute A+, cost of living A+; Watch: employment D, crime F.
- Cincinnati Public Schools (urban): math 25% / reading 36% proficiency, ranked #581 of 656 in OH (top 89%) — families likely to look elsewhere, expect single-tenant / working-renter base with shorter leases; 70% free/reduced lunch — lower-income household profile, screen leases tightly.
- Market conditions: Rents rising (+3.3%/yr); 69 active listings in the ZIP; lower-income renter base — watch delinquency; 801 units permitted in Hamilton County in 2024 (190 in 5+ unit buildings).
- At $1,932/mo this rent would consume 53% of the median local household income ($44k/yr) (locally 980% of renters already pay >50% of income on rent) — very limited rent-growth headroom before tenants either downsize or default.
Forward outlook
- Local home prices are declining (-3.0%/yr); year-one equity from $1k of loan paydown is wiped out by about $5k of value loss. Plan a longer hold.
Negotiation context
- Only 8 days on market — expect competitive offers; lowballing is unlikely to land.
- 3 sale attempts since 22y ago with the ask held roughly flat each time — persistent listings suggest the price (not the market) is what's stuck; bring a comps-based counter.
Risks & watch-outs
- Watch-outs: built in 1910 — expect roof / HVAC / electrical / plumbing capex.
Questions for the listing agent
- Built in 1910 — when were the roof, HVAC, electrical panel, plumbing, and water heater last replaced?
- Is there a deadline driving the sale (1031 exchange, divorce, estate, relocation)? That informs how much negotiation room exists.
- Schools are B-rated — typically a magnet for longer-tenancy family renters. What's the average tenant stay here, and is there a school-zone premium baked into asking?
- Crime grade is F in this area — have there been break-ins, vandalism, or insurance claims at this property in the last 3 years? What carrier currently insures it and at what premium?
- What's the average days-on-market for RENTAL listings here right now (not sales)? A rising rental-DOM trend means longer vacancies and softer asking-rent achievability than the comps imply.
- What's the recent tenant-quality profile in this submarket — average credit score on applications, eviction rate, late-payment / NSF rate, and stable-employment percentage? A property-management company in the area should have these aggregated.
- How much new for-sale + rental construction is in the pipeline within 1–3 miles? Heavy new supply typically softens prices + rents 12–24 months out; constrained supply supports both.
Investment metrics
- 1% rule
- 1.21% ✓
- Cap rate
- 8.53%
- Cash-on-cash
- 8.00%
- DSCR
- 1.36
- GRM
- 6.9
CMA / ARV
No comps found within radius.
Projected returns pro-forma
-3.0% appreciation · 3.3% rent growth · sell at horizon
- IRR
- -3.7%
- Equity multiple
- 0.86×
- Total profit
- $-6,225
- Equity at exit
- $23,857
- IRR
- 6.4%
- Equity multiple
- 1.49×
- Total profit
- $21,898
- Equity at exit
- $13,834
Cash invested: $44,800 (down + closing). Projections, not guarantees.
Landlord ↔ Tenant lean methodology
- Overall (STATE)
- 73 Landlord-Friendly
- State Ohio
- 73 Landlord-Friendly · R+6
- County
- — inherits STATE
- City
- — inherits STATE
ZIP-level market 45205
- Rents YoY
- 3.3%
- Active inventory
- 69
- Price-to-rent
- 6.9×
Monthly cashflow live
- Estimated rent
- $1,932 medium interval (Pro) →
- Mortgage (P&I)
- −$839
- Tax from tax record
- −$322 /mo · $3,862/yr
- Insurance
- −$67
- HOA
- −$0
- Vacancy / Maint / Mgmt
- −$406
- Net cashflow
- $299
Break-even live
UW: 25.0% down · 7.5% · 30yr · 1.5% tax · 5.0% vac · 8.0% maint · 8.0% mgmt
Financing live
Cash to close
- Down payment
- $40,000
- Closing costs
- $4,800
- Reserves months
- —
- Total cash needed
- —
Loan-product check · same deal, 3 products live
Conventional
25% down · 7.5% · 30yr
- Down + closing
- —
- Monthly P&I
- —
- Monthly cashflow
- —
- DSCR
- —
- Eligible?
- —
Personal DTI + credit; lowest rate.
DSCR
20% down · 8.5% · 30yr
- Down + closing
- —
- Monthly P&I
- —
- Monthly cashflow
- —
- DSCR
- —
- Eligible?
- —
No personal income docs; deal must DSCR.
Hard money
10% down · 12.0% · 12mo
- Down + closing
- —
- Monthly P&I
- —
- Monthly cashflow
- —
- DSCR
- —
- Eligible?
- —
Short-term bridge; refi at stabilization.
Listing history 7 events
-
2026-06-18days on market $160,000 Active 8 DOM
-
2026-06-17days on market $160,000 Active 7 DOM
-
2026-06-16days on market $160,000 Active 6 DOM
-
2026-06-15days on market $160,000 Active 5 DOM
-
2026-06-13days on market $160,000 Active 3 DOM
-
2026-06-13remarks 699-char remark
-
2026-06-13$160,000 Active 2 DOM
ⓘ Source: listings_history table (triggers on properties + properties_extension) + one-shot
backfill from property_details.listing_events for pre-trigger history.
Tax reassessment forecast OH · Partial reset (capped growth)
- Current annual tax
- $3,862 · $322/mo
- Projected year-2 tax
- $3,862 · $322/mo
- Expected delta
- $0/yr ($0/mo · 0.0%)
ⓘ Screening estimate from a state-policy table — verify with the county assessor before closing.
Climate risk First Street
- Flood 1/10 Low FEMA zone X (unshaded) · 0% chance over 30 yrs
- Wildfire 1/10 Low
- Heat 4/10 Moderate 7 d/yr ≥103°F today · 19 d/yr by 30 yrs out
- Wind 2/10 Low 100% chance of damaging wind over 30 yrs
- Air quality 3/10 Moderate 3 unhealthy d/yr today · 5 by 30 yrs out
Nearby sold comps map
Loading sold comps map…
Walkable amenities ~0.75 mi
Loading nearby amenities…
Taxation est. · year 1
- Rental income
- $23,181
- − Mortgage interest
- −$8,962
- − Property taxes
- −$3,862
- − Insurance
- −$800
- − Repairs & maintenance
- −$1,855
- − Management
- −$1,855
- − Depreciation
- −$4,655
- Taxable income
- $1,193
- Est. tax owed @ 24.0%
- −$286
- After-tax cash flow
- $3,296/yr
For passive investors: Depreciation is non-cash, so a rental often shows a tax loss while cash-flowing — sheltering income. Rental losses are passive: they offset passive income freely, and up to $25,000/yr can offset ordinary (W-2) income if you actively participate and your MAGI is under $100k (phasing out to $0 by $150k); unused losses carry forward. On sale, claimed depreciation is recaptured at up to 25%, and gains may owe capital-gains tax (a 1031 exchange can defer both). Figures are a year-1 estimate at your 24.0% rate — not tax advice; consult a CPA.
Schools (NCES district)
- District
- Cincinnati Public Schools
- NCES district ID
- 3904375
- Math proficiency
- 25% ▼ -19.00%
- Reading proficiency
- 36% ▼ -14.00%
- Median HH income
- $35,743
- Composite
- 25.21/100
- National rank
- #7508
- State rank
- #581 of 656 in OH
Livability — Cincinnati
- Score
- 80/100
- State rank
- #130
- US rank
- #1856
Category grades
Schools grade is shown separately in the Schools card above.
Census & demographics
- Census place
- Cincinnati, OH
- County
- Hamilton County · 701,295 people
- City population
- 505,555
- Metro
- Cincinnati, OH-KY-IN
- Population (ZIP)
- 18,651
- Household income
- $43,682
- Rent vs Own
- Severe rent burden
- 980.0
Population outlook (Hamilton County) Hauer SSP2
- Today (2025)
- 826,054 people
- By 2030
- 830,947 · +0.6%
- By 2040
- 832,319 · +0.8%
- By 2050
- 822,428 · -0.4%
- By 2075
- 788,688 · -4.5%
- By 2100
- 710,674 · -14.0%
Race, ethnicity, and origin ACS 2023
- Neighborhood character
- Diverse neighborhood (Simpson 0.69)
- Race & ethnicity
- Black 43% White 32% Hispanic / Latino 16% Two or more races 7% Asian 2%
- Hispanic origin (detail)
- Mexican 2%
- Common ancestry
- Lithuanian 1% Slovak 1% Serbian 1%
- Foreign-born
- 9% · Canada, India, China
- Languages at home
- 84% English-only · Spanish 10% Other Asian/Pacific 2% Other Indo-European 1%
Political lean MEDSL · Hamilton
- 2024 margin
- D (+14.9) · D 57.0% · R 42.1%
- 2008→2024 swing
- +7.9pp toward D · 2008: 7.0pp · 2024: 14.9pp
- All cycles
- 2024: D+14.9 2020: D+15.9 2016: D+9.5 2012: D+4.9 2008: D+7.0
Not yet ingested
- Civics
- —
Market trends
- HPI YoY
- ▼ -138.67%
- Current HPI
- 163.3375
- Rent YoY
- ▲ 3.30%
- Metro
- Cincinnati, OH-KY-IN
- State GDP YoY
- ▲ 1.98%
- F500 in state
- 48
Industry mix (Fortune 500 HQ in OH)
| Industry | F500 HQs | Revenue |
|---|---|---|
| Insurance | 3 | $145B |
|
||
| Industrial Machinery | 3 | $49B |
|
||
| Financial Services | 3 | $24B |
|
||
| Consumer Goods | 2 | $93B |
|
||
| Aerospace / Defense | 2 | $47B |
|
||
| Utilities | 2 | $33B |
|
||
Price history
+196.3% since first listed8 events — show timeline
- 2026-06-10 Listed $160,000 Cincy MLS
- 2023-10-12 Sold (Public Records) $141,200 Public Records
- 2005-06-23 Sold (Public Records) $79,500 Public Records
- 2005-06-17 Sold (MLS) $79,500 Cincy MLS
- 2005-03-22 Listing Removed — Cincy MLS
- 2005-03-17 Listed $84,900 Cincy MLS
- 2004-04-25 Listed $89,900 Cincy MLS
- 1992-05-12 Sold (Public Records) $54,000 Public Records
Property tax history
+15.7%/yrLatest (2025): $3,862 · +0.1% YoY. Source: county tax records.
Cash-flow waterfall
monthlySold comps — $/sqft
last 12 mo · ≤1 miLoading sold comps…