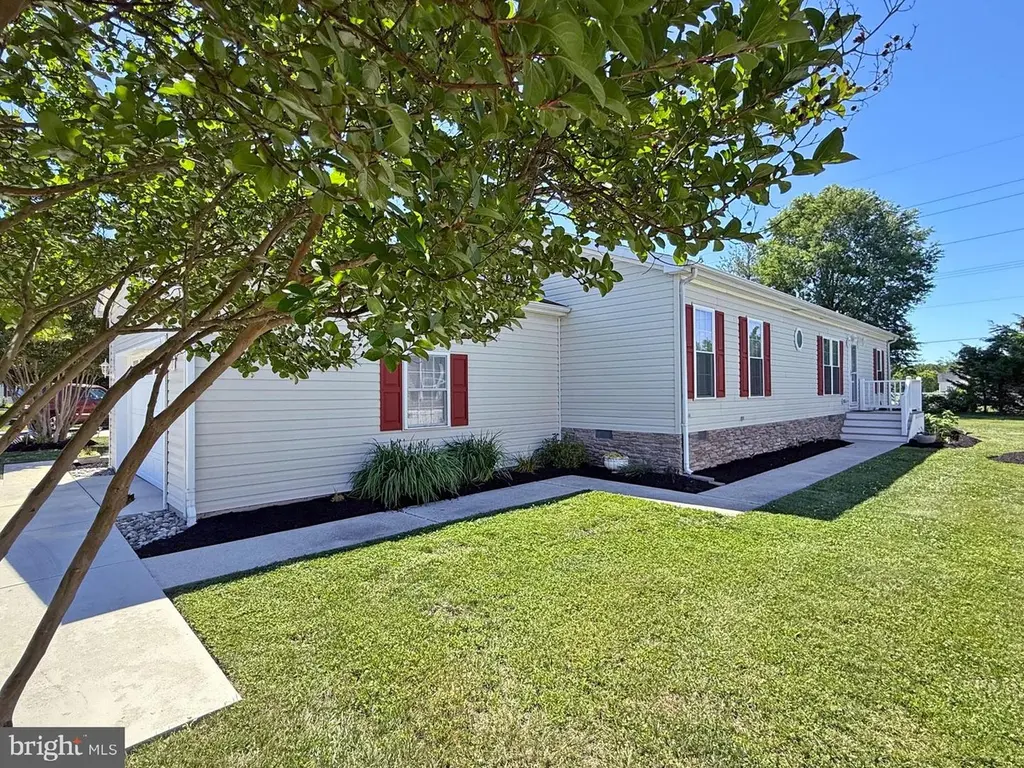
26 Whitehaven Way #13 · Lewes, DE
Flood risk 1/10 · Minimal
- FEMA flood zone
- X (unshaded)
- Chance of flooding over 30 yrs
- 0.0%
- Est. flood insurance / yr
- $473 – $860
Fire risk 1/10 · Minimal
- Est. fire insurance / yr
- $476 – $884
Heat risk 8/10 · Major
- Hot days now (above 101°F)
- 7 days/yr
- Hot days in 30 yrs
- 19 days/yr
Wind risk 8/10 · Major
- Chance of severe wind over 30 yrs
- 80.0%
Air-quality risk 2/10 · Minimal
- Unhealthy air days now
- 1 days/yr
- Unhealthy air days in 30 yrs
- 1 days/yr
Risk factors via First Street. Map © Google.
Why this score? — see what drove the D- grade
The composite is a weighted blend of 9 inputs, each scored 0–100. Each bar is that input's sub-score; the figure is the points it added to the 100-point composite (weight × sub-score).
- Cash flow +13.7/30.0
- Schools +4.2/10.0
- DSCR +4.1/10.0
- 1% rule +3.8/10.0
- Condition / age +3.8/5.0
- Livability +3.4/5.0
- Rent growth +2.7/5.0
- ARV discount +0.0/15.0
- Appreciation +0.0/10.0
$289,900
🖨 Deal sheet (PDF) 📄 Offer letter ✓ Due diligence
Listing remarks MLS
55+ Community. Less than 6 miles to the Lewes public beach. 28'x56' doublewide has a 10'x15' heated & air-conditioned sunroom for a total of 1,718 sq. ft. of living space. Block foundation. Attached, oversized 18'x22' one-car garage. Stainless steel kitchen appliance package. Walk-in pantry. Laundry room with full-size, side-by-side washer & dryer. Rinnai tankless water heater. Spit bedroom plan. En suite main bedroom has a StepSafe walk-in tub & a separate stall shower. Second full bath has a tub/shower. Two pet limit. Lot rent of approx. $720/mt includes trash/recycle. Nominal monthly fee for the indoor pool. Homeowner pays electric, water, sewer, fuel (natual gas) & lawn maintenance. Park application is required with acceptance based on: 1)income verification; 2)satisfactory credit bureau score - including debt-to-income ratio; and 3)clean criminal background check. Family & friends may always visit, but no rentals of any kind.
Key facts
- 4,356 sq ft lot
- Garage
- Community pool
Property features AI
Finance
- Other: Income/expense note: annual ground rent
- Financial info: Monthly ground lease payment (land lease) of $881; Ground rent paid annually by community records; Approximately 1 year remaining on land lease term
- HOA & community: HOA/association amenities include indoor pool, community center, dog park, party room, common grounds, and road maintenance; HOA/association fees cover pool(s) and road maintenance
Exterior
- Parking: Attached garage with automatic garage door opener (1 garage space); Asphalt and concrete driveways; Driveway parking for about 4 vehicles; Total of 5 garage and parking spaces
- Utilities: Public water; Public sewer; Municipal trash service; Cable and satellite internet available; Tankless hot water
- Home design: Manufactured double-wide home (Ritzcraft); Single-story living (main-level living); Senior community with 55+ age requirement; Excellent property condition; Land lease community (ground rent exists)
- Construction: Vinyl siding exterior; Shingle roof; Foundation: block, pillar/post/pier, and stone; Double-wide dimensions approximately 28 ft by 56 ft; Finished above-grade living area (estimated)
- Exterior features: Landscaped grounds; Enclosed outdoor living area and porch(es); Not in a federal flood zone; 2+ access exits; Private road responsibility; Black top road surface
Interior
- Kitchen: Built-in microwave; Dishwasher; Disposal; Gas range/oven; Refrigerator; Stainless steel appliances
- Bedrooms: Three main-level bedrooms
- Flooring: Luxury vinyl plank flooring
- Bathrooms: Two full bathrooms (both on the main level)
- Heating & cooling: Forced air heating; Wall unit heating; Central air conditioning; Ceiling fans; Electric cooling fuel; 200+ amp electrical service with 220 volts
- Interior features: Open floor plan with combination dining/living area; Formal dining room; Breakfast area; Kitchen island; Pantry; Master bathroom; Walk-in closet(s); Recessed lighting; Ceiling fan(s); Window treatments; Tray ceilings; Drywall interior walls; Bathroom with walk-in shower; Jetted tub; Tub/shower combination; Insulated, sliding glass, and storm doors
- Laundry & utility: Washer and dryer in unit (electric dryer); Has laundry on the main floor; Tankless water heater
Neighborhood map
What this means for you Summary
Snapshot
- This is a 3-bed/2.0-bath single-family listed at $290k. Condition is rated good.
Deal economics
- At list price, monthly cash flow is $20 ($243/yr) — positive.
- The deal already cash-flows at list — no discount required.
- To meet the 1% rule (rent ≥ 1% of price), the offer needs to be $256k (11.6% below list).
- Recommended offer: $256k (11.6% below list) — sets the bar for 1% rule.
- Cap rate 6.4% vs local median 1.8% in Lewes — top-decile yield for the area; either an underpriced asset or a hidden risk that comps aren't pricing in. Stress-test before assuming the spread holds.
Location & tenants
- Location reads 67/100 on livability (#40 in DE) — a middle-class / working-renter tenant base. Strengths: crime A+, employment A+, health & safety A+; Watch: commute F, cost of living F.
- Cape Henlopen School District (town): math 42% / reading 55% proficiency, ranked #5 of 26 in DE (top 19%) — families likely to look elsewhere, expect single-tenant / working-renter base with shorter leases.
- Zoned schools: Milton Elementary School (math 47% / reading 57%, grade C-, #13 of 105 statewide, top 12%, 556 students, 0% FRL); Mariner Middle School (math 32% / reading 48%, grade F, #7 of 36 statewide, top 17%, 664 students, 0% FRL); Cape Henlopen High School (math 26% / reading 51%, grade F, #14 of 40 statewide, top 33%, 1,813 students, 0% FRL) — zoned schools average 0% FRL vs 41% district-wide (41 pts lower); this property's tenant base skews higher-income than the district average.
- Market conditions: Rents flat; 822 active listings in the ZIP; 6 comparable units currently listed for rent nearby; rentals lingering (median 46d on market — plan ~5-8 weeks vacancy on turnover, expect pricing pressure); 67% of comp listings sitting > 30 days — soft ceiling on asking rent; solid renter incomes; 4,354 units permitted in Sussex County in 2024 (344 in 5+ unit buildings).
- This rent runs 32% of the median local income ($97k/yr) — at the standard rent-burdened threshold; future hikes will face affordability resistance.
Forward outlook
- Local home prices are declining (-3.0%/yr); year-one equity from $2k of loan paydown is wiped out by about $9k of value loss. Plan a longer hold.
- Sussex County population projected at +25% by 2050 — long-run rental-demand tailwind backs the buy-and-hold thesis.
Negotiation context
- Only 9 days on market — expect competitive offers; lowballing is unlikely to land.
- 2 sale attempts since 5y ago; this cycle's ask is 45% above the opening price — seller raised mid-cycle; expect resistance to lowballs.
- Current owner paid $200k; 45% above their basis — modest negotiation headroom, anchor on the comps not their cost.
Risks & watch-outs
- Climate carrying-cost: severe wind risk, 80% chance of damaging wind over 30y; extreme-heat days projected 7→19/yr by 2055 (HVAC capex compounding) — expect insurance premiums to compound above CPI over the hold.
Questions for the listing agent
- Is there a deadline driving the sale (1031 exchange, divorce, estate, relocation)? That informs how much negotiation room exists.
- Schools are B-rated — typically a magnet for longer-tenancy family renters. What's the average tenant stay here, and is there a school-zone premium baked into asking?
- The area grade is low — what's the realistic commute time and amenity access for the typical tenant pool here? Any planned neighborhood developments (good or bad) we should know about?
- What's the average days-on-market for RENTAL listings here right now (not sales)? A rising rental-DOM trend means longer vacancies and softer asking-rent achievability than the comps imply.
- What's the recent tenant-quality profile in this submarket — average credit score on applications, eviction rate, late-payment / NSF rate, and stable-employment percentage? A property-management company in the area should have these aggregated.
- How much new for-sale + rental construction is in the pipeline within 1–3 miles? Heavy new supply typically softens prices + rents 12–24 months out; constrained supply supports both.
Investment metrics
- 1% rule
- 0.88% ✗
- Cap rate
- 6.38%
- Cash-on-cash
- 0.30%
- DSCR
- 1.01
- GRM
- 9.4
CMA / ARV
- ARV (on-the-fly)
- $236,300
- Comps found
- 12
Show comp detail 12 sales within ~0.75 mi
| Address | Dist | Beds/Ba | Sqft | Sold | Price | $/sf | Match |
|---|---|---|---|---|---|---|---|
| 18 Buckingham Dr | 0.28mi | 3/2.0 | 1,680 (-1%) | 2mo | $266,000 | $158 | 84 |
| 32 Kings Xing | 0.21mi | 3/2.0 | 1,650 (-3%) | 4mo | $208,000 | $126 | 81 |
| 5 Folkstone Ln | 0.34mi | 3/2.0 | 1,798 (+6%) | 1mo | $250,000 | $139 | 74 |
| 11 Madelyn's Way | 0.29mi | 3/2.0 | 1,600 (-6%) | 4mo | $190,000 | $119 | 74 |
| 2 Folkstone Ln | 0.32mi | 3/2.0 | 1,600 (-6%) | 3mo | $199,000 | $124 | 73 |
| 32164 Deerwood Ln | 0.52mi | 3/2.0 | 1,728 (+2%) | 2mo | $485,000 | $281 | 72 |
| 25 Kings Xing | 0.18mi | 3/2.0 | 1,488 (-12%) | 1mo | $207,444 | $139 | 70 |
| 24622 Merlot Dr | 0.51mi | 3/2.0 | 1,600 (-6%) | 0mo | $490,000 | $306 | 66 |
| 38 Buckingham Dr | 0.41mi | 3/2.0 | 1,568 (-8%) | 2mo | $218,000 | $139 | 66 |
| 13079 Laurel Leaf Dr | 0.68mi | 3/2.0 | 1,772 (+4%) | 0mo | $590,000 | $333 | 61 |
| 31309 Coventry Dr | 0.57mi | 3/2.0 | 1,500 (-12%) | 3mo | $470,000 | $313 | 51 |
| 31655 Janice Rd Unit A-36 | 0.68mi | 3/2.0 | 1,456 (-14%) | 2mo | $134,000 | $92 | 43 |
Match score weights: distance 35% · size 25% · config 20% · recency 20%. Top-matched comps best support the ARV.
Projected returns pro-forma
-3.0% appreciation · 0.77% rent growth · sell at horizon
- IRR
- -18.3%
- Equity multiple
- 0.37×
- Total profit
- $-51,271
- Equity at exit
- $43,225
- IRR
- -15.8%
- Equity multiple
- 0.20×
- Total profit
- $-64,892
- Equity at exit
- $25,065
Cash invested: $81,172 (down + closing). Projections, not guarantees.
Landlord ↔ Tenant lean methodology
- Overall (STATE)
- 70 Landlord-Friendly
- State Delaware
- 70 Landlord-Friendly · D+7
- County
- — inherits STATE
- City
- — inherits STATE
ZIP-level market 19958
- Rents YoY
- 0.8%
- Active inventory
- 822
- Price-to-rent
- 9.4×
Monthly cashflow live
- Estimated rent
- $2,562 high interval (Pro) →
- Mortgage (P&I)
- −$1,520
- Tax est. 1.5%
- −$362 /mo · $4,348/yr
- Insurance
- −$121
- HOA
- −$0
- Vacancy / Maint / Mgmt
- −$538
- Net cashflow
- $20
Break-even live
Sensitivity live
| Price | -10% $221 | -5% $120 | +0% $20 | +5% $-80 | +10% $-180 |
|---|---|---|---|---|---|
| Rent | -10% $-182 | -5% $-81 | +0% $20 | +5% $121 | +10% $223 |
| Rate | -1.0pp $166 | -0.5pp $94 | base $20 | +0.5pp $-55 | +1.0pp $-131 |
UW: 25.0% down · 7.5% · 30yr · 1.5% tax · 5.0% vac · 8.0% maint · 8.0% mgmt
Financing live
Cash to close
- Down payment
- $72,475
- Closing costs
- $8,697
- Reserves months
- —
- Total cash needed
- —
Loan-product check · same deal, 3 products live
Conventional
25% down · 7.5% · 30yr
- Down + closing
- —
- Monthly P&I
- —
- Monthly cashflow
- —
- DSCR
- —
- Eligible?
- —
Personal DTI + credit; lowest rate.
DSCR
20% down · 8.5% · 30yr
- Down + closing
- —
- Monthly P&I
- —
- Monthly cashflow
- —
- DSCR
- —
- Eligible?
- —
No personal income docs; deal must DSCR.
Hard money
10% down · 12.0% · 12mo
- Down + closing
- —
- Monthly P&I
- —
- Monthly cashflow
- —
- DSCR
- —
- Eligible?
- —
Short-term bridge; refi at stabilization.
Rent comps 6 comps
| Address | Beds | Baths | Sqft | Rent | $/sqft | DOM | Units | Dist |
|---|---|---|---|---|---|---|---|---|
| 20141 Riesling Ln #306 Lewes, DE | 2.0 | 2.0 | 1600 | $2,600 | $1.62 | 45d | 1 | 0.62mi |
| 24258 Zinfandel Ln Lewes, DE | 2.0 | 2.0 | 1300 | $2,300 | $1.77 | 45d | 1 | 0.66mi |
| 12001 Old Vine Blvd Lewes, DE | 1.0–2.0 | 1.0–2.0 | 987 | $3,055 | $3.10 | 15d | 17 | 0.66mi |
| 24238 Zinfandel Ln Lewes, DE | 2.0 | 2.0 | 1300 | $2,300 | $1.77 | 45d | 1 | 0.71mi |
| 17010 Minos Conaway Rd Lewes, DE | 3.0 | 2.0 | 1600 | $2,500 | $1.56 | 45d | 1 | 1.10mi |
| 17432 Slipper Shell Way #5 Lewes, DE | 3.0 | 2.0 | 1840 | $2,150 | $1.17 | 23d | 1 | 1.34mi |
Listing history 11 events
-
2026-06-22days on market $289,900 Active 9 DOM
-
2026-06-18days on market $289,900 Active 6 DOM
-
2026-06-17days on market $289,900 Active 5 DOM
-
2026-06-16days on market $289,900 Active 4 DOM
-
2026-06-15days on market $289,900 Active 3 DOM
-
2026-06-13statusdays on market $289,900 Active 1 DOM
-
2026-06-10days on market $289,900 Coming Soon 4 DOM
-
2026-06-09days on market $289,900 Coming Soon 3 DOM
-
2026-06-08days on market $289,900 Coming Soon 2 DOM
-
2026-06-07remarks 685-char remark
-
2026-06-07$289,900 Coming Soon 1 DOM
ⓘ Source: listings_history table (triggers on properties + properties_extension) + one-shot
backfill from property_details.listing_events for pre-trigger history.
Climate risk First Street
- Flood 1/10 Low FEMA zone X (unshaded) · 0% chance over 30 yrs
- Wildfire 1/10 Low
- Heat 8/10 Severe 7 d/yr ≥101°F today · 19 d/yr by 30 yrs out
- Wind 8/10 Severe 80% chance of damaging wind over 30 yrs
- Air quality 2/10 Low 1 unhealthy d/yr today · 1 by 30 yrs out
Nearby sold comps map
Loading sold comps map…
Walkable amenities ~0.75 mi
Loading nearby amenities…
Taxation est. · year 1
- Rental income
- $30,739
- − Mortgage interest
- −$16,239
- − Property taxes
- −$4,348
- − Insurance
- −$1,450
- − Repairs & maintenance
- −$2,459
- − Management
- −$2,459
- − Depreciation
- −$8,433
- Taxable loss
- −$4,649
- Est. tax savings @ 24.0%
- +$1,116
- After-tax cash flow
- $1,359/yr
For passive investors: Depreciation is non-cash, so a rental often shows a tax loss while cash-flowing — sheltering income. Rental losses are passive: they offset passive income freely, and up to $25,000/yr can offset ordinary (W-2) income if you actively participate and your MAGI is under $100k (phasing out to $0 by $150k); unused losses carry forward. On sale, claimed depreciation is recaptured at up to 25%, and gains may owe capital-gains tax (a 1031 exchange can defer both). Figures are a year-1 estimate at your 24.0% rate — not tax advice; consult a CPA.
Condition & rehab AI · 12 photos
This 2004-built Ritzcraft home in Sussex West is in good condition with a good condition score of 75. It has a good kitchen, bathrooms, and exterior. The home is move-in ready with minor maintenance needed.
Value-add opportunities
- Both Painting the exterior and interior walls — Fresh paint can enhance curb appeal and interior aesthetics.
- Both Updating the flooring in the kitchen and bathrooms — New flooring can improve the look and feel of the home, making it more appealing to potential buyers or renters.
Renovation cost estimate screening
Value-add ROI direction
- Both Painting the exterior and interior walls — Fresh paint can enhance curb appeal and interior aesthetics. ↑
- Both Updating the flooring in the kitchen and bathrooms — New flooring can improve the look and feel of the home, making it more appealing to potential buyers or renters. ↑
ⓘ Cost ranges are severity-bucket heuristics (US national rule-of-thumb). Get contractor quotes + a written scope before underwriting a rehab budget.
Schools (NCES district)
- District
- Cape Henlopen School District
- NCES district ID
- 1000170
- Math proficiency
- 42% ▼ -14.00%
- Reading proficiency
- 55% ▼ -10.00%
- Median HH income
- $60,196
- Composite
- 42.47/100
- National rank
- #3214
- State rank
- #5 of 26 in DE
Livability — Lewes
- Score
- 67/100
- State rank
- #40
- US rank
- #11077
Category grades
Schools grade is shown separately in the Schools card above.
Census & demographics
- County
- Sussex County · 82,708 people
- City population
- 31,938
- Metro
- Salisbury, MD-DE
- Population (ZIP)
- 31,938
- Household income
- $97,197
- Rent vs Own
- Severe rent burden
- 545.0
Population outlook (Sussex County) Hauer SSP2
- Today (2025)
- 248,853 people
- By 2030
- 264,464 · +6.3%
- By 2040
- 290,980 · +16.9%
- By 2050
- 311,259 · +25.1%
- By 2075
- 352,488 · +41.6%
- By 2100
- 367,406 · +47.6%
Race, ethnicity, and origin ACS 2023
- Neighborhood character
- Predominantly White (88%)
- Race & ethnicity
- White 88% Two or more races 6% Hispanic / Latino 4% Black 2% Asian 2%
- Common ancestry
- Romanian 6% Slovak 3% Italian 2%
- Foreign-born
- 6% · Canada
- Languages at home
- 93% English-only · Spanish 3% Other Indo-European 1% Russian/Polish/Slavic 1%
Political lean MEDSL · Sussex
- 2024 margin
- R (+11.0) · D 43.9% · R 54.9% · Other 1.2%
- 2008→2024 swing
- -2.4pp toward R · 2008: -8.6pp · 2024: -11.0pp
- All cycles
- 2024: R+11.0 2020: R+11.2 2016: R+22.0 2012: R+13.0 2008: R+8.6
Not yet ingested
- Civics
- —
Market trends
- HPI YoY
- ▼ -204.07%
- Current HPI
- 299.0736
- Rent YoY
- ▲ 0.77%
- Metro
- Salisbury, MD-DE
- State GDP YoY
- —
- F500 in state
- 0
Price history
+65.7% since first listed7 events — show timeline
- 2026-06-06 Coming Soon $289,900 BRIGHT MLS
- 2022-08-26 Listed $199,900 BRIGHT MLS
- 2022-08-25 Sold (MLS) $199,900 BRIGHT MLS
- 2021-07-09 Sold (MLS) $173,000 BRIGHT MLS
- 2021-06-27 Pending — BRIGHT MLS
- 2021-06-12 Contingent — BRIGHT MLS
- 2021-06-04 Listed $175,000 BRIGHT MLS
Cash-flow waterfall
monthlySold comps — $/sqft
last 12 mo · ≤1 miLoading sold comps…