 🏷️ Likely Rental
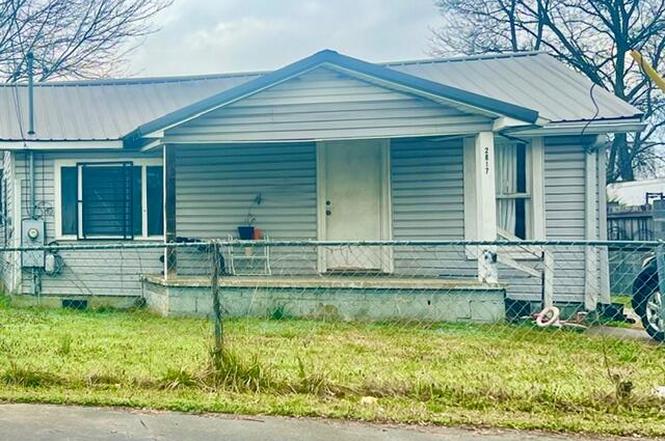
2817 Morgan Ave · Chattanooga, TN
Flood risk 10/10 · Severe
- FEMA flood zone
- X (shaded)
- Chance of flooding over 30 yrs
- 0.99%
- Est. flood insurance / yr
- $507 – $1,088
Fire risk 1/10 · Minimal
- Est. fire insurance / yr
- $949 – $1,763
Heat risk 6/10 · Moderate
- Hot days now (above 104°F)
- 7 days/yr
- Hot days in 30 yrs
- 20 days/yr
Wind risk 4/10 · Minor
- Chance of severe wind over 30 yrs
- 12.0%
Air-quality risk 3/10 · Minor
- Unhealthy air days now
- 2 days/yr
- Unhealthy air days in 30 yrs
- 2 days/yr
Risk factors via First Street. Map © Google.
Why this score? — see what drove the B+ grade
The composite is a weighted blend of 9 inputs, each scored 0–100. Each bar is that input's sub-score; the figure is the points it added to the 100-point composite (weight × sub-score).
- Cash flow +30.0/30.0
- ARV discount +15.0/15.0
- DSCR +10.0/10.0
- 1% rule +9.0/10.0
- Livability +3.9/5.0
- Schools +2.7/10.0
- Rent growth +2.5/5.0
- Condition / age +2.5/5.0
- Appreciation +0.0/10.0
$98,680
🖨 Deal sheet 📄 Offer letter ✓ Due diligence
Listing remarks
This is a two-bedroom, one bath ranch home, is a great investment property with a long-term tenant. Being sold as is.
Key facts
- 7,000 sq ft lot
- Built 1950
- Listed 109 days
Property features AI
Exterior
- Parking: Off-street parking
- Utilities: Public water; Public sewer; Electricity connected; Water connected; Sewer connected
- Home design: Single-family residence; One story
- Construction: Vinyl siding; Block foundation; Shingle roof; Built area above grade: 864
- Exterior features: Level lot; Paved city street frontage; Publicly maintained road
Interior
- Kitchen: Refrigerator; Free‑standing electric range; Free‑standing electric oven
- Bedrooms: Total rooms: 5
- Bathrooms: 1 full bathroom
- Heating & cooling: Central heating (electric); Central air conditioning
- Interior features: Eat-in kitchen
Neighborhood map
What this means for you Summary
Snapshot
- This is a 2-bed/1.0-bath single-family listed at $99k.
Deal economics
- At list price, monthly cash flow is $441 ($5k/yr) — positive.
- The deal already cash-flows at list — no discount required.
- Meets the 1% rule at list price ($1k rent vs $99k).
- Recommended offer: $90k (9.0% below list) — sets the bar for market timing.
- Cap rate 12.5% vs local median 3.4% in Chattanooga — top-decile yield for the area; either an underpriced asset or a hidden risk that comps aren't pricing in. Stress-test before assuming the spread holds.
Location & tenants
- Location reads 78/100 on livability (#3 in TN, #2,582 nationally) — a middle-class / working-renter tenant base. Strengths: amenities A+, commute A+, cost of living A+; Watch: employment D+, crime F.
- Hamilton County (urban): math 31% / reading 31% proficiency, ranked #42 of 139 in TN (top 30%) — families likely to look elsewhere, expect single-tenant / working-renter base with shorter leases.
- Zoned schools: Hixson Elementary (math 24% / reading 20%, grade F, #601 of 952 statewide, top 66%, 402 students, 0% FRL) — zoned schools average 0% FRL vs 52% district-wide (52 pts lower); this property's tenant base skews higher-income than the district average.
- Market conditions: Rents flat; 167 active listings in the ZIP; 37 comparable units currently listed for rent nearby; rentals at typical pace (median 23d on market — plan ~3-4 weeks tenant-placement turnaround); 2,133 units permitted in Hamilton County in 2024 (405 in 5+ unit buildings).
Forward outlook
- Local home prices are declining (-3.0%/yr); year-one equity from $682 of loan paydown is wiped out by about $3k of value loss. Plan a longer hold.
- Hamilton County population projected at +23% by 2050 — long-run rental-demand tailwind backs the buy-and-hold thesis.
- At projected returns (-3.0% appreciation + 0.0% rent growth), your $28k cash investment doubles in ~9 years — after that, you're playing with house money.
Negotiation context
- It's been on market 110 days — a 9% lower offer ($90k) is reasonable based on typical stale-listing flexibility.
- 3 sale attempts since 22y ago with the ask held roughly flat each time — persistent listings suggest the price (not the market) is what's stuck; bring a comps-based counter.
Risks & watch-outs
- Watch-outs: flood insurance adds $66/mo; built in 1950 — expect roof / HVAC / electrical / plumbing capex.
- Climate carrying-cost: severe flood risk; extreme-heat days projected 7→20/yr by 2055 (HVAC capex compounding) — expect insurance premiums to compound above CPI over the hold.
Questions for the listing agent
- It's been on market 110 days. Have you received any prior offers? Is the seller open to a 9% concession, seller financing, or rate buy-down credit?
- Built in 1950 — when were the roof, HVAC, electrical panel, plumbing, and water heater last replaced?
- What's the actual annual flood-insurance premium (NFIP or private), and is the property in a SFHA with mandatory coverage?
- Why hasn't it sold? Are there any deal-killer items the seller is aware of (foundation, flood, title, zoning, code violations)?
- Is there a deadline driving the sale (1031 exchange, divorce, estate, relocation)? That informs how much negotiation room exists.
- Schools are F-rated, which usually means shorter tenancies and higher turnover. Who's the typical renter profile here, and what's been the actual vacancy rate?
- Crime grade is F in this area — have there been break-ins, vandalism, or insurance claims at this property in the last 3 years? What carrier currently insures it and at what premium?
- What's the average days-on-market for RENTAL listings here right now (not sales)? A rising rental-DOM trend means longer vacancies and softer asking-rent achievability than the comps imply.
- What's the recent tenant-quality profile in this submarket — average credit score on applications, eviction rate, late-payment / NSF rate, and stable-employment percentage? A property-management company in the area should have these aggregated.
- How much new for-sale + rental construction is in the pipeline within 1–3 miles? Heavy new supply typically softens prices + rents 12–24 months out; constrained supply supports both.
Investment metrics
- 1% rule
- 1.40% ✓
- Cap rate
- 12.46%
- Cash-on-cash
- 22.02%
- DSCR
- 1.98
- GRM
- 5.9
CMA / ARV
- ARV (on-the-fly)
- $184,896
- Comps found
- 2
Show comp detail 2 sales within ~0.75 mi
| Address | Dist | Beds/Ba | Sqft | Sold | Price | $/sf | Match |
|---|---|---|---|---|---|---|---|
| 1204 E 35th St | 0.75mi | 3/1.0 (+1) | 832 (-4%) | 1mo | $178,000 | $214 | 53 |
| 2910 Faxon St | 0.42mi | 2/1.0 | 768 (-11%) | 11mo | $134,800 | $176 | 53 |
Match score weights: distance 35% · size 25% · config 20% · recency 20%. Top-matched comps best support the ARV.
Projected returns pro-forma
-3.0% appreciation · 0.03% rent growth · sell at horizon
- IRR
- 7.7%
- Equity multiple
- 1.29×
- Total profit
- $8,056
- Equity at exit
- $14,714
- IRR
- 14.3%
- Equity multiple
- 2.00×
- Total profit
- $27,630
- Equity at exit
- $8,532
Cash invested: $27,630 (down + closing). Projections, not guarantees.
Landlord ↔ Tenant lean methodology
- Overall (STATE)
- 87 Strongly Landlord-Friendly
- State Tennessee
- 87 Strongly Landlord-Friendly · R+13
- County
- — inherits STATE
- City
- — inherits STATE
ZIP-level market 37404
- Home prices YoY
- -30.6%
- Rents YoY
- 0.0%
- Active inventory
- 167
- Price-to-rent
- 5.9×
Monthly cashflow live
- Estimated rent
- $1,384 high interval (Pro) →
- Mortgage (P&I)
- −$517
- Tax from tax record
- −$27 /mo · $329/yr
- Insurance
- −$41
- Flood insurance flood zone
- −$66 /mo · $798/yr
- HOA
- −$0
- Vacancy / Maint / Mgmt
- −$291
- Net cashflow
- $441
Break-even live
UW: 25.0% down · 7.5% · 30yr · 1.5% tax · 5.0% vac · 8.0% maint · 8.0% mgmt
Financing live
Cash to close
- Down payment
- $24,670
- Closing costs
- $2,960
- Reserves months
- —
- Total cash needed
- —
Loan-product check · same deal, 3 products live
Conventional
25% down · 7.5% · 30yr
- Down + closing
- —
- Monthly P&I
- —
- Monthly cashflow
- —
- DSCR
- —
- Eligible?
- —
Personal DTI + credit; lowest rate.
DSCR
20% down · 8.5% · 30yr
- Down + closing
- —
- Monthly P&I
- —
- Monthly cashflow
- —
- DSCR
- —
- Eligible?
- —
No personal income docs; deal must DSCR.
Hard money
10% down · 12.0% · 12mo
- Down + closing
- —
- Monthly P&I
- —
- Monthly cashflow
- —
- DSCR
- —
- Eligible?
- —
Short-term bridge; refi at stabilization.
Rent comps 37 comps
| Address | Beds | Baths | Sqft | Rent | $/sqft | DOM | Units | Dist |
|---|---|---|---|---|---|---|---|---|
| 1503 E 18th St Chattanooga, TN | 2.0 | 1.0 | 624 | $1,150 | $1.84 | 23d | 1 | 0.88mi |
| 3603 Dorris St Chattanooga, TN | 2.0 | 1.0 | 700 | $825 | $1.18 | 23d | 1 | 0.88mi |
| 3605 Dorris St Chattanooga, TN | 2.0 | 1.0 | 700 | $825 | $1.18 | 23d | 1 | 0.89mi |
| 2100 Rossville Ave Chattanooga, TN | 1.0–2.0 | 1.0–2.0 | 1140 | $2,199 | $1.93 | 13d | 13 | 0.90mi |
| 3713 Dorris St Chattanooga, TN | 3.0 | 1.0 | 974 | $1,025 | $1.05 | 13d | 1 | 0.98mi |
| 1603 Fagan St #202 Chattanooga, TN | 2.0 | 2.0 | 1048 | $1,875 | $1.79 | 23d | 1 | 1.07mi |
| 1603 Fagan St Chattanooga, TN | 2.0 | 2.0 | 1048 | $1,895 | $1.81 | 23d | 1 | 1.07mi |
| 2001 S Lyerly St Chattanooga, TN | 2.0–3.0 | 2.0 | 1080 | $1,200 | $1.11 | 13d | 6 | 1.11mi |
| 900 E Main St Chattanooga, TN | 1.0–2.0 | 1.0–2.0 | 752 | $1,845 | $2.45 | 21d | 16 | 1.15mi |
| 1445 Fagan St Chattanooga, TN | 1.0 | 1.0 | 803 | $1,300 | $1.62 | 13d | 1 | 1.17mi |
| 901 E Main St Chattanooga, TN | 2.0 | 1.0 | 710 | $1,290 | $1.82 | 13d | 1 | 1.17mi |
| 4129 Quinn Adams St Unit 2 Chattanooga, TN | 2.0 | 1.0 | 856 | $1,050 | $1.23 | 23d | 1 | 1.19mi |
| 4113 Dorris St Apt B Chattanooga, TN | 2.0 | 1.0 | 750 | $950 | $1.27 | 23d | 1 | 1.21mi |
| 2605 Carr St Apt A Chattanooga, TN | 2.0 | 1.0 | 850 | $1,600 | $1.88 | 23d | 1 | 1.23mi |
| 1133 Bexley Sq Chattanooga, TN | 3.0 | 1.0–2.0 | 913 | $2,134 | $2.34 | 13d | 22 | 1.24mi |
| 614 E Main St #205 Chattanooga, TN | 1.0 | 1.0 | 650 | $1,500 | $2.31 | 23d | 1 | 1.25mi |
| 3818 Chandler Ave Chattanooga, TN | 2.0 | 1.5 | 900 | $1,450 | $1.61 | 13d | 1 | 1.26mi |
| 614 E Main St Chattanooga, TN | 1.0 | 1.0 | 1050 | $1,675 | $1.60 | 23d | 1 | 1.26mi |
| 1703 S Lyerly St Chattanooga, TN | 2.0 | 1.0 | 700 | $1,199 | $1.71 | 13d | 1 | 1.27mi |
| 1812 E 13th St Unit B Chattanooga, TN | 2.0 | 1.0 | 800 | $1,065 | $1.33 | 23d | 1 | 1.27mi |
| 623 E Main St Unit 105 Chattanooga, TN | 1.0 | 1.0 | 537 | $1,280 | $2.38 | 23d | 1 | 1.27mi |
| 623 E Main St Apt 205 Chattanooga, TN | 1.0 | 1.0 | 573 | $1,350 | $2.36 | 13d | 1 | 1.27mi |
| 1530 Adams St Chattanooga, TN | 1.0 | 1.0 | 930 | $2,000 | $2.15 | 21d | 1 | 1.30mi |
| 2417 13th Ave Chattanooga, TN | 2.0 | 1.0 | 950 | $1,150 | $1.21 | 23d | 1 | 1.31mi |
| 2609 14th Ave Unit 3 Chattanooga, TN | 1.0 | 1.0 | 616 | $850 | $1.38 | 23d | 1 | 1.35mi |
| 3609 Carl White Pl Chattanooga, TN | 2.0 | 1.0 | 1100 | $799 | $0.73 | 23d | 1 | 1.37mi |
| 2602 14th Ave Unit B Chattanooga, TN | 2.0 | 1.0 | 700 | $1,050 | $1.50 | 23d | 1 | 1.37mi |
| 1711 Read Ave Unit A Chattanooga, TN | 3.0 | 1.5 | 1010 | $1,700 | $1.68 | 21d | 1 | 1.38mi |
| 2400 15th Ave Unit 336 Chattanooga, TN | 1.0 | 1.0 | 625 | $950 | $1.52 | 23d | 1 | 1.38mi |
| 2903 15th Ave Chattanooga, TN | 2.0 | 1.5 | 1100 | $1,450 | $1.32 | 23d | 1 | 1.38mi |
| 245 W 26th St Chattanooga, TN | 1.0 | 1.0 | 750 | $1,285 | $1.71 | 13d | 21 | 1.38mi |
| 1818 Dodds Ave Chattanooga, TN | 2.0 | 1.0 | 1036 | $1,099 | $1.06 | 13d | 1 | 1.39mi |
| 2612 E 19th St Chattanooga, TN | 2.0 | 1.0 | 900 | $1,150 | $1.28 | 23d | 1 | 1.40mi |
| 3114 14th Ave Apt A Chattanooga, TN | 1.0 | 1.0 | 800 | $950 | $1.19 | 23d | 1 | 1.41mi |
| 2318 E Main St Chattanooga, TN | 2.0 | 2.0 | 1000 | $1,515 | $1.51 | 13d | 1 | 1.43mi |
| 2904 E 37th St Chattanooga, TN | 1.0 | 1.0 | 800 | $850 | $1.06 | 23d | 1 | 1.44mi |
| 3059 Saint Elmo Ave Chattanooga, TN | 1.0 | 2.0 | 1104 | $1,450 | $1.31 | 23d | 1 | 1.49mi |
Listing history 17 events
-
2026-06-18days on market $98,680 Active 110 DOM
-
2026-06-17days on market $98,680 Active 109 DOM
-
2026-06-16days on market $98,680 Active 108 DOM
-
2026-06-15days on market $98,680 Active 107 DOM
-
2026-06-14days on market $98,680 Active 105 DOM
-
2026-06-10statusdays on market $98,680 Active 102 DOM
-
2026-06-01status $98,680 Pending 101 DOM
-
2026-05-31days on market $98,680 Active 101 DOM
-
2026-05-30days on market $98,680 Active 100 DOM
-
2026-04-07price $98,680
-
2026-02-19$103,680 Active
-
2013-07-15soldstatus $3,727,608
-
2011-05-02soldstatus $300,900
-
2005-07-07soldstatus $203,000
-
2004-10-18$55,000
-
2004-05-15$45,000
-
2004-03-23soldstatus $19,824
ⓘ Source: listings_history table (triggers on properties + properties_extension) + one-shot
backfill from property_details.listing_events for pre-trigger history.
Tax reassessment forecast TN · Resets to sale price
- Current annual tax
- $329 · $27/mo
- Projected year-2 tax
- $701 · $58/mo
- Expected delta
- +$372/yr (+$31/mo · 113.0%)
ⓘ Screening estimate from a state-policy table — verify with the county assessor before closing.
Climate risk First Street
- Flood 10/10 Extreme FEMA zone X (shaded) · 99% chance over 30 yrs
- Wildfire 1/10 Low
- Heat 6/10 Major 7 d/yr ≥104°F today · 20 d/yr by 30 yrs out
- Wind 4/10 Moderate 12% chance of damaging wind over 30 yrs
- Air quality 3/10 Moderate 2 unhealthy d/yr today · 2 by 30 yrs out
Nearby sold comps map
Loading sold comps map…
Walkable amenities ~0.75 mi
Loading nearby amenities…
Taxation est. · year 1
- Rental income
- $16,603
- − Mortgage interest
- −$5,528
- − Property taxes
- −$329
- − Insurance
- −$1,291
- − Repairs & maintenance
- −$1,328
- − Management
- −$1,328
- − Depreciation
- −$2,871
- Taxable income
- $3,928
- Est. tax owed @ 24.0%
- −$943
- After-tax cash flow
- $4,344/yr
For passive investors: Depreciation is non-cash, so a rental often shows a tax loss while cash-flowing — sheltering income. Rental losses are passive: they offset passive income freely, and up to $25,000/yr can offset ordinary (W-2) income if you actively participate and your MAGI is under $100k (phasing out to $0 by $150k); unused losses carry forward. On sale, claimed depreciation is recaptured at up to 25%, and gains may owe capital-gains tax (a 1031 exchange can defer both). Figures are a year-1 estimate at your 24.0% rate — not tax advice; consult a CPA.
Schools (NCES district)
- District
- Hamilton County
- NCES district ID
- 4701590
- Math proficiency
- 31% ▼ -10.00%
- Reading proficiency
- 31% ▼ -3.00%
- Median HH income
- $47,456
- Composite
- 26.8/100
- National rank
- #7122
- State rank
- #42 of 139 in TN
Livability — Chattanooga
- Score
- 78/100
- State rank
- #3
- US rank
- #2582
Category grades
Schools grade is shown separately in the Schools card above.
Census & demographics
- Census place
- Chattanooga, TN
- County
- Hamilton County · 312,777 people
- City population
- 131,999
- Metro
- Chattanooga, TN-GA
- Population (ZIP)
- 14,737
- Household income
- $56,637
- Rent vs Own
- Severe rent burden
- 486.0
Population outlook (Hamilton County) Hauer SSP2
- Today (2025)
- 393,784 people
- By 2030
- 412,983 · +4.9%
- By 2040
- 449,502 · +14.1%
- By 2050
- 484,341 · +23.0%
- By 2075
- 565,746 · +43.7%
- By 2100
- 618,394 · +57.0%
Race, ethnicity, and origin ACS 2023
- Neighborhood character
- Diverse neighborhood (Simpson 0.67)
- Race & ethnicity
- Black 38% White 38% Hispanic / Latino 21% Two or more races 11%
- Hispanic origin (detail)
- Mexican 3%
- Common ancestry
- Slovak 3% Romanian 1% Lithuanian 1%
- Foreign-born
- 11% · Canada
- Languages at home
- 81% English-only · Spanish 18%
Political lean MEDSL · Hamilton
- 2024 margin
- R (+13.1) · D 42.7% · R 55.7% · Other 1.6%
- 2008→2024 swing
- -1.2pp toward R · 2008: -11.8pp · 2024: -13.1pp
- All cycles
- 2024: R+13.1 2020: R+9.7 2016: R+16.6 2012: R+14.8 2008: R+11.8
Not yet ingested
- Civics
- —
Market trends
- HPI YoY
- ▼ -139.43%
- Current HPI
- 315.8539
- Rent YoY
- ▬ 0.03%
- Metro
- Chattanooga, TN-GA
- State GDP YoY
- ▲ 2.78%
- F500 in state
- 22
Industry mix (Fortune 500 HQ in TN)
| Industry | F500 HQs | Revenue |
|---|---|---|
| Healthcare | 3 | $91B |
|
||
| Retail | 3 | $72B |
|
||
| Transportation / Logistics | 1 | $88B |
|
||
| Paper / Packaging | 1 | $19B |
|
||
| Insurance | 1 | $13B |
|
||
| Energy | 1 | $12B |
|
||
Price history
+397.8% since first listed8 events — show timeline
- 2026-04-07 Price Changed $98,680 GCAR
- 2026-02-19 Listed $103,680 GCAR
- 2013-07-15 Sold (Public Records) $3,727,608 Public Records
- 2011-05-02 Sold (Public Records) $300,900 Public Records
- 2005-07-07 Sold (Public Records) $203,000 Public Records
- 2004-10-18 Listed $55,000 RCAOR
- 2004-05-15 Listed $45,000 RCAOR
- 2004-03-23 Sold (Public Records) $19,824 Public Records
Property tax history
+4.7%/yrLatest (2025): $329 · +56.4% YoY. Source: county tax records.
Cash-flow waterfall
monthlySold comps — $/sqft
last 12 mo · ≤1 miLoading sold comps…