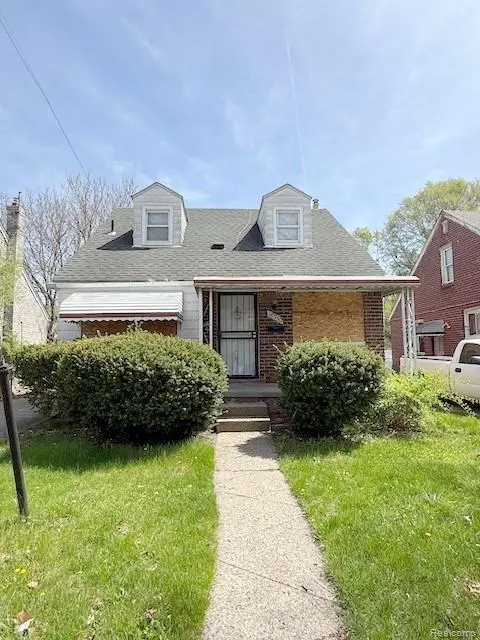
18950 Blackmoor St · Detroit, MI
Flood risk 1/10 · Minimal
- FEMA flood zone
- X (unshaded)
- Chance of flooding over 30 yrs
- 0.0%
- Est. flood insurance / yr
- $473 – $860
Fire risk 1/10 · Minimal
- Est. fire insurance / yr
- $784 – $1,456
Heat risk 3/10 · Minor
- Hot days now (above 96°F)
- 7 days/yr
- Hot days in 30 yrs
- 15 days/yr
Wind risk 2/10 · Minimal
- Chance of severe wind over 30 yrs
- —
Air-quality risk 3/10 · Minor
- Unhealthy air days now
- 2 days/yr
- Unhealthy air days in 30 yrs
- 5 days/yr
Risk factors via First Street. Map © Google.
Why this score? — see what drove the C+ grade
The composite is a weighted blend of 9 inputs, each scored 0–100. Each bar is that input's sub-score; the figure is the points it added to the 100-point composite (weight × sub-score).
- Cash flow +30.0/30.0
- 1% rule +10.0/10.0
- DSCR +10.0/10.0
- Rent growth +4.2/5.0
- Livability +3.7/5.0
- Condition / age +2.5/5.0
- Schools +1.3/10.0
- ARV discount +0.0/15.0
- Appreciation +0.0/10.0
$77,500
🖨 Deal sheet 📄 Offer letter ✓ Due diligence
Listing remarks MLS
SPACIOUS BRICK BUNGALOW HOME LOCATED JUST SOUTH OF SEVEN MILE ROAD AND WEST OF HOOVER. THIS PROPERTY FEATURES A COVERED FRONT PORCH, 2 CAR DETACHED GARAGE, INVITING LIVING ROOM, DINING AREA, KITCHEN, TWO BEDROOMS AND BATH ON THE MAIN FLOOR, LARGE PRIMARY BEDROOM ON THE SECOND FLOOR, AND AN UNFINISHED BASEMENT. THIS WOULD BE A GREAT STARTER HOME OR ADDITION TO YOUR INVESTMENT PORTFOLIO! PROPERTY IS SOLD AS-IS. ALL DIMENSIONS ARE ESTIMATED AND SHOULD BE VERIFIED. ALL SHOWINGS REQUIRE A LICENSED AGENT TO BE PRESENT. BUYER TO PAY DETROIT INVESTMENT CO A 295 PROCESSING FEE AT CLOSING.
Key facts
- Covered front porch
- Brick bungalow
- Unfinished basement
Tags
Property features AI
Exterior
- Parking: Detached 2-car garage
- Utilities: Public water; Public sewer
- Home design: Single-family residence; One and one-half story; Ground-level entry with steps; Brick construction
- Construction: Block foundation
- Exterior features: Paved road access; Lot roughly 40 x 124 (0.11 acre)
Interior
- Bathrooms: 1 full bathroom
- Heating & cooling: Forced air heating (natural gas); No cooling
- Interior features: Unfinished basement; 6 total rooms
Neighborhood map
What this means for you Summary
Snapshot
- This is a 3-bed/1.0-bath single-family listed at $78k.
Deal economics
- At list price, monthly cash flow is $446 ($5k/yr) — positive.
- The deal already cash-flows at list — no discount required.
- Meets the 1% rule at list price ($1k rent vs $78k).
- Recommended offer: $75k (3.0% below list) — sets the bar for market timing.
- Cap rate 13.2% vs local median 10.2% in Detroit — meaningfully above typical; check what's discounted (condition, days-on-market, listing class) to confirm the premium yield is real.
Location & tenants
- Location reads 73/100 on livability (#218 in MI) — a middle-class / working-renter tenant base. Strengths: amenities A+, commute A+, cost of living A+; Watch: schools F, crime F, employment F.
- Detroit Public Schools Community District (urban): math 10% / reading 24% proficiency, ranked #499 of 540 in MI (top 92%) — low school quality limits family demand, transient renter base, plan for 1-2y turnover; 90% free/reduced lunch — lower-income household profile, screen leases tightly.
- Market conditions: Rents rising fast (+6.7%/yr); 226 active listings in the ZIP; 34 comparable units currently listed for rent nearby; rentals at typical pace (median 18d on market — plan ~3-4 weeks tenant-placement turnaround); lower-income renter base — watch delinquency; 2,639 units permitted in Wayne County in 2024 (1,216 in 5+ unit buildings).
- At $1,346/mo this rent would consume 46% of the median local household income ($35k/yr) (locally 2372% of renters already pay >50% of income on rent) — very limited rent-growth headroom before tenants either downsize or default.
Forward outlook
- Local home prices are declining (-3.0%/yr); year-one equity from $536 of loan paydown is wiped out by about $2k of value loss. Plan a longer hold.
- Wayne County population projected at -17% by 2050 — secular population decline; favor cash flow + early exit over multi-decade hold.
- At projected returns (-3.0% appreciation + 6.7% rent growth), your $22k cash investment doubles in ~5 years — after that, you're playing with house money.
Negotiation context
- It's been on market 43 days — a 3% lower offer ($75k) is reasonable based on typical stale-listing flexibility.
- 5 sale attempts with the ask held roughly flat each time — persistent listings suggest the price (not the market) is what's stuck; bring a comps-based counter.
- Current owner paid $60k; 30% above their basis — modest negotiation headroom, anchor on the comps not their cost.
Risks & watch-outs
- Watch-outs: property tax is 2.8% of price; built in 1948 — expect roof / HVAC / electrical / plumbing capex.
Questions for the listing agent
- It's been on market 43 days. Have you received any prior offers? Is the seller open to a 3% concession, seller financing, or rate buy-down credit?
- Built in 1948 — when were the roof, HVAC, electrical panel, plumbing, and water heater last replaced?
- Property tax is high relative to price — has the assessment been appealed recently, and will the sale trigger a re-assessment?
- Is there a deadline driving the sale (1031 exchange, divorce, estate, relocation)? That informs how much negotiation room exists.
- Schools are F-rated, which usually means shorter tenancies and higher turnover. Who's the typical renter profile here, and what's been the actual vacancy rate?
- Crime grade is F in this area — have there been break-ins, vandalism, or insurance claims at this property in the last 3 years? What carrier currently insures it and at what premium?
- What's the average days-on-market for RENTAL listings here right now (not sales)? A rising rental-DOM trend means longer vacancies and softer asking-rent achievability than the comps imply.
- What's the recent tenant-quality profile in this submarket — average credit score on applications, eviction rate, late-payment / NSF rate, and stable-employment percentage? A property-management company in the area should have these aggregated.
- How much new for-sale + rental construction is in the pipeline within 1–3 miles? Heavy new supply typically softens prices + rents 12–24 months out; constrained supply supports both.
Investment metrics
- 1% rule
- 1.74% ✓
- Cap rate
- 13.19%
- Cash-on-cash
- 24.64%
- DSCR
- 2.10
- GRM
- 4.8
CMA / ARV
- ARV (median comp)
- $66,117
- List price
- $77,500
- Delta
- 17.22%
- Verdict
- OVERPRICED
- Comps
- 20 within 1.0 mi
Show comp detail 12 sales within ~0.75 mi
| Address | Dist | Beds/Ba | Sqft | Sold | Price | $/sf | Match |
|---|---|---|---|---|---|---|---|
| 18696 Blackmoor St | 0.08mi | 3/1.0 | 1,010 (-1%) | 0mo | $77,500 | $77 | 94 |
| 8245 E Hildale St | 0.41mi | 3/1.0 | 1,028 (+0%) | 3mo | $45,000 | $44 | 78 |
| 18104 Runyon St | 0.45mi | 3/1.0 | 1,078 (+5%) | 0mo | $58,000 | $54 | 70 |
| 8212 E Lantz St | 0.52mi | 3/1.0 | 989 (-3%) | 2mo | $60,000 | $61 | 69 |
| 17892 Runyon St | 0.55mi | 3/1.5 | 995 (-3%) | 2mo | $56,000 | $56 | 66 |
| 17694 Teppert St | 0.62mi | 3/1.0 | 1,013 (-1%) | 6mo | $120,000 | $118 | 65 |
| 19140 Algonac St | 0.19mi | 2/1.0 (-1) | 892 (-13%) | 1mo | $46,000 | $52 | 64 |
| 19361 Beland St | 0.34mi | 3/1.0 | 901 (-12%) | 2mo | $47,500 | $53 | 63 |
| 8175 House St | 0.42mi | 3/1.0 | 1,160 (+13%) | 1mo | $100,000 | $86 | 58 |
| 17650 Beland St | 0.63mi | 3/1.5 | 1,094 (+7%) | 2mo | $67,000 | $61 | 55 |
| 17665 Runyon St | 0.65mi | 3/2.0 | 1,096 (+7%) | 1mo | $50,000 | $46 | 53 |
| 7505 E Robinwood St | 0.74mi | 4/2.0 (+1) | 1,000 (-2%) | 3mo | $140,500 | $141 | 50 |
Match score weights: distance 35% · size 25% · config 20% · recency 20%. Top-matched comps best support the ARV.
Projected returns pro-forma
-3.0% appreciation · 6.72% rent growth · sell at horizon
- IRR
- 22.5%
- Equity multiple
- 1.97×
- Total profit
- $21,115
- Equity at exit
- $11,556
- IRR
- 33.1%
- Equity multiple
- 4.61×
- Total profit
- $78,365
- Equity at exit
- $6,701
Cash invested: $21,700 (down + closing). Projections, not guarantees.
Landlord ↔ Tenant lean methodology
- Overall (STATE)
- 62 Landlord-Friendly
- State Michigan
- 62 Landlord-Friendly · EVEN
- County
- — inherits STATE
- City
- — inherits STATE
ZIP-level market 48234
- Home prices YoY
- -11.9%
- Rents YoY
- 6.7%
- Active inventory
- 226
- Price-to-rent
- 4.8×
Monthly cashflow live
- Estimated rent
- $1,346 high interval (Pro) →
- Mortgage (P&I)
- −$406
- Tax from tax record
- −$179 /mo · $2,147/yr
- Insurance
- −$32
- HOA
- −$0
- Vacancy / Maint / Mgmt
- −$283
- Net cashflow
- $446
Break-even live
UW: 25.0% down · 7.5% · 30yr · 1.5% tax · 5.0% vac · 8.0% maint · 8.0% mgmt
Financing live
Cash to close
- Down payment
- $19,375
- Closing costs
- $2,325
- Reserves months
- —
- Total cash needed
- —
Loan-product check · same deal, 3 products live
Conventional
25% down · 7.5% · 30yr
- Down + closing
- —
- Monthly P&I
- —
- Monthly cashflow
- —
- DSCR
- —
- Eligible?
- —
Personal DTI + credit; lowest rate.
DSCR
20% down · 8.5% · 30yr
- Down + closing
- —
- Monthly P&I
- —
- Monthly cashflow
- —
- DSCR
- —
- Eligible?
- —
No personal income docs; deal must DSCR.
Hard money
10% down · 12.0% · 12mo
- Down + closing
- —
- Monthly P&I
- —
- Monthly cashflow
- —
- DSCR
- —
- Eligible?
- —
Short-term bridge; refi at stabilization.
Rent comps 34 comps
| Address | Beds | Baths | Sqft | Rent | $/sqft | DOM | Units | Dist |
|---|---|---|---|---|---|---|---|---|
| 18431 Teppert St Detroit, MI | 4.0 | 1.0 | 1200 | $1,400 | $1.17 | 2d | 1 | 0.33mi |
| 11513 Greiner St Unit 11521 Greiner Detroit, MI | 2.0 | 1.0 | 942 | $1,050 | $1.11 | 43d | 1 | 0.56mi |
| 7533 Quinn St Unit 1 Detroit, MI | 2.0 | 1.0 | 700 | $850 | $1.21 | 43d | 1 | 0.71mi |
| 19171 Cliff St Detroit, MI | 3.0 | 1.0 | 1000 | $1,200 | $1.20 | 16d | 1 | 0.82mi |
| 18681 Barlow St Detroit, MI | 3.0 | 1.0 | 1041 | $1,400 | $1.34 | 24d | 1 | 0.86mi |
| 17851 Strasburg St Detroit, MI | 3.0 | 1.0 | 1079 | $1,100 | $1.02 | 17d | 1 | 0.87mi |
| 17241 Rowe St Detroit, MI | 3.0 | 1.5 | 1316 | $1,450 | $1.10 | 17d | 1 | 0.89mi |
| 18703 Waltham St Detroit, MI | 2.0 | 1.0 | 1000 | $1,100 | $1.10 | 43d | 1 | 0.92mi |
| 19691 Cliff St #1 Detroit, MI | 2.0 | 1.0 | 850 | $1,050 | $1.24 | 5d | 1 | 0.95mi |
| 19207 Westphalia St Detroit, MI | 4.0 | 1.0 | 1179 | $1,800 | $1.53 | 17d | 1 | 1.06mi |
| 20290 Annott St Detroit, MI | 3.0 | 1.0 | 1300 | $1,250 | $0.96 | 17d | 1 | 1.09mi |
| 20042 Rogge St Detroit, MI | 4.0 | 2.0 | 1232 | $1,394 | $1.13 | 43d | 1 | 1.09mi |
| 19419 Westphalia St Detroit, MI | 3.0 | 1.0 | 1293 | $1,325 | $1.02 | 17d | 1 | 1.09mi |
| 19143 Fairport St Detroit, MI | 3.0 | 1.0 | 1070 | $1,225 | $1.14 | 17d | 1 | 1.11mi |
| 11074 Kennebec St Detroit, MI | 3.0 | 1.0 | 1200 | $1,350 | $1.12 | 43d | 1 | 1.13mi |
| 18624 Fairport St Detroit, MI | 3.0 | 1.0 | 874 | $1,450 | $1.66 | 22d | 1 | 1.14mi |
| 18624 Fairport St Unit NA Detroit, MI | 3.0 | 1.0 | 924 | $1,450 | $1.57 | 24d | 1 | 1.14mi |
| 19610 Westphalia St Detroit, MI | 3.0 | 1.0 | 1200 | $1,595 | $1.33 | 18d | 1 | 1.17mi |
| 20091 Barlow St Detroit, MI | 3.0 | 1.0 | 930 | $1,300 | $1.40 | 17d | 1 | 1.18mi |
| 18119 Joann St Detroit, MI | 2.0 | 1.0 | 800 | $1,100 | $1.38 | 24d | 1 | 1.20mi |
| 19170 Joann St Detroit, MI | 4.0 | 1.0 | 1020 | $1,400 | $1.37 | 43d | 1 | 1.20mi |
| 8285 Rivard Ave Warren, MI | 3.0 | 1.0 | 902 | $1,549 | $1.72 | 24d | 1 | 1.21mi |
| 11700 Engleside St Detroit, MI | 3.0 | 1.0 | 1000 | $1,175 | $1.18 | 43d | 1 | 1.21mi |
| 8242 Jackson Ave Warren, MI | 3.0 | 1.0 | 840 | $1,198 | $1.43 | 43d | 1 | 1.24mi |
| 11785 Nashville St Detroit, MI | 3.0 | 2.0 | 1360 | $1,450 | $1.07 | 3d | 1 | 1.26mi |
| 19220 Alcoy St Detroit, MI | 3.0 | 1.0 | 1023 | $1,350 | $1.32 | 17d | 1 | 1.27mi |
| 11760 Nashville St Detroit, MI | 3.0 | 1.0 | 1200 | $1,250 | $1.04 | 17d | 1 | 1.28mi |
| 20553 Hamburg St Detroit, MI | 3.0 | 1.0 | 1074 | $1,300 | $1.21 | 3d | 1 | 1.29mi |
| 13218 Greiner St Detroit, MI | 3.0 | 1.0 | 1162 | $1,195 | $1.03 | 18d | 1 | 1.30mi |
| 11228 Sherman Ave Warren, MI | 2.0 | 1.0 | 1000 | $1,200 | $1.20 | 12d | 1 | 1.30mi |
| 7600 Dobel St Detroit, MI | 3.0 | 1.0 | 1234 | $1,400 | $1.13 | 16d | 1 | 1.31mi |
| 20296 Waltham St Detroit, MI | 3.0 | 1.5 | 986 | $1,300 | $1.32 | 17d | 1 | 1.33mi |
| 11377 Sherman Ave Warren, MI | 3.0 | 1.0 | 1200 | $1,400 | $1.17 | 24d | 1 | 1.34mi |
| 20027 Alcoy St Detroit, MI | 3.0 | 1.0 | 1000 | $1,349 | $1.35 | 17d | 1 | 1.44mi |
Listing history 22 events
-
2026-06-18days on market $77,500 Active 43 DOM
-
2026-06-17days on market $77,500 Active 42 DOM
-
2026-06-15days on market $77,500 Active 40 DOM
-
2026-06-13days on market $77,500 Active 38 DOM
-
2026-06-13days on market $77,500 Active 37 DOM
-
2026-06-09days on market $77,500 Active 34 DOM
-
2026-06-08days on market $77,500 Active 33 DOM
-
2026-06-07days on market $77,500 Active 32 DOM
-
2026-06-04days on market $77,500 Active 29 DOM
-
2026-06-03days on market $77,500 Active 28 DOM
-
2026-06-02days on market $77,500 Active 27 DOM
-
2026-06-01days on market $77,500 Active 26 DOM
-
2026-05-31days on market $77,500 Active 25 DOM
-
2026-05-06$77,500 Active 586-char remark
Show marketing remark (586 chars)
SPACIOUS BRICK BUNGALOW HOME LOCATED JUST SOUTH OF SEVEN MILE ROAD AND WEST OF HOOVER. THIS PROPERTY FEATURES A COVERED FRONT PORCH, 2 CAR DETACHED GARAGE, INVITING LIVING ROOM, DINING AREA, KITCHEN, TWO BEDROOMS AND BATH ON THE MAIN FLOOR, LARGE PRIMARY BEDROOM ON THE SECOND FLOOR, AND AN UNFINISHED BASEMENT. THIS WOULD BE A GREAT STARTER HOME OR ADDITION TO YOUR INVESTMENT PORTFOLIO! PROPERTY IS SOLD AS-IS. ALL DIMENSIONS ARE ESTIMATED AND SHOULD BE VERIFIED. ALL SHOWINGS REQUIRE A LICENSED AGENT TO BE PRESENT. BUYER TO PAY DETROIT INVESTMENT CO A 295 PROCESSING FEE AT CLOSING.
-
2025-08-08historical $1,275
-
2025-07-14historical
-
2025-07-14historical
-
2025-05-31$78,000 Active
-
2025-05-31$78,000 Active
-
2025-05-30$1,275
-
2020-05-06soldstatus $59,800
ⓘ Source: listings_history table (triggers on properties + properties_extension) + one-shot
backfill from property_details.listing_events for pre-trigger history.
Tax reassessment forecast MI · Partial reset (capped growth)
- Current annual tax
- $2,147 · $179/mo
- Projected year-2 tax
- $2,147 · $179/mo
- Expected delta
- $0/yr ($0/mo · 0.0%)
ⓘ Screening estimate from a state-policy table — verify with the county assessor before closing.
Climate risk First Street
- Flood 1/10 Low FEMA zone X (unshaded) · 0% chance over 30 yrs
- Wildfire 1/10 Low
- Heat 3/10 Moderate 7 d/yr ≥96°F today · 15 d/yr by 30 yrs out
- Wind 2/10 Low
- Air quality 3/10 Moderate 2 unhealthy d/yr today · 5 by 30 yrs out
Nearby sold comps map
Loading sold comps map…
Walkable amenities ~0.75 mi
Loading nearby amenities…
Taxation est. · year 1
- Rental income
- $16,149
- − Mortgage interest
- −$4,341
- − Property taxes
- −$2,147
- − Insurance
- −$388
- − Repairs & maintenance
- −$1,292
- − Management
- −$1,292
- − Depreciation
- −$2,255
- Taxable income
- $4,435
- Est. tax owed @ 24.0%
- −$1,064
- After-tax cash flow
- $4,282/yr
For passive investors: Depreciation is non-cash, so a rental often shows a tax loss while cash-flowing — sheltering income. Rental losses are passive: they offset passive income freely, and up to $25,000/yr can offset ordinary (W-2) income if you actively participate and your MAGI is under $100k (phasing out to $0 by $150k); unused losses carry forward. On sale, claimed depreciation is recaptured at up to 25%, and gains may owe capital-gains tax (a 1031 exchange can defer both). Figures are a year-1 estimate at your 24.0% rate — not tax advice; consult a CPA.
Schools (NCES district)
- District
- Detroit Public Schools Community District
- NCES district ID
- 2601103
- Math proficiency
- 10% ▼ -2.00%
- Reading proficiency
- 24% ▲ 6.00%
- Median HH income
- $25,815
- Composite
- 13.06/100
- National rank
- #9564
- State rank
- #499 of 540 in MI
Livability — Detroit
- Score
- 73/100
- State rank
- #218
- US rank
- #5427
Category grades
Schools grade is shown separately in the Schools card above.
Census & demographics
- Census place
- Detroit, MI
- County
- Wayne County · 1,562,939 people
- City population
- 572,865
- Metro
- Detroit-Warren-Dearborn, MI
- Population (ZIP)
- 32,760
- Household income
- $35,322
- Rent vs Own
- Severe rent burden
- 2372.0
Population outlook (Wayne County) Hauer SSP2
- Today (2025)
- 1,675,273 people
- By 2030
- 1,620,300 · -3.3%
- By 2040
- 1,502,341 · -10.3%
- By 2050
- 1,384,039 · -17.4%
- By 2075
- 1,124,592 · -32.9%
- By 2100
- 881,193 · -47.4%
Race, ethnicity, and origin ACS 2023
- Neighborhood character
- Predominantly Black (94%)
- Race & ethnicity
- Black 94% White 3% Two or more races 1%
- Common ancestry
- Romanian 1%
- Foreign-born
- 2% · Canada, Vietnam, Philippines
- Languages at home
- 97% English-only · French/Haitian/Cajun 1%
Political lean MEDSL · Wayne
- 2024 margin
- Strong D (+29.0) · D 62.7% · R 33.7% · Other 3.6%
- 2008→2024 swing
- -20.5pp toward R · 2008: 49.5pp · 2024: 29.0pp
- All cycles
- 2024: D+29.0 2020: D+38.1 2016: D+37.3 2012: D+46.9 2008: D+49.5
Not yet ingested
- Civics
- —
Market trends
- HPI YoY
- ▼ -44.65%
- Current HPI
- 328.8978
- Rent YoY
- ▲ 6.72%
- Metro
- Detroit-Warren-Dearborn, MI
- State GDP YoY
- ▲ 1.37%
- F500 in state
- 28
Industry mix (Fortune 500 HQ in MI)
| Industry | F500 HQs | Revenue |
|---|---|---|
| Automotive Parts | 3 | $48B |
|
||
| Automotive | 2 | $372B |
|
||
| Chemicals | 1 | $45B |
|
||
| Automotive Retail | 1 | $29B |
|
||
| Healthcare / Medical Devices | 1 | $23B |
|
||
| Automotive Technology | 1 | $20B |
|
||
Price history
+29.6% since first listed9 events — show timeline
- 2026-05-06 Listed $77,500 REALCOMP
- 2026-05-06 Listed $77,500 MiRealSource-MiMLS
- 2025-08-08 Rental Removed $1,275 APPFOLIO
- 2025-07-14 Listing Removed — MiRealSource-MiMLS
- 2025-07-14 Listing Removed — REALCOMP
- 2025-05-31 Listed $78,000 REALCOMP
- 2025-05-31 Listed $78,000 MiRealSource-MiMLS
- 2025-05-30 Listed for Rent $1,275 APPFOLIO
- 2020-05-06 Sold (Public Records) $59,800 Public Records
Property tax history
+3.5%/yrLatest (2025): $2,147 · -49.3% YoY. Source: county tax records.
Cash-flow waterfall
monthlySold comps — $/sqft
last 12 mo · ≤1 miLoading sold comps…