 Duplex
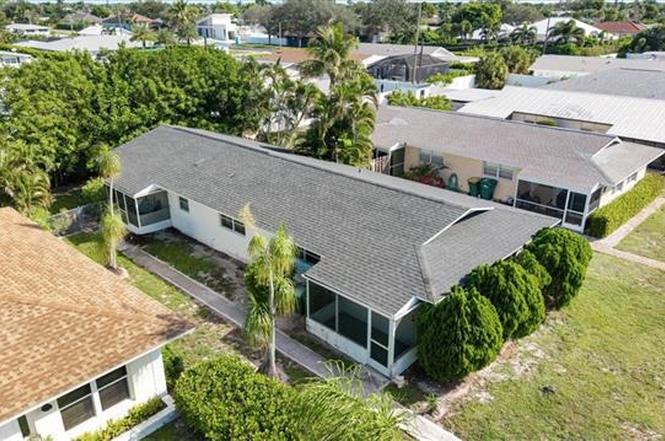
681/683 95th Ave N · Naples Park, FL
Flood risk 6/10 · Moderate
- FEMA flood zone
- X (shaded)
- Chance of flooding over 30 yrs
- 0.53%
- Est. flood insurance / yr
- $507 – $1,088
Fire risk 1/10 · Minimal
- Est. fire insurance / yr
- $947 – $1,759
Heat risk 10/10 · Severe
- Hot days now (above 107°F)
- 7 days/yr
- Hot days in 30 yrs
- 30 days/yr
Wind risk 10/10 · Severe
- Chance of severe wind over 30 yrs
- 99.0%
Air-quality risk 2/10 · Minimal
- Unhealthy air days now
- 1 days/yr
- Unhealthy air days in 30 yrs
- 1 days/yr
Risk factors via First Street. Map © Google.
Why this score? — see what drove the B- grade
The composite is a weighted blend of 9 inputs, each scored 0–100. Each bar is that input's sub-score; the figure is the points it added to the 100-point composite (weight × sub-score).
- Cash flow +27.8/30.0
- DSCR +9.8/10.0
- 1% rule +7.6/10.0
- ARV discount +7.5/15.0
- Schools +5.0/10.0
- Rent growth +4.7/5.0
- Livability +3.2/5.0
- Condition / age +2.5/5.0
- Appreciation +0.0/10.0
$725,000
🖨 Deal sheet 📄 Offer letter ✓ Due diligence
Multi-family units
County records classify this as Multi-Family (2-4 Unit). Listing-text estimate: 2 units. confirmed
Listing remarks
* * * Prestigious Naples Park Location with Endless Potential * * * An exceptional opportunity awaits in the highly coveted southern end of Naples Park—where luxury living meets unbeatable location. This rare duplex offers multiple possibilities: enjoy steady income with long-term tenants, remodel for dual short-term rentals, or build your dream coastal retreat among Naples Park’s most exquisite new luxury homes. The front residence has been newly updated and features one bedroom, one bath, an in-unit washer and dryer, and a bright, open living space ready for immediate occupancy. The rear residence, currently leased through May 2026, includes two bedrooms, one bath, a com
Key facts
- Non-hoa community
- Naples park location
- Duplex
Tags
Property features AI
Finance
- Other: Property consists of 2 units; Lot dimensions approximately 50 x 123 (regular lot); Lot area about 0.15 acres; Road access: County maintained, paved
- HOA & community: No homeowner amenities; Community type: See remarks
Exterior
- Utilities: Central water; Central sewer; Cable available
- Home design: Residential income property; Duplex; Built in 1968; Located in Naples Park; Zoned RMF-6
- Construction: Concrete block construction
- Exterior features: Fenced yard; Jalousie windows; Stucco exterior; Shingle roof
Interior
- Bedrooms: Duplex with 2 residential units
- Flooring: Tile
- Bathrooms: 2 full bathrooms (total for property)
- Heating & cooling: Central electric heating; Wall unit heating; Central electric cooling; Ceiling fans
- Interior features: Tile flooring
Neighborhood map
What this means for you Summary
Snapshot
- This is a 2 × 3-bed/2.0-bath units multifamily listed at $725k.
Deal economics
- At list price, monthly cash flow is $2k ($27k/yr) — positive. Per door: $1k/mo.
- The deal already cash-flows at list — no discount required.
- Meets the 1% rule at list price ($9k rent vs $725k).
- Recommended offer: $638k (12.0% below list) — sets the bar for market timing.
Location & tenants
- Location reads 64/100 on livability (#696 in FL) — a middle-class / working-renter tenant base. Strengths: crime A+, housing A-, employment B+; Watch: health & safety D, schools F, amenities F.
- Collier (suburban): math 60% / reading 56% proficiency, ranked #16 of 73 in FL (top 22%) — acceptable for families but not a draw, mixed tenant base, ~2y average lease.
- Market conditions: Rents rising fast (+8.7%/yr); 679 active listings in the ZIP; 1 comparable units currently listed for rent nearby; high-income renter base; 3,520 units permitted in Collier County in 2024 (959 in 5+ unit buildings).
- At $9,144/mo this rent would consume 92% of the median local household income ($119k/yr) (locally 237% of renters already pay >50% of income on rent) — very limited rent-growth headroom before tenants either downsize or default.
Forward outlook
- Local home prices are declining (-3.0%/yr); year-one equity from $5k of loan paydown is wiped out by about $22k of value loss. Plan a longer hold.
- Collier County population projected at +30% by 2050 — long-run rental-demand tailwind backs the buy-and-hold thesis.
- At projected returns (-3.0% appreciation + 8.0% rent growth), your $203k cash investment doubles in ~7 years — after that, you're playing with house money.
Negotiation context
- It's been on market 244 days — a 12% lower offer ($638k) is reasonable based on typical stale-listing flexibility.
Risks & watch-outs
- Climate carrying-cost: major flood risk; severe wind risk, 99% chance of damaging wind over 30y; extreme-heat days projected 7→30/yr by 2055 (HVAC capex compounding) — expect insurance premiums to compound above CPI over the hold.
Questions for the listing agent
- It's been on market 244 days. Have you received any prior offers? Is the seller open to a 12% concession, seller financing, or rate buy-down credit?
- Can we see the unit-by-unit rent roll, current vacancy, and any below-market leases? What's the average tenancy length?
- What capital expenditures (roof, boiler, parking lot, exteriors) have been made in the last 5 years, and what's planned in the next 2?
- Built in 1968 — when were the roof, HVAC, electrical panel, plumbing, and water heater last replaced?
- Why hasn't it sold? Are there any deal-killer items the seller is aware of (foundation, flood, title, zoning, code violations)?
- Is there a deadline driving the sale (1031 exchange, divorce, estate, relocation)? That informs how much negotiation room exists.
- Schools are F-rated, which usually means shorter tenancies and higher turnover. Who's the typical renter profile here, and what's been the actual vacancy rate?
- What's the average days-on-market for RENTAL listings here right now (not sales)? A rising rental-DOM trend means longer vacancies and softer asking-rent achievability than the comps imply.
- What's the recent tenant-quality profile in this submarket — average credit score on applications, eviction rate, late-payment / NSF rate, and stable-employment percentage? A property-management company in the area should have these aggregated.
- How much new apartment / multifamily construction is in the pipeline within 1–3 miles? Heavy new supply (>2% of stock underway) typically softens rents 12–24 months out; light construction supports rent growth.
Investment metrics
- 1% rule
- 1.26% ✓
- Cap rate
- 9.96%
- Cash-on-cash
- 13.08%
- DSCR
- 1.58
- GRM
- 6.6
CMA / ARV
No comps found within radius.
Projected returns pro-forma
-3.0% appreciation · 8.0% rent growth · sell at horizon
- IRR
- 8.5%
- Equity multiple
- 1.35×
- Total profit
- $71,956
- Equity at exit
- $108,100
- IRR
- 21.7%
- Equity multiple
- 3.29×
- Total profit
- $464,690
- Equity at exit
- $62,685
Cash invested: $203,000 (down + closing). Projections, not guarantees.
Landlord ↔ Tenant lean methodology
- Overall (STATE)
- 87 Strongly Landlord-Friendly
- State Florida
- 87 Strongly Landlord-Friendly · R+3
- County
- — inherits STATE
- City
- — inherits STATE
ZIP-level market 34108
- Rents YoY
- 8.7%
- Active inventory
- 679
- Price-to-rent
- 13.2×
Monthly cashflow live
- Estimated rent
- $9,144 high interval (Pro) →
- Mortgage (P&I)
- −$3,802
- Tax est. 1.5%
- −$906 /mo · $10,875/yr
- Insurance
- −$302
- HOA
- −$0
- Vacancy / Maint / Mgmt
- −$1,920
- Net cashflow
- $2,213
Break-even live
2-unit breakdown (identical units grouped — click to expand)
| Units | Beds | Baths | Est. rent |
|---|---|---|---|
| 2× units | 3 | 2 | $9,144 |
| #1 | 3 | 2 | $4,572 |
| #2 | 3 | 2 | $4,572 |
| Total (2 units) | $9,144 | ||
UW: 25.0% down · 7.5% · 30yr · 1.5% tax · 5.0% vac · 8.0% maint · 8.0% mgmt
Financing live
Cash to close
- Down payment
- $181,250
- Closing costs
- $21,750
- Reserves months
- —
- Total cash needed
- —
Loan-product check · same deal, 3 products live
Conventional
25% down · 7.5% · 30yr
- Down + closing
- —
- Monthly P&I
- —
- Monthly cashflow
- —
- DSCR
- —
- Eligible?
- —
Personal DTI + credit; lowest rate.
DSCR
20% down · 8.5% · 30yr
- Down + closing
- —
- Monthly P&I
- —
- Monthly cashflow
- —
- DSCR
- —
- Eligible?
- —
No personal income docs; deal must DSCR.
Hard money
10% down · 12.0% · 12mo
- Down + closing
- —
- Monthly P&I
- —
- Monthly cashflow
- —
- DSCR
- —
- Eligible?
- —
Short-term bridge; refi at stabilization.
Rent comps 1 comps
| Address | Beds | Baths | Sqft | Rent | $/sqft | DOM | Units | Dist |
|---|---|---|---|---|---|---|---|---|
| 734 109th Ave N Naples, FL | 5.0 | 3.0 | 2208 | $23,000 | $10.42 | 23d | 1 | 0.86mi |
Listing history 15 events
-
2026-06-18days on market $725,000 Active 244 DOM
-
2026-06-17days on market $725,000 Active 243 DOM
-
2026-06-16days on market $725,000 Active 242 DOM
-
2026-06-15days on market $725,000 Active 241 DOM
-
2026-06-10days on market $725,000 Active 236 DOM
-
2026-06-09days on market $725,000 Active 235 DOM
-
2026-06-08days on market $725,000 Active 234 DOM
-
2026-06-07days on market $725,000 Active 233 DOM
-
2026-06-03days on market $725,000 Active 229 DOM
-
2026-06-02days on market $725,000 Active 228 DOM
-
2026-06-01days on market $725,000 Active 227 DOM
-
2026-05-31days on market $725,000 Active 226 DOM
-
2026-05-30days on market $725,000 Active 225 DOM
-
2026-02-01price $725,000
-
2025-10-17$750,000 Active
ⓘ Source: listings_history table (triggers on properties + properties_extension) + one-shot
backfill from property_details.listing_events for pre-trigger history.
Climate risk First Street
- Flood 6/10 Major FEMA zone X (shaded) · 53% chance over 30 yrs
- Wildfire 1/10 Low
- Heat 10/10 Extreme 7 d/yr ≥107°F today · 30 d/yr by 30 yrs out
- Wind 10/10 Extreme 99% chance of damaging wind over 30 yrs
- Air quality 2/10 Low 1 unhealthy d/yr today · 1 by 30 yrs out
Nearby sold comps map
Loading sold comps map…
Walkable amenities ~0.75 mi
Loading nearby amenities…
Taxation est. · year 1
- Rental income
- $109,728
- − Mortgage interest
- −$40,611
- − Property taxes
- −$10,875
- − Insurance
- −$3,625
- − Repairs & maintenance
- −$8,778
- − Management
- −$8,778
- − Depreciation
- −$21,091
- Taxable income
- $15,969
- Est. tax owed @ 24.0%
- −$3,833
- After-tax cash flow
- $22,729/yr
For passive investors: Depreciation is non-cash, so a rental often shows a tax loss while cash-flowing — sheltering income. Rental losses are passive: they offset passive income freely, and up to $25,000/yr can offset ordinary (W-2) income if you actively participate and your MAGI is under $100k (phasing out to $0 by $150k); unused losses carry forward. On sale, claimed depreciation is recaptured at up to 25%, and gains may owe capital-gains tax (a 1031 exchange can defer both). Figures are a year-1 estimate at your 24.0% rate — not tax advice; consult a CPA.
Schools (NCES district)
- District
- Collier
- NCES district ID
- 1200330
- Math proficiency
- 60% ▼ -4.00%
- Reading proficiency
- 56% ▼ -2.00%
- Median HH income
- $58,275
- Composite
- 50.23/100
- National rank
- #1892
- State rank
- #16 of 73 in FL
Livability — Naples Park
- Score
- 64/100
- State rank
- #696
- US rank
- #14564
Category grades
Schools grade is shown separately in the Schools card above.
Census & demographics
- Census place
- Naples Park, FL
- County
- Collier County · 396,295 people
- Metro
- Naples-Marco Island, FL
- Population (ZIP)
- 16,237
- Household income
- $119,212
- Rent vs Own
- Severe rent burden
- 237.0
Population outlook (Collier County) Hauer SSP2
- Today (2025)
- 420,858 people
- By 2030
- 450,054 · +6.9%
- By 2040
- 502,232 · +19.3%
- By 2050
- 544,932 · +29.5%
- By 2075
- 627,203 · +49.0%
- By 2100
- 659,015 · +56.6%
Race, ethnicity, and origin ACS 2023
- Neighborhood character
- Predominantly White (87%)
- Race & ethnicity
- White 87% Hispanic / Latino 8% Two or more races 7% Asian 1% Black 1%
- Hispanic origin (detail)
- Mexican 2% Cuban 3%
- Common ancestry
- Romanian 5% Lithuanian 3% Slovak 3%
- Foreign-born
- 16% · Canada, Dominican Republic, South Korea
- Languages at home
- 86% English-only · Spanish 6% Russian/Polish/Slavic 2% Other Indo-European 2%
Political lean MEDSL · Collier
- 2024 margin
- Solid R (+33.1) · D 33.1% · R 66.2%
- 2008→2024 swing
- -10.6pp toward R · 2008: -22.5pp · 2024: -33.1pp
- All cycles
- 2024: R+33.1 2020: R+24.7 2016: R+26.0 2012: R+30.1 2008: R+22.5
Not yet ingested
- Civics
- —
Market trends
- HPI YoY
- ▼ -587.97%
- Current HPI
- 275.1872
- Rent YoY
- ▲ 8.74%
- Metro
- Naples-Marco Island, FL
- State GDP YoY
- ▲ 3.28%
- F500 in state
- 36
Industry mix (Fortune 500 HQ in FL)
| Industry | F500 HQs | Revenue |
|---|---|---|
| Industrial Technology | 2 | $29B |
|
||
| Insurance | 2 | $17B |
|
||
| Retail | 1 | $60B |
|
||
| Technology Distribution | 1 | $58B |
|
||
| Homebuilding | 1 | $35B |
|
||
| Technology Manufacturing | 1 | $35B |
|
||
Price history
-3.3% since first listed2 events — show timeline
- 2026-02-01 Price Changed $725,000 BEARMLS
- 2025-10-17 Listed $750,000 BEARMLS
Cash-flow waterfall
monthlySold comps — $/sqft
last 12 mo · ≤1 miLoading sold comps…