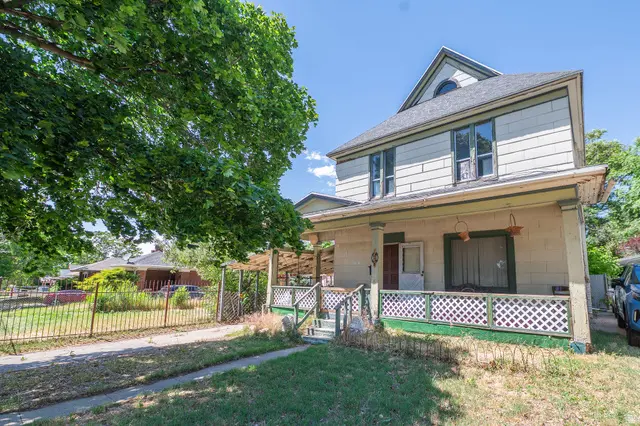
1256 24th St · Ogden, UT
Flood risk 4/10 · Minor
- FEMA flood zone
- X (unshaded)
- Chance of flooding over 30 yrs
- 0.2%
- Est. flood insurance / yr
- $507 – $1,088
Fire risk 6/10 · Moderate
- Est. fire insurance / yr
- $453 – $841
Heat risk 4/10 · Minor
- Hot days now (above 90°F)
- 8 days/yr
- Hot days in 30 yrs
- 21 days/yr
Wind risk 1/10 · Minimal
- Chance of severe wind over 30 yrs
- —
Air-quality risk 2/10 · Minimal
- Unhealthy air days now
- 2 days/yr
- Unhealthy air days in 30 yrs
- 2 days/yr
Risk factors via First Street. Map © Google.
Why this score? — see what drove the C- grade
The composite is a weighted blend of 9 inputs, each scored 0–100. Each bar is that input's sub-score; the figure is the points it added to the 100-point composite (weight × sub-score).
- Cash flow +22.5/30.0
- ARV discount +7.5/15.0
- DSCR +7.2/10.0
- 1% rule +5.5/10.0
- Livability +4.2/5.0
- Rent growth +3.1/5.0
- Condition / age +2.5/5.0
- Schools +2.4/10.0
- Appreciation +0.0/10.0
$200,000
🖨 Deal sheet 📄 Offer letter ✓ Due diligence
Listing remarks
Investor opportunity with incredible potential on the East Bench. One of the area's early homes, offering character, history, and the chance to restore or redevelop a unique property. Property is being sold strictly as-is. Power and water are currently off and will not be activated by Seller. The seller would like a cash buyer. Proof of funds required with all offers. Seller will accept offers through June 20, 2026, at 5:00 PM and reserves the right to review, negotiate, accept, reject, or counter any offer at Seller's sole discretion. Buyers submitting the highest and best offer with the quickest close will be picked. Send your highest and best offers by the deadline. Buyer to verify all i
Key facts
- 9,583 sq ft lot
- Parking
- Built 1892
Property features AI
Exterior
- Parking: Carport (covered) with 1 space; 1 total parking space
- Utilities: Natural gas connected; Electricity connected; Public sewer connected; Public water connected
- Home design: Two-story single family home; Property is built and standing; Above-grade finished area reported
- Construction: Built/standing construction
- Exterior features: Lot is about 0.22 acres
Interior
- Bedrooms: 1 bedroom on the main level
- Bathrooms: 1 full bathroom; 1 three-quarter bathroom
- Interior features: Partial basement; 8 total rooms; 2 fireplaces
Neighborhood map
What this means for you Summary
Snapshot
- This is a 4-bed/2.0-bath single-family listed at $200k.
Deal economics
- At list price, monthly cash flow is $336 ($4k/yr) — positive.
- The deal already cash-flows at list — no discount required.
- Meets the 1% rule at list price ($2k rent vs $200k).
Location & tenants
- Location reads 84/100 on livability (#19 in UT, #810 nationally) — a professional / high-income tenant draw. Strengths: amenities A+, commute A+, cost of living A+; Watch: crime F.
- Ogden City District (urban): math 25% / reading 31% proficiency, ranked #72 of 80 in UT (top 90%) — low school quality limits family demand, transient renter base, plan for 1-2y turnover; 75% free/reduced lunch — lower-income household profile, screen leases tightly.
- Zoned schools: Polk School (math 52% / reading 57%, grade C, #106 of 585 statewide, top 19%, 439 students, 20% FRL); Mount Ogden Junior High (math 33% / reading 38%, grade F, #94 of 138 statewide, top 68%, 858 students, 31% FRL); Ogden High (math 15% / reading 37%, grade F, #137 of 171 statewide, top 81%, 1,128 students, 35% FRL) — zoned schools average 29% FRL vs 75% district-wide (46 pts lower); this property's tenant base skews higher-income than the district average.
- Market conditions: Rents rising (+2.4%/yr); 461 active listings in the ZIP; 13 comparable units currently listed for rent nearby; rentals at typical pace (median 24d on market — plan ~3-4 weeks tenant-placement turnaround); solid renter incomes; 1,630 units permitted in Weber County in 2024 (521 in 5+ unit buildings).
- This rent runs 31% of the median local income ($81k/yr) — at the standard rent-burdened threshold; future hikes will face affordability resistance.
Forward outlook
- Local home prices are declining (-3.0%/yr); year-one equity from $1k of loan paydown is wiped out by about $6k of value loss. Plan a longer hold.
- Weber County population projected at +24% by 2050 — long-run rental-demand tailwind backs the buy-and-hold thesis.
Negotiation context
- Only 10 days on market — expect competitive offers; lowballing is unlikely to land.
Risks & watch-outs
- Watch-outs: built in 1892 — expect roof / HVAC / electrical / plumbing capex.
- Climate carrying-cost: major wildfire risk — expect insurance premiums to compound above CPI over the hold.
Questions for the listing agent
- Built in 1892 — when were the roof, HVAC, electrical panel, plumbing, and water heater last replaced?
- Is there a deadline driving the sale (1031 exchange, divorce, estate, relocation)? That informs how much negotiation room exists.
- Crime grade is F in this area — have there been break-ins, vandalism, or insurance claims at this property in the last 3 years? What carrier currently insures it and at what premium?
- What's the average days-on-market for RENTAL listings here right now (not sales)? A rising rental-DOM trend means longer vacancies and softer asking-rent achievability than the comps imply.
- What's the recent tenant-quality profile in this submarket — average credit score on applications, eviction rate, late-payment / NSF rate, and stable-employment percentage? A property-management company in the area should have these aggregated.
- How much new for-sale + rental construction is in the pipeline within 1–3 miles? Heavy new supply typically softens prices + rents 12–24 months out; constrained supply supports both.
Investment metrics
- 1% rule
- 1.05% ✓
- Cap rate
- 8.31%
- Cash-on-cash
- 7.21%
- DSCR
- 1.32
- GRM
- 7.9
CMA / ARV
No comps found within radius.
Projected returns pro-forma
-3.0% appreciation · 2.43% rent growth · sell at horizon
- IRR
- -5.9%
- Equity multiple
- 0.78×
- Total profit
- $-12,181
- Equity at exit
- $29,821
- IRR
- 3.1%
- Equity multiple
- 1.22×
- Total profit
- $12,110
- Equity at exit
- $17,292
Cash invested: $56,000 (down + closing). Projections, not guarantees.
Landlord ↔ Tenant lean methodology
- Overall (STATE)
- 86 Strongly Landlord-Friendly
- State Utah
- 86 Strongly Landlord-Friendly · R+15
- County
- — inherits STATE
- City
- — inherits STATE
ZIP-level market 84401
- Rents YoY
- 2.4%
- Active inventory
- 461
- Price-to-rent
- 7.9×
Monthly cashflow live
- Estimated rent
- $2,101 high interval (Pro) →
- Mortgage (P&I)
- −$1,049
- Tax from tax record
- −$191 /mo · $2,292/yr
- Insurance
- −$83
- HOA
- −$0
- Vacancy / Maint / Mgmt
- −$441
- Net cashflow
- $336
Break-even live
UW: 25.0% down · 7.5% · 30yr · 1.5% tax · 5.0% vac · 8.0% maint · 8.0% mgmt
Financing live
Cash to close
- Down payment
- $50,000
- Closing costs
- $6,000
- Reserves months
- —
- Total cash needed
- —
Loan-product check · same deal, 3 products live
Conventional
25% down · 7.5% · 30yr
- Down + closing
- —
- Monthly P&I
- —
- Monthly cashflow
- —
- DSCR
- —
- Eligible?
- —
Personal DTI + credit; lowest rate.
DSCR
20% down · 8.5% · 30yr
- Down + closing
- —
- Monthly P&I
- —
- Monthly cashflow
- —
- DSCR
- —
- Eligible?
- —
No personal income docs; deal must DSCR.
Hard money
10% down · 12.0% · 12mo
- Down + closing
- —
- Monthly P&I
- —
- Monthly cashflow
- —
- DSCR
- —
- Eligible?
- —
Short-term bridge; refi at stabilization.
Rent comps 13 comps
| Address | Beds | Baths | Sqft | Rent | $/sqft | DOM | Units | Dist |
|---|---|---|---|---|---|---|---|---|
| 2248 Polk Ave Ogden, UT | 4.0 | 2.0 | 1900 | $2,195 | $1.16 | 23d | 1 | 0.27mi |
| 1304 Kershaw St Ogden, UT | 3.0 | 2.0 | 1876 | $2,295 | $1.22 | 23d | 1 | 0.67mi |
| 2855 Fowler Ave Ogden, UT | 3.0 | 2.0 | 1316 | $2,150 | $1.63 | 21d | 1 | 0.86mi |
| 2660 Jefferson Ave Ogden, UT | 3.0 | 2.0 | 1738 | $2,150 | $1.24 | 14d | 1 | 1.05mi |
| 1679 Fowler Ave Ogden, UT | 3.0 | 1.0 | 1250 | $1,800 | $1.44 | 23d | 1 | 1.06mi |
| 1064 16th St Ogden, UT | 3.0 | 2.5 | 1440 | $1,750 | $1.22 | 23d | 1 | 1.11mi |
| 2925 Madison Ave Ogden, UT | 5.0 | 2.0 | 2160 | $2,200 | $1.02 | 14d | 1 | 1.17mi |
| 745 30th St Ogden, UT | 3.0 | 2.0 | 1200 | $1,545 | $1.29 | 23d | 1 | 1.20mi |
| 1419 Blossom Ln Ogden, UT | 3.0 | 2.5 | 1350 | $1,715 | $1.27 | 23d | 1 | 1.25mi |
| 1450 Canyon Rd Ogden, UT | 2.0–4.0 | 2.5 | 1624 | $2,544 | $1.57 | 19d | 2 | 1.25mi |
| 3221 S Van Buren Ave Unit B Ogden, UT | 4.0 | 2.0 | 1936 | $1,700 | $0.88 | 23d | 1 | 1.26mi |
| 1679 E 1425 S Ogden, UT | 3.0 | 2.5 | 1667 | $1,795 | $1.08 | 19d | 1 | 1.36mi |
| 1800 Canyon Rd Ogden, UT | 2.0–3.0 | 2.5 | 1396 | $2,494 | $1.79 | 14d | 24 | 1.37mi |
Listing history 9 events
-
2026-06-18days on market $200,000 Active 10 DOM
-
2026-06-17days on market $200,000 Active 9 DOM
-
2026-06-16days on market $200,000 Active 8 DOM
-
2026-06-15days on market $200,000 Active 7 DOM
-
2026-06-14days on market $200,000 Active 5 DOM
-
2026-06-13days on market $200,000 Active 4 DOM
-
2026-06-10days on market $200,000 Active 2 DOM
-
2026-06-09remarks 699-char remark
-
2026-06-09$200,000 Active 1 DOM
ⓘ Source: listings_history table (triggers on properties + properties_extension) + one-shot
backfill from property_details.listing_events for pre-trigger history.
Tax reassessment forecast UT · Resets to sale price
- Current annual tax
- $2,292 · $191/mo
- Projected year-2 tax
- $2,292 · $191/mo
- Expected delta
- $0/yr ($0/mo · 0.0%)
ⓘ Screening estimate from a state-policy table — verify with the county assessor before closing.
Climate risk First Street
- Flood 4/10 Moderate FEMA zone X (unshaded) · 20% chance over 30 yrs
- Wildfire 6/10 Major
- Heat 4/10 Moderate 8 d/yr ≥90°F today · 21 d/yr by 30 yrs out
- Wind 1/10 Low
- Air quality 2/10 Low 2 unhealthy d/yr today · 2 by 30 yrs out
Nearby sold comps map
Loading sold comps map…
Walkable amenities ~0.75 mi
Loading nearby amenities…
Taxation est. · year 1
- Rental income
- $25,210
- − Mortgage interest
- −$11,203
- − Property taxes
- −$2,292
- − Insurance
- −$1,000
- − Repairs & maintenance
- −$2,017
- − Management
- −$2,017
- − Depreciation
- −$5,818
- Taxable income
- $863
- Est. tax owed @ 24.0%
- −$207
- After-tax cash flow
- $3,831/yr
For passive investors: Depreciation is non-cash, so a rental often shows a tax loss while cash-flowing — sheltering income. Rental losses are passive: they offset passive income freely, and up to $25,000/yr can offset ordinary (W-2) income if you actively participate and your MAGI is under $100k (phasing out to $0 by $150k); unused losses carry forward. On sale, claimed depreciation is recaptured at up to 25%, and gains may owe capital-gains tax (a 1031 exchange can defer both). Figures are a year-1 estimate at your 24.0% rate — not tax advice; consult a CPA.
Schools (NCES district)
- District
- Ogden City District
- NCES district ID
- 4900720
- Math proficiency
- 25% ▼ -2.00%
- Reading proficiency
- 31% ▼ -5.00%
- Median HH income
- $41,974
- Composite
- 23.76/100
- National rank
- #7818
- State rank
- #72 of 80 in UT
Livability — Ogden
- Score
- 84/100
- State rank
- #19
- US rank
- #810
Category grades
Schools grade is shown separately in the Schools card above.
Census & demographics
- Census place
- Ogden, UT
- County
- Weber County · 260,557 people
- City population
- 152,611
- Metro
- Ogden-Clearfield, UT
- Population (ZIP)
- 48,303
- Household income
- $80,758
- Rent vs Own
- Severe rent burden
- 1027.0
Population outlook (Weber County) Hauer SSP2
- Today (2025)
- 274,329 people
- By 2030
- 288,577 · +5.2%
- By 2040
- 314,848 · +14.8%
- By 2050
- 338,710 · +23.5%
- By 2075
- 384,412 · +40.1%
- By 2100
- 409,305 · +49.2%
Race, ethnicity, and origin ACS 2023
- Neighborhood character
- Predominantly White (68%)
- Race & ethnicity
- White 68% Hispanic / Latino 25% Two or more races 8% Black 2% Asian 1%
- Hispanic origin (detail)
- Mexican 20% Puerto Rican 1%
- Common ancestry
- Slovak 4% Italian 4% Portuguese 2%
- Foreign-born
- 7% · Canada, China
- Languages at home
- 83% English-only · Spanish 15% Other Asian/Pacific 1%
Political lean MEDSL · Weber
- 2024 margin
- Strong R (+23.5) · D 36.8% · R 60.3% · Other 2.9%
- 2008→2024 swing
- +4.1pp toward D · 2008: -27.6pp · 2024: -23.5pp
- All cycles
- 2024: R+23.5 2020: R+22.7 2016: R+20.0 2012: R+46.0 2008: R+27.6
Not yet ingested
- Civics
- —
Market trends
- HPI YoY
- ▼ -265.29%
- Current HPI
- 302.8024
- Rent YoY
- ▲ 2.43%
- Metro
- Ogden-Clearfield, UT
- State GDP YoY
- ▲ 3.54%
- F500 in state
- 2
Industry mix (Fortune 500 HQ in UT)
| Industry | F500 HQs | Revenue |
|---|---|---|
| Financial Services | 1 | $3B |
|
||
Price history
1 event — show timeline
- 2026-06-08 Listed $200,000 WFRMLS
Property tax history
+5.4%/yrLatest (2025): $2,292 · +2.4% YoY. Source: county tax records.
Cash-flow waterfall
monthlySold comps — $/sqft
last 12 mo · ≤1 miLoading sold comps…