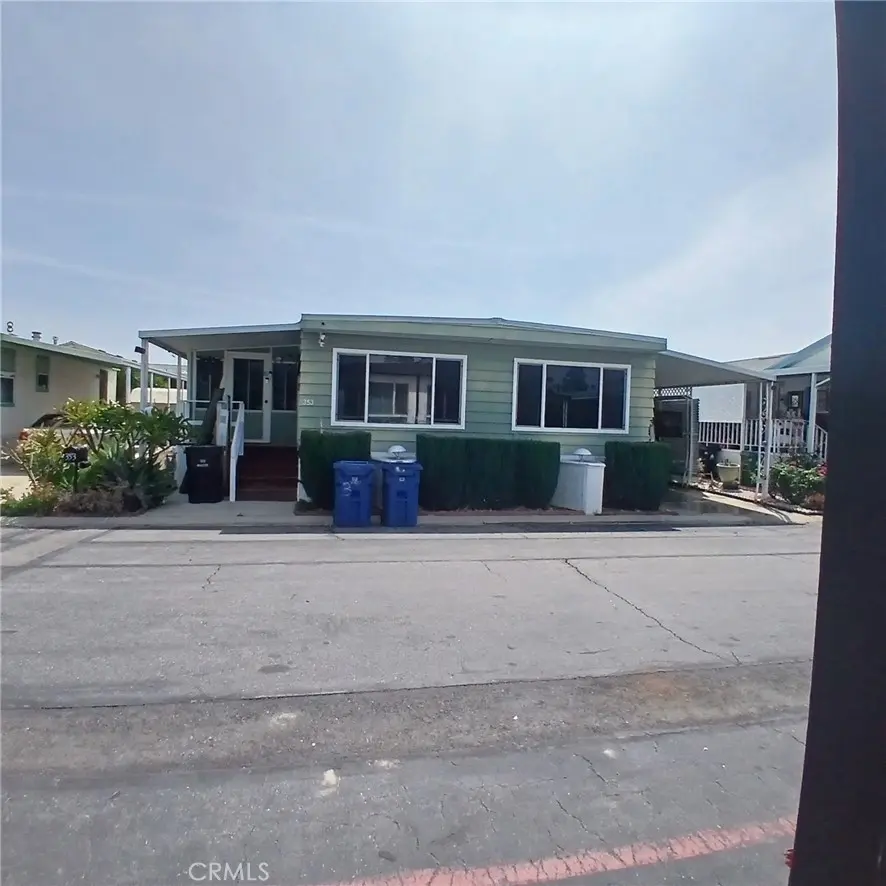
8811 CANOGA Ave #353 · Los Angeles, CA
Flood risk 4/10 · Minor
- FEMA flood zone
- X (unshaded)
- Chance of flooding over 30 yrs
- 0.22%
- Est. flood insurance / yr
- $507 – $1,088
Fire risk 5/10 · Moderate
- Est. fire insurance / yr
- $659 – $1,223
Heat risk 5/10 · Moderate
- Hot days now (above 103°F)
- 7 days/yr
- Hot days in 30 yrs
- 19 days/yr
Wind risk 1/10 · Minimal
- Chance of severe wind over 30 yrs
- —
Air-quality risk 4/10 · Minor
- Unhealthy air days now
- 5 days/yr
- Unhealthy air days in 30 yrs
- 7 days/yr
Risk factors via First Street. Map © Google.
Why this score? — see what drove the C+ grade
The composite is a weighted blend of 9 inputs, each scored 0–100. Each bar is that input's sub-score; the figure is the points it added to the 100-point composite (weight × sub-score).
- Cash flow +30.0/30.0
- DSCR +10.0/10.0
- 1% rule +8.7/10.0
- Condition / age +4.8/5.0
- Schools +3.6/10.0
- Livability +3.4/5.0
- Rent growth +1.7/5.0
- ARV discount +0.0/15.0
- Appreciation +0.0/10.0
$235,000
🖨 Deal sheet 📄 Offer letter ✓ Due diligence
Listing remarks
THIS HOME HAS EVERYTHING UNIMAGINABLE. It is so much better that when it came off the factory. It has been remodele throuthout, celiling, floorind, wall, doors, windows, kitchen, bathrooms, etc. It is too much to mention, but it has leased SOLAR PANELS, and a charging port for your EV car. This park is one of the best senior communities in the San Fernando Valley. Chatsworth is a great suburd full of many activities, shopping centers, restaurants, places of worship, hiking, horse riding, an many other sports. Come and see for your self the great opportunity to buy this unit, won't see it often.
Key facts
- Shopping centers
- Chatsworth
- Solar panels
Tags
Property features AI
Finance
- Financial info: Land lease of $920 per month (seller provided)
- HOA & community: Senior community; Park name: Canoga Estates MHP; Manager approval required; Pets allowed with breed restrictions; Community features: valley setting, curbs, horse trails, biking, hiking, BLM/National Forest nearby, urban access
Exterior
- Parking: Covered parking; Concrete driveway, paved and level; 2 carport/parking spaces
- Utilities: Owned solar photovoltaics (on-grid and stand-alone); 220V outlet (see remarks); Electricity connected/on property; Natural gas connected; Public/district water; Public sewer; Cable available
- Home design: Single-story mobile home; One total story; Entry on first floor; Updated/remodeled condition; Mobile home remains (24' x 57')
- Construction: Drywall walls; Composition roof; Common roof
- Exterior features: Covered, enclosed patio with cabana; Association gunite pool
Interior
- Kitchen: Remodeled kitchen with island; Granite counters; Self-closing drawers; Dishwasher; Microwave; Garbage disposal; 6-burner stove; Range/stove hood; Gas & electric range; Tankless water heater
- Bedrooms: All bedrooms on ground floor
- Flooring: Laminated flooring
- Bathrooms: Upgraded and remodeled fixtures; Walk-in shower; Shower in tub; Bathtub; Low-flow shower and toilets; Exhaust fan
- Heating & cooling: Central heating (natural gas, forced air, high-efficiency furnace); Central cooling (SEER 13-15, high-efficiency)
- Interior features: Built-in shelving/cabinetry; Recessed lighting; Open floor plan; Copper plumbing; Granite counters; Double-pane Energy Star windows
- Laundry & utility: Washer and dryer included; Inside laundry in closet; Gas and electric dryer hookup
Neighborhood map
What this means for you Summary
Snapshot
- This is a 3-bed/2.0-bath manufactured listed at $235k. Condition is rated excellent.
Deal economics
- At list price, monthly cash flow is $918 ($11k/yr) — positive.
- The deal already cash-flows at list — no discount required.
- Meets the 1% rule at list price ($3k rent vs $235k).
- Recommended offer: $228k (3.0% below list) — sets the bar for market timing.
- Cap rate 11.0% vs local median 2.1% in Los Angeles — top-decile yield for the area; either an underpriced asset or a hidden risk that comps aren't pricing in. Stress-test before assuming the spread holds.
Location & tenants
- Location reads 68/100 on livability (#273 in CA) — a middle-class / working-renter tenant base. Strengths: amenities A+, commute A+, employment B; Watch: health & safety C-, schools D+, crime F.
- Los Angeles Unified (urban): math 29% / reading 54% proficiency, ranked #223 of 517 in CA (top 43%) — families likely to look elsewhere, expect single-tenant / working-renter base with shorter leases; 67% free/reduced lunch — lower-income household profile, screen leases tightly.
- Market conditions: Rents falling (-3.2%/yr); 122 active listings in the ZIP; 40 comparable units currently listed for rent nearby; rentals at typical pace (median 25d on market — plan ~3-4 weeks tenant-placement turnaround); solid renter incomes; 19,697 units permitted in Los Angeles County in 2024 (9,426 in 5+ unit buildings).
- This rent runs 43% of the median local income ($90k/yr) — at the standard rent-burdened threshold; future hikes will face affordability resistance.
Forward outlook
- Local home prices are declining (-3.0%/yr); year-one equity from $2k of loan paydown is wiped out by about $7k of value loss. Plan a longer hold.
- Los Angeles County population projected at +9% by 2050 — modest demand growth; plan on rents tracking national, not racing it.
- At projected returns (-3.0% appreciation + 0.0% rent growth), your $66k cash investment doubles in ~10 years — after that, you're playing with house money.
Negotiation context
- It's been on market 48 days — a 3% lower offer ($228k) is reasonable based on typical stale-listing flexibility.
- 2 sale attempts with the ask held roughly flat each time — persistent listings suggest the price (not the market) is what's stuck; bring a comps-based counter.
Risks & watch-outs
- Climate carrying-cost: moderate wildfire risk; extreme-heat days projected 7→19/yr by 2055 (HVAC capex compounding) — expect insurance premiums to compound above CPI over the hold.
Questions for the listing agent
- It's been on market 48 days. Have you received any prior offers? Is the seller open to a 3% concession, seller financing, or rate buy-down credit?
- Built in 1970 — when were the roof, HVAC, electrical panel, plumbing, and water heater last replaced?
- Is there a deadline driving the sale (1031 exchange, divorce, estate, relocation)? That informs how much negotiation room exists.
- Schools are D-rated, which usually means shorter tenancies and higher turnover. Who's the typical renter profile here, and what's been the actual vacancy rate?
- Crime grade is F in this area — have there been break-ins, vandalism, or insurance claims at this property in the last 3 years? What carrier currently insures it and at what premium?
- What's the average days-on-market for RENTAL listings here right now (not sales)? A rising rental-DOM trend means longer vacancies and softer asking-rent achievability than the comps imply.
- What's the recent tenant-quality profile in this submarket — average credit score on applications, eviction rate, late-payment / NSF rate, and stable-employment percentage? A property-management company in the area should have these aggregated.
- How much new for-sale + rental construction is in the pipeline within 1–3 miles? Heavy new supply typically softens prices + rents 12–24 months out; constrained supply supports both.
Investment metrics
- 1% rule
- 1.37% ✓
- Cap rate
- 10.98%
- Cash-on-cash
- 16.75%
- DSCR
- 1.75
- GRM
- 6.1
CMA / ARV
- ARV (median comp)
- $193,500
- List price
- $235,000
- Delta
- 21.45%
- Verdict
- OVERPRICED
- Comps
- 17 within 1.0 mi
Show comp detail 12 sales within ~0.75 mi
| Address | Dist | Beds/Ba | Sqft | Sold | Price | $/sf | Match |
|---|---|---|---|---|---|---|---|
| 8811 Canoga Ave #383 | 0.01mi | 2/2.0 (-1) | 1,344 (-2%) | 2mo | $165,000 | $123 | 90 |
| 8811 Canoga Ave #371 | 0.01mi | 2/2.0 (-1) | 1,344 (-2%) | 6mo | $220,000 | $164 | 87 |
| 8811 Canoga Ave #208 | 0.01mi | 2/2.0 (-1) | 1,400 (+2%) | 8mo | $205,000 | $146 | 84 |
| 8811 Canoga Ave #106 | 0.01mi | 2/2.0 (-1) | 1,440 (+5%) | 9mo | $190,000 | $132 | 79 |
| 8801 Eton Ave #53 | 0.28mi | 2/2.0 (-1) | 1,440 (+5%) | 2mo | $193,500 | $134 | 72 |
| 8811 Canoga Ave #543 | 0.01mi | 3/2.0 | 1,568 (+15%) | 5mo | $180,000 | $115 | 71 |
| 8811 Canoga Ave #316 | 0.01mi | 2/2.0 (-1) | 1,200 (-12%) | 4mo | $165,000 | $138 | 71 |
| 8801 Eton #131 | 0.25mi | 2/2.0 (-1) | 1,300 (-5%) | 8mo | $223,000 | $172 | 68 |
| 8801 Eton Ave #123 | 0.25mi | 3/2.0 | 1,500 (+10%) | 7mo | $382,201 | $255 | 67 |
| 8901 Eton Ave #5 | 0.31mi | 2/2.0 (-1) | 1,440 (+5%) | 7mo | $190,125 | $132 | 66 |
| 8801 Eton #99 #99 | 0.28mi | 2/2.0 (-1) | 1,536 (+12%) | 0mo | $273,000 | $178 | 61 |
| 11401 Topanga #73 | 0.58mi | 3/2.0 | 1,265 (-8%) | 6mo | $229,000 | $181 | 55 |
Match score weights: distance 35% · size 25% · config 20% · recency 20%. Top-matched comps best support the ARV.
Projected returns pro-forma
-3.0% appreciation · 0.0% rent growth · sell at horizon
- IRR
- 4.5%
- Equity multiple
- 1.17×
- Total profit
- $11,035
- Equity at exit
- $35,039
- IRR
- 11.0%
- Equity multiple
- 1.74×
- Total profit
- $48,682
- Equity at exit
- $20,319
Cash invested: $65,800 (down + closing). Projections, not guarantees.
Landlord ↔ Tenant lean methodology
- Overall (CITY)
- 0 Strongly Tenant-Friendly
- State California
- 18 Strongly Tenant-Friendly · D+13
- County
- — inherits STATE
- City Los Angeles
- 0 Strongly Tenant-Friendly · D+22
ZIP-level market 91304
- Rents YoY
- -3.2%
- Active inventory
- 122
- Price-to-rent
- 6.1×
Monthly cashflow live
- Estimated rent
- $3,218 high interval (Pro) →
- Mortgage (P&I)
- −$1,232
- Tax est. 1.5%
- −$294 /mo · $3,525/yr
- Insurance
- −$98
- HOA
- −$0
- Vacancy / Maint / Mgmt
- −$676
- Net cashflow
- $918
Break-even live
UW: 25.0% down · 7.5% · 30yr · 1.5% tax · 5.0% vac · 8.0% maint · 8.0% mgmt
Financing live
Cash to close
- Down payment
- $58,750
- Closing costs
- $7,050
- Reserves months
- —
- Total cash needed
- —
Loan-product check · same deal, 3 products live
Conventional
25% down · 7.5% · 30yr
- Down + closing
- —
- Monthly P&I
- —
- Monthly cashflow
- —
- DSCR
- —
- Eligible?
- —
Personal DTI + credit; lowest rate.
DSCR
20% down · 8.5% · 30yr
- Down + closing
- —
- Monthly P&I
- —
- Monthly cashflow
- —
- DSCR
- —
- Eligible?
- —
No personal income docs; deal must DSCR.
Hard money
10% down · 12.0% · 12mo
- Down + closing
- —
- Monthly P&I
- —
- Monthly cashflow
- —
- DSCR
- —
- Eligible?
- —
Short-term bridge; refi at stabilization.
Rent comps 40 comps
| Address | Beds | Baths | Sqft | Rent | $/sqft | DOM | Units | Dist |
|---|---|---|---|---|---|---|---|---|
| 8750 Topanga Canyon Blvd Unit 6 Canoga Park, CA | 2.0 | 2.0 | 900 | $2,195 | $2.44 | 16d | 1 | 0.17mi |
| 8601 International Ave Canoga Park, CA | 2.0–3.0 | 2.0 | 980 | $2,950 | $3.01 | 24d | 2 | 0.27mi |
| 21350 Parthenia St Unit 108 Canoga Park, CA | 2.0 | 2.0 | 1000 | $2,495 | $2.50 | 16d | 1 | 0.29mi |
| 21731 Bryant St Canoga Park, CA | 3.0 | 2.0 | 1400 | $4,150 | $2.96 | 12d | 1 | 0.29mi |
| 8600 International Ave Canoga Park, CA | 4.0 | 2.0 | 1450 | $3,290 | $2.27 | 1d | 3 | 0.30mi |
| 8719 Variel Ave Canoga Park, CA | 1.0–3.0 | 1.0–2.0 | 948 | $3,176 | $3.35 | 7d | 3 | 0.43mi |
| 21040 Parthenia St #29 Canoga Park, CA | 2.0 | 2.5 | 1065 | $2,700 | $2.54 | 43d | 1 | 0.50mi |
| 21031 Parthenia St Canoga Park, CA | 1.0–2.0 | 1.0–2.0 | 905 | $2,584 | $2.86 | 2d | 9 | 0.50mi |
| 8865 Independence Ave #26 Canoga Park, CA | 3.0 | 2.5 | 1651 | $3,595 | $2.18 | 43d | 1 | 0.50mi |
| 9101 Topanga Canyon Blvd Chatsworth, CA | 2.0 | 2.0 | 1022 | $2,620 | $2.56 | 7d | 1 | 0.55mi |
| 8710 Independence Ave #301 Canoga Park, CA | 2.0 | 2.0 | 1134 | $2,250 | $1.98 | 24d | 1 | 0.57mi |
| 21000 Bryant St #6 Canoga Park, CA | 2.0 | 2.0 | 992 | $2,600 | $2.62 | 24d | 1 | 0.59mi |
| 8414 Owensmouth Ave Canoga Park, CA | 3.0 | 2.0 | 1341 | $3,995 | $2.98 | 24d | 1 | 0.59mi |
| 8761 De Soto Ave Canoga Park, CA | 1.0–3.0 | 1.5–2.5 | 1025 | $3,387 | $3.30 | 2d | 8 | 0.65mi |
| 20909 Parthenia St Canoga Park, CA | 1.0–2.0 | 1.0–1.5 | 745 | $2,438 | $3.27 | 1d | 6 | 0.66mi |
| 8409 Topanga Canyon Blvd West Hills, CA | 3.0 | 3.0 | 1144 | $5,000 | $4.37 | 43d | 1 | 0.70mi |
| 8700 De Soto Ave Canoga Park, CA | 1.0–2.0 | 1.0–2.0 | 775 | $2,695 | $3.48 | 1d | 2 | 0.70mi |
| 21019 Hackney St Canoga Park, CA | 3.0 | 2.0 | 1590 | $4,200 | $2.64 | 2d | 1 | 0.73mi |
| 21535 Roscoe Blvd Canoga Park, CA | 2.0–3.0 | 2.0 | 1309 | $3,791 | $2.90 | 1d | 3 | 0.73mi |
| 21501 Roscoe Blvd Canoga Park, CA | 2.0 | 2.0 | 1240 | $2,775 | $2.24 | 2d | 2 | 0.74mi |
| 20957 Community St Unit A Canoga Park, CA | 2.0 | 1.0 | 1002 | $3,200 | $3.19 | 24d | 1 | 0.81mi |
| 21809 Lanark St Canoga Park, CA | 2.0 | 1.5–2.0 | 900 | $1,920 | $2.13 | 20d | 2 | 0.91mi |
| 20512 Londelius St Winnetka, CA | 4.0 | 2.0 | 1500 | $4,300 | $2.87 | 43d | 1 | 1.14mi |
| 20645 Roscoe Blvd Unit E Winnetka, CA | 3.0 | 3.0 | 1586 | $4,800 | $3.03 | 43d | 1 | 1.18mi |
| 9733 Topanga Canyon Blvd Chatsworth, CA | 2.0–3.0 | 2.0 | 1204 | $3,995 | $3.32 | 2d | 4 | 1.19mi |
| 22337 Cantara St Canoga Park, CA | 3.0 | 2.0 | 1431 | $3,950 | $2.76 | 43d | 1 | 1.19mi |
| 20432 Gresham St Winnetka, CA | 3.0 | 2.0 | 1313 | $3,795 | $2.89 | 43d | 1 | 1.22mi |
| 7900 Topanga Canyon Blvd #15 Canoga Park, CA | 2.0 | 3.0 | 1558 | $3,550 | $2.28 | 2d | 1 | 1.24mi |
| 8605 Delco Ave Winnetka, CA | 3.0 | 3.0 | 1130 | $4,200 | $3.72 | 43d | 1 | 1.25mi |
| 8603 Delco Ave Winnetka, CA | 3.0 | 2.5 | 1130 | $3,500 | $3.10 | 43d | 1 | 1.25mi |
| 7948 De Soto Ave Canoga Park, CA | 3.0 | 3.0 | 1383 | $3,750 | $2.71 | 43d | 1 | 1.28mi |
| 7826 Topanga Canyon Blvd Canoga Park, CA | 2.0 | 2.0 | 920 | $2,675 | $2.91 | 24d | 2 | 1.28mi |
| 8015 McNulty Ave Winnetka, CA | 3.0 | 2.0 | 1447 | $4,250 | $2.94 | 2d | 1 | 1.32mi |
| 8220 Kentland Ave West Hills, CA | 3.0 | 2.0 | 1370 | $4,500 | $3.28 | 24d | 1 | 1.34mi |
| 8220 Kentland Ave West Hills, CA | 3.0 | 2.0 | 1370 | $4,500 | $3.28 | 43d | 1 | 1.34mi |
| 8208 Kentland Ave West Hills, CA | 4.0 | 2.0 | 1284 | $4,000 | $3.12 | 24d | 1 | 1.35mi |
| 21700 Septo St Chatsworth, CA | 2.0 | 2.0 | 1200 | $2,545 | $2.12 | 15d | 4 | 1.37mi |
| 21700 Septo St Unit D108 Chatsworth, CA | 2.0 | 2.0 | 1200 | $2,495 | $2.08 | 43d | 1 | 1.37mi |
| 21700 Septo St Unit D207 Chatsworth, CA | 2.0 | 2.0 | 1200 | $2,595 | $2.16 | 16d | 1 | 1.37mi |
| 7744 Vassar Ave Canoga Park, CA | 2.0 | 2.5 | 1142 | $3,750 | $3.28 | 24d | 1 | 1.38mi |
Listing history 17 events
-
2026-06-18days on market $235,000 Active 48 DOM
-
2026-06-17days on market $235,000 Active 47 DOM
-
2026-06-16days on market $235,000 Active 46 DOM
-
2026-06-15days on market $235,000 Active 45 DOM
-
2026-06-13days on market $235,000 Active 43 DOM
-
2026-06-09days on market $235,000 Active 39 DOM
-
2026-06-08days on market $235,000 Active 38 DOM
-
2026-06-07days on market $235,000 Active 37 DOM
-
2026-06-04days on market $235,000 Active 34 DOM
-
2026-06-03days on market $235,000 Active 33 DOM
-
2026-06-02days on market $235,000 Active 32 DOM
-
2026-06-01days on market $235,000 Active 31 DOM
-
2026-05-31days on market $235,000 Active 30 DOM
-
2026-05-01$235,000 Active 601-char remark
-
2026-04-22historical
-
2026-03-05price $235,000
-
2026-01-28$249,500 Active
ⓘ Source: listings_history table (triggers on properties + properties_extension) + one-shot
backfill from property_details.listing_events for pre-trigger history.
Climate risk First Street
- Flood 4/10 Moderate FEMA zone X (unshaded) · 22% chance over 30 yrs
- Wildfire 5/10 Major
- Heat 5/10 Major 7 d/yr ≥103°F today · 19 d/yr by 30 yrs out
- Wind 1/10 Low
- Air quality 4/10 Moderate 5 unhealthy d/yr today · 7 by 30 yrs out
Nearby sold comps map
Loading sold comps map…
Walkable amenities ~0.75 mi
Loading nearby amenities…
Taxation est. · year 1
- Rental income
- $38,620
- − Mortgage interest
- −$13,164
- − Property taxes
- −$3,525
- − Insurance
- −$1,175
- − Repairs & maintenance
- −$3,090
- − Management
- −$3,090
- − Depreciation
- −$6,836
- Taxable income
- $7,741
- Est. tax owed @ 24.0%
- −$1,858
- After-tax cash flow
- $9,164/yr
For passive investors: Depreciation is non-cash, so a rental often shows a tax loss while cash-flowing — sheltering income. Rental losses are passive: they offset passive income freely, and up to $25,000/yr can offset ordinary (W-2) income if you actively participate and your MAGI is under $100k (phasing out to $0 by $150k); unused losses carry forward. On sale, claimed depreciation is recaptured at up to 25%, and gains may owe capital-gains tax (a 1031 exchange can defer both). Figures are a year-1 estimate at your 24.0% rate — not tax advice; consult a CPA.
Condition & rehab AI · 3 photos
This manufactured home is in excellent condition with no visible repairs needed. It has been remodeled throughout, and the current listing highlights its features, including solar panels and an EV charging port. The location is in a desirable senior community with various amenities.
Value-add opportunities
- Both Landscaping improvements — Enhances curb appeal and adds value for both resale and rental.
- Both Painting exterior and interior — Fresh paint can make the home look newer and more appealing to potential buyers or renters.
Renovation cost estimate screening
Value-add ROI direction
- Both Landscaping improvements — Enhances curb appeal and adds value for both resale and rental. ↑
- Both Painting exterior and interior — Fresh paint can make the home look newer and more appealing to potential buyers or renters. ↑
ⓘ Cost ranges are severity-bucket heuristics (US national rule-of-thumb). Get contractor quotes + a written scope before underwriting a rehab budget.
Schools (NCES district)
- District
- Los Angeles Unified
- NCES district ID
- 0622710
- Math proficiency
- 29% ▼ -4.00%
- Reading proficiency
- 54% ▲ 10.00%
- Median HH income
- $50,403
- Composite
- 35.67/100
- National rank
- #4875
- State rank
- #223 of 517 in CA
Livability — Los Angeles
- Score
- 68/100
- State rank
- #273
- US rank
- #9237
Category grades
Schools grade is shown separately in the Schools card above.
Census & demographics
- Census place
- Los Angeles, CA
- County
- Los Angeles County · 9,444,647 people
- City population
- 3,838,149
- Metro
- Los Angeles-Long Beach-Anaheim, CA
- Population (ZIP)
- 52,474
- Household income
- $90,007
- Rent vs Own
- Severe rent burden
- 2821.0
Population outlook (Los Angeles County) Hauer SSP2
- Today (2025)
- 10,940,515 people
- By 2030
- 11,256,481 · +2.9%
- By 2040
- 11,729,929 · +7.2%
- By 2050
- 11,948,407 · +9.2%
- By 2075
- 11,818,114 · +8.0%
- By 2100
- 10,842,928 · -0.9%
Race, ethnicity, and origin ACS 2023
- Neighborhood character
- Diverse neighborhood (Simpson 0.69)
- Race & ethnicity
- Hispanic / Latino 42% White 32% Asian 17% Two or more races 11% Black 4%
- Hispanic origin (detail)
- Mexican 26%
- Common ancestry
- Scotch-Irish 2% Romanian 2% Slovak 1%
- Foreign-born
- 38% · Canada, Vietnam, China
- Languages at home
- 45% English-only · Spanish 34% Other Indo-European 8% Tagalog/Filipino 4%
Political lean MEDSL · Los Angeles
- 2024 margin
- Solid D (+32.9) · D 64.8% · R 31.9% · Other 3.3%
- 2008→2024 swing
- -7.4pp toward R · 2008: 40.4pp · 2024: 32.9pp
- All cycles
- 2024: D+32.9 2020: D+44.2 2016: D+48.0 2012: D+40.0 2008: D+40.4
Not yet ingested
- Civics
- —
Market trends
- HPI YoY
- ▼ -805.65%
- Current HPI
- 351.4216
- Rent YoY
- ▼ -3.21%
- Metro
- Los Angeles-Long Beach-Anaheim, CA
- State GDP YoY
- ▲ 3.21%
- F500 in state
- 116
Industry mix (Fortune 500 HQ in CA)
| Industry | F500 HQs | Revenue |
|---|---|---|
| Technology | 27 | $1,492B |
|
||
| Financial Services | 3 | $174B |
|
||
| Retail | 3 | $44B |
|
||
| Insurance | 3 | $26B |
|
||
| Media / Entertainment | 2 | $115B |
|
||
| Pharmaceuticals / Biotech | 2 | $62B |
|
||
Price history
-5.8% since first listed4 events — show timeline
- 2026-05-01 Listed $235,000 CRMLS
- 2026-04-22 Listing Removed — CRMLS
- 2026-03-05 Price Changed $235,000 CRMLS
- 2026-01-28 Listed $249,500 CRMLS
Cash-flow waterfall
monthlySold comps — $/sqft
last 12 mo · ≤1 miLoading sold comps…