None · Port St. Lucie, FL
Flood risk 1/10 · Minimal
- FEMA flood zone
- X (unshaded)
- Chance of flooding over 30 yrs
- 0.0%
- Est. flood insurance / yr
- $507 – $1,088
Fire risk 1/10 · Minimal
- Est. fire insurance / yr
- $947 – $1,759
Heat risk 10/10 · Severe
- Hot days now (above 106°F)
- 7 days/yr
- Hot days in 30 yrs
- 24 days/yr
Wind risk 10/10 · Severe
- Chance of severe wind over 30 yrs
- 99.0%
Air-quality risk 1/10 · Minimal
- Unhealthy air days now
- 0 days/yr
- Unhealthy air days in 30 yrs
- 0 days/yr
Risk factors via First Street. Map © Google.
Why this score? — see what drove the C+ grade
The composite is a weighted blend of 9 inputs, each scored 0–100. Each bar is that input's sub-score; the figure is the points it added to the 100-point composite (weight × sub-score).
- Cash flow +23.9/30.0
- ARV discount +15.0/15.0
- DSCR +7.7/10.0
- 1% rule +5.3/10.0
- Schools +3.7/10.0
- Rent growth +2.6/5.0
- Livability +2.5/5.0
- Condition / age +2.5/5.0
- Appreciation +0.0/10.0
$260,000
🖨 Deal sheet 📄 Offer letter ✓ Due diligence
Listing remarks
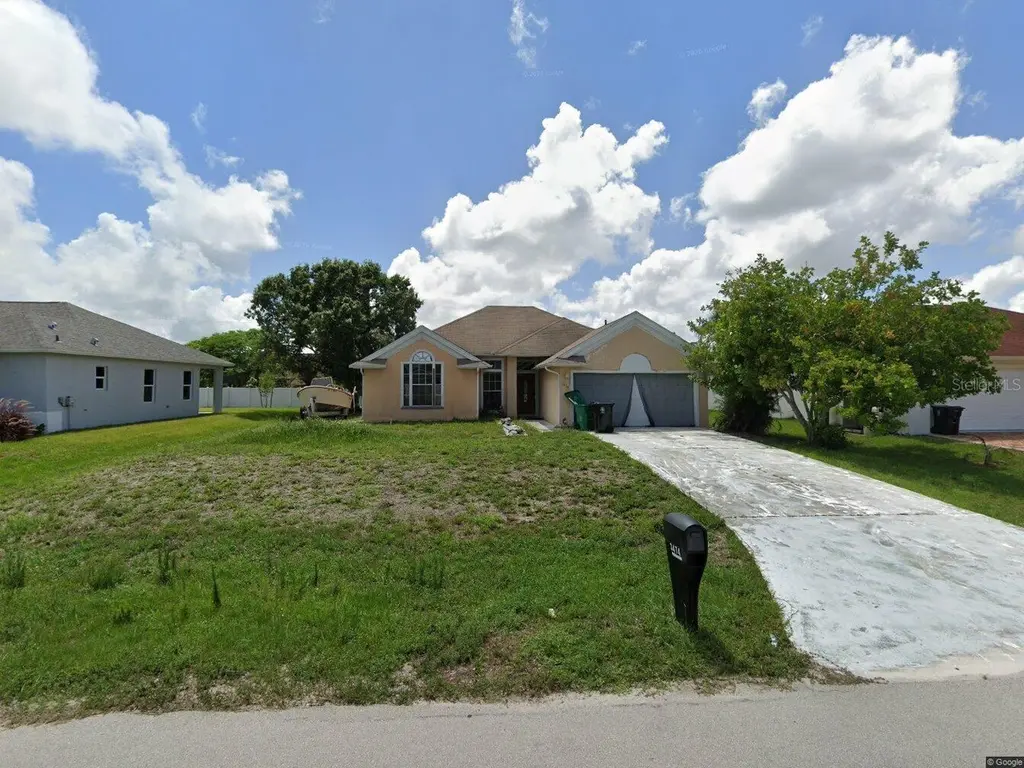
Beautifully updated 4BR/3BA home in a sought-after community! Features include an open-concept floor plan, quartz countertops, stainless steel appliances, and a spacious backyard perfect for entertaining. Conveniently located near shopping, dining, and major highways.
Key facts
- Quartz countertops
- Spacious backyard
- 0.23 acre lot
Tags
Property features AI
Finance
- Other: Property type: Residential, Single Family Residence; Zoning: RS-2
- HOA & community: Not in a development; No association indicated
Exterior
- Parking: Attached garage; 2-car garage
- Utilities: Public water; Public sewer; Electricity available; Cable available
- Home design: Single family residence; One story; East-facing
- Construction: Concrete construction; Shingle roof; Concrete perimeter foundation; Built on lot of about 0.2 acres
- Exterior features: Lighting; Sidewalk; Asphalt road frontage
Interior
- Kitchen: Range; Refrigerator
- Bedrooms: 3 bedrooms (one-level home)
- Flooring: Carpet
- Bathrooms: 2 full bathrooms
- Heating & cooling: Electric heating; Central air conditioning
- Interior features: Ceiling fans; Living room/dining room combo; Split bedroom floor plan; Thermostat
- Laundry & utility: Laundry room; Washer included
Neighborhood map
What this means for you Summary
Snapshot
- This is a 3-bed/2.0-bath single-family listed at $260k.
Deal economics
- At list price, monthly cash flow is $503 ($6k/yr) — positive.
- The deal already cash-flows at list — no discount required.
- Meets the 1% rule at list price ($3k rent vs $260k).
- Cap rate 8.6% vs local median 3.9% in Port St. Lucie — top-decile yield for the area; either an underpriced asset or a hidden risk that comps aren't pricing in. Stress-test before assuming the spread holds.
Location & tenants
- Location reads: area grade C — affects rentability + tenant quality, not the cash-flow math above.
- St. Lucie (urban): math 40% / reading 48% proficiency, ranked #51 of 73 in FL (top 70%) — families likely to look elsewhere, expect single-tenant / working-renter base with shorter leases.
- Market conditions: Rents flat; 758 active listings in the ZIP; 25 comparable units currently listed for rent nearby; rentals at typical pace (median 21d on market — plan ~3-4 weeks tenant-placement turnaround); solid renter incomes; 4,868 units permitted in St. Lucie County in 2024 (268 in 5+ unit buildings).
- This rent runs 38% of the median local income ($86k/yr) — at the standard rent-burdened threshold; future hikes will face affordability resistance.
Forward outlook
- Local home prices are declining (-3.0%/yr); year-one equity from $2k of loan paydown is wiped out by about $8k of value loss. Plan a longer hold.
- St. Lucie County population projected at +20% by 2050 — long-run rental-demand tailwind backs the buy-and-hold thesis.
Negotiation context
- Only 2 days on market — expect competitive offers; lowballing is unlikely to land.
- 7 sale attempts since 23y ago with the ask held roughly flat each time — persistent listings suggest the price (not the market) is what's stuck; bring a comps-based counter.
- Current owner paid $90k; list at $260k implies a 189% gain — meaningful room to come down on a strong offer.
Risks & watch-outs
- Climate carrying-cost: severe wind risk, 99% chance of damaging wind over 30y; extreme-heat days projected 7→24/yr by 2055 (HVAC capex compounding) — expect insurance premiums to compound above CPI over the hold.
Questions for the listing agent
- Is there a deadline driving the sale (1031 exchange, divorce, estate, relocation)? That informs how much negotiation room exists.
- What's the average days-on-market for RENTAL listings here right now (not sales)? A rising rental-DOM trend means longer vacancies and softer asking-rent achievability than the comps imply.
- What's the recent tenant-quality profile in this submarket — average credit score on applications, eviction rate, late-payment / NSF rate, and stable-employment percentage? A property-management company in the area should have these aggregated.
- How much new for-sale + rental construction is in the pipeline within 1–3 miles? Heavy new supply typically softens prices + rents 12–24 months out; constrained supply supports both.
Investment metrics
- 1% rule
- 1.03% ✓
- Cap rate
- 8.62%
- Cash-on-cash
- 8.30%
- DSCR
- 1.37
- GRM
- 8.1
CMA / ARV
- ARV (on-the-fly)
- $370,205
- Comps found
- 12
Show comp detail 12 sales within ~0.75 mi
| Address | Dist | Beds/Ba | Sqft | Sold | Price | $/sf | Match |
|---|---|---|---|---|---|---|---|
| 826 SW Trouville Ave | 0.25mi | 3/2.0 | 1,370 (-2%) | 16mo | $349,999 | $255 | 72 |
| 3616 SW Hale St | 0.34mi | 3/2.0 | 1,444 (+3%) | 12mo | $375,000 | $260 | 69 |
| 591 SW Halifax Ave | 0.28mi | 3/2.0 | 1,542 (+10%) | 12mo | $400,000 | $259 | 60 |
| 498 SW Prater Ave | 0.59mi | 3/2.0 | 1,463 (+5%) | 7mo | $429,900 | $294 | 59 |
| 749 SW Watson Pl | 0.70mi | 3/2.0 | 1,344 (-4%) | 4mo | $309,000 | $230 | 58 |
| 721 SW Mccullough Ave | 0.73mi | 3/2.0 | 1,257 (-10%) | 2mo | $315,000 | $251 | 48 |
| 691 SW Mccracken Ave | 0.47mi | 3/2.0 | 1,564 (+12%) | 18mo | $389,900 | $249 | 43 |
| 1008 SW Liberty Ave | 0.59mi | 3/2.0 | 1,247 (-11%) | 16mo | $350,000 | $281 | 41 |
| 902 SW Mccracken Ave | 0.64mi | 3/2.0 | 1,243 (-11%) | 16mo | $379,990 | $306 | 39 |
| 1022 SW Deauville Ave | 0.72mi | 4/2.0 (+1) | 1,270 (-9%) | 15mo | $393,900 | $310 | 34 |
| 1020 SW Firestone Ave | 0.67mi | 3/2.0 | 1,552 (+11%) | 21mo | $415,990 | $268 | 33 |
| 1074 SW Mataro Ave | 0.73mi | 3/2.0 | 1,552 (+11%) | 21mo | $411,990 | $265 | 30 |
Match score weights: distance 35% · size 25% · config 20% · recency 20%. Top-matched comps best support the ARV.
Projected returns pro-forma
-3.0% appreciation · 0.22% rent growth · sell at horizon
- IRR
- -6.6%
- Equity multiple
- 0.76×
- Total profit
- $-17,436
- Equity at exit
- $38,767
- IRR
- -0.6%
- Equity multiple
- 0.97×
- Total profit
- $-2,491
- Equity at exit
- $22,480
Cash invested: $72,800 (down + closing). Projections, not guarantees.
Landlord ↔ Tenant lean methodology
- Overall (STATE)
- 87 Strongly Landlord-Friendly
- State Florida
- 87 Strongly Landlord-Friendly · R+3
- County
- — inherits STATE
- City
- — inherits STATE
ZIP-level market 34953
- Home prices YoY
- -10.1%
- Rents YoY
- 0.2%
- Active inventory
- 758
- Price-to-rent
- 8.1×
Monthly cashflow live
- Estimated rent
- $2,678 high interval (Pro) →
- Mortgage (P&I)
- −$1,363
- Tax from tax record
- −$141 /mo · $1,686/yr
- Insurance
- −$108
- HOA
- −$0
- Vacancy / Maint / Mgmt
- −$562
- Net cashflow
- $503
Break-even live
UW: 25.0% down · 7.5% · 30yr · 1.5% tax · 5.0% vac · 8.0% maint · 8.0% mgmt
Financing live
Cash to close
- Down payment
- $65,000
- Closing costs
- $7,800
- Reserves months
- —
- Total cash needed
- —
Loan-product check · same deal, 3 products live
Conventional
25% down · 7.5% · 30yr
- Down + closing
- —
- Monthly P&I
- —
- Monthly cashflow
- —
- DSCR
- —
- Eligible?
- —
Personal DTI + credit; lowest rate.
DSCR
20% down · 8.5% · 30yr
- Down + closing
- —
- Monthly P&I
- —
- Monthly cashflow
- —
- DSCR
- —
- Eligible?
- —
No personal income docs; deal must DSCR.
Hard money
10% down · 12.0% · 12mo
- Down + closing
- —
- Monthly P&I
- —
- Monthly cashflow
- —
- DSCR
- —
- Eligible?
- —
Short-term bridge; refi at stabilization.
Rent comps 25 comps
| Address | Beds | Baths | Sqft | Rent | $/sqft | DOM | Units | Dist |
|---|---|---|---|---|---|---|---|---|
| 3542 SW Viceroy St Port Saint Lucie, FL | 4.0 | 2.0 | 1833 | $2,536 | $1.38 | 21d | 1 | 0.33mi |
| 3542 SW Viceroy St Port Saint Lucie, FL | 4.0 | 2.0 | 1833 | $2,380 | $1.30 | 14d | 1 | 0.33mi |
| 602 SW Jeanne St Port Saint Lucie, FL | 3.0 | 2.0 | 1061 | $2,100 | $1.98 | 23d | 1 | 0.46mi |
| 449 SW Fifer Ave Port Saint Lucie, FL | 3.0 | 2.0 | 1435 | $2,500 | $1.74 | 14d | 1 | 0.47mi |
| 273 SW Sterret Cir Port St. Lucie, FL | 2.0 | 1.0 | 933 | $1,775 | $1.90 | 23d | 1 | 0.53mi |
| 1025 SW Majorca Ave Port Saint Lucie, FL | 3.0 | 2.0 | 1480 | $3,300 | $2.23 | 23d | 1 | 0.61mi |
| 902 SW McCracken Ave Port St. Lucie, FL | 3.0 | 2.0 | 1245 | $2,800 | $2.25 | 23d | 1 | 0.64mi |
| 1037 SW Payne Ave Port Saint Lucie, FL | 4.0 | 2.0 | 1867 | $3,200 | $1.71 | 23d | 1 | 0.66mi |
| 426 SW Eastport Cir Port Saint Lucie, FL | 4.0 | 3.0 | 1512 | $2,810 | $1.86 | 14d | 1 | 0.71mi |
| 350 SW Belmont Cir Port Saint Lucie, FL | 3.0 | 2.0 | 1761 | $1,700 | $0.97 | 23d | 1 | 0.78mi |
| 3681 SW Haines St Port Saint Lucie, FL | 3.0 | 2.0 | 1542 | $2,300 | $1.49 | 21d | 1 | 0.80mi |
| 3681 SW Haines St Port Saint Lucie, FL | 3.0 | 2.0 | 1542 | $2,700 | $1.75 | 14d | 1 | 0.80mi |
| 353 SW Belmont Cir Port Saint Lucie, FL | 3.0 | 2.0 | 1176 | $2,095 | $1.78 | 23d | 1 | 0.82mi |
| 3912 SW McCrory St Port Saint Lucie, FL | 3.0 | 2.0 | 1159 | $2,350 | $2.03 | 23d | 1 | 0.84mi |
| 1021 SW Dubois Ave Port Saint Lucie, FL | 3.0 | 2.0 | 1331 | $2,400 | $1.80 | 23d | 1 | 0.93mi |
| 1217 SW Marmore Ave Port Saint Lucie, FL | 3.0 | 2.0 | 1580 | $3,700 | $2.34 | 23d | 1 | 0.96mi |
| 1298 SW Crost Ave Port Saint Lucie, FL | 4.0 | 2.0 | 1833 | $2,566 | $1.40 | 14d | 1 | 1.05mi |
| 952 SW Jasper Ave Port Saint Lucie, FL | 4.0 | 2.0 | 1833 | $2,216 | $1.21 | 21d | 1 | 1.23mi |
| 3226 SW Nutley St Port Saint Lucie, FL | 3.0 | 2.0 | 1552 | $2,900 | $1.87 | 23d | 1 | 1.24mi |
| 459 SW Laconic Ave Port Saint Lucie, FL | 3.0 | 2.0 | 1351 | $2,670 | $1.98 | 14d | 1 | 1.25mi |
| 311 SW Homeland Rd Port Saint Lucie, FL | 3.0 | 2.0 | 1395 | $2,200 | $1.58 | 14d | 1 | 1.26mi |
| 375 SW Tulip Blvd Port Saint Lucie, FL | 3.0 | 2.0 | 1365 | $2,100 | $1.54 | 14d | 1 | 1.35mi |
| 511 SW Nadell Ave Port Saint Lucie, FL | 4.0 | 2.0 | 1833 | $2,486 | $1.36 | 14d | 1 | 1.45mi |
| 3201 SW Collings Dr Port Saint Lucie, FL | 3.0 | 2.0 | 1389 | $2,616 | $1.88 | 14d | 1 | 1.45mi |
| 1454 SW Medina Ave Port Saint Lucie, FL | 3.0 | 2.0 | 1558 | $2,395 | $1.54 | 14d | 1 | 1.49mi |
Listing history 21 events
-
2026-05-05status Pending
-
2026-05-03$260,000 Active
-
2014-10-25historical
-
2013-09-21historical
-
2010-07-28soldstatus $90,000
-
2010-07-20soldstatus $90,000
-
2010-07-14historical
-
2010-03-26$96,870
-
2010-03-05$188,770
-
2010-03-05historical
-
2010-03-05$88,750
-
2010-01-14soldstatus $52,000
-
2009-11-30historical
-
2008-12-06$50,000
-
2006-04-28soldstatus $180,000
-
2006-04-13soldstatus $180,000
-
2006-03-13historical
-
2006-02-01$199,900
-
2004-03-08soldstatus $126,000
-
2003-09-08$144,900
-
2002-02-18soldstatus $82,500
ⓘ Source: listings_history table (triggers on properties + properties_extension) + one-shot
backfill from property_details.listing_events for pre-trigger history.
Tax reassessment forecast FL · Resets to sale price
- Current annual tax
- $1,686 · $141/mo
- Projected year-2 tax
- $2,158 · $180/mo
- Expected delta
- +$472/yr (+$39/mo · 28.0%)
ⓘ Screening estimate from a state-policy table — verify with the county assessor before closing.
Climate risk First Street
- Flood 1/10 Low FEMA zone X (unshaded) · 0% chance over 30 yrs
- Wildfire 1/10 Low
- Heat 10/10 Extreme 7 d/yr ≥106°F today · 24 d/yr by 30 yrs out
- Wind 10/10 Extreme 99% chance of damaging wind over 30 yrs
- Air quality 1/10 Low 0 unhealthy d/yr today · 0 by 30 yrs out
Nearby sold comps map
Loading sold comps map…
Walkable amenities ~0.75 mi
Loading nearby amenities…
Taxation est. · year 1
- Rental income
- $32,136
- − Mortgage interest
- −$14,564
- − Property taxes
- −$1,686
- − Insurance
- −$1,300
- − Repairs & maintenance
- −$2,571
- − Management
- −$2,571
- − Depreciation
- −$7,564
- Taxable income
- $1,881
- Est. tax owed @ 24.0%
- −$451
- After-tax cash flow
- $5,588/yr
For passive investors: Depreciation is non-cash, so a rental often shows a tax loss while cash-flowing — sheltering income. Rental losses are passive: they offset passive income freely, and up to $25,000/yr can offset ordinary (W-2) income if you actively participate and your MAGI is under $100k (phasing out to $0 by $150k); unused losses carry forward. On sale, claimed depreciation is recaptured at up to 25%, and gains may owe capital-gains tax (a 1031 exchange can defer both). Figures are a year-1 estimate at your 24.0% rate — not tax advice; consult a CPA.
Schools (NCES district)
- District
- St. Lucie
- NCES district ID
- 1201770
- Math proficiency
- 40% ▼ -11.00%
- Reading proficiency
- 48% ▼ -4.00%
- Median HH income
- $44,737
- Composite
- 37.28/100
- National rank
- #4449
- State rank
- #51 of 73 in FL
Livability — Port St. Lucie
No livability data for this city. (Only ~50 U.S. cities are tracked.)
Census & demographics
- Census place
- Port St. Lucie, FL
- County
- Saint Lucie County · 337,150 people
- City population
- 221,051
- Metro
- Port St. Lucie, FL
- Population (ZIP)
- 86,875
- Household income
- $85,667
- Rent vs Own
- Severe rent burden
- 857.0
Population outlook (St. Lucie County) Hauer SSP2
- Today (2025)
- 338,016 people
- By 2030
- 355,687 · +5.2%
- By 2040
- 385,521 · +14.1%
- By 2050
- 406,106 · +20.1%
- By 2075
- 441,054 · +30.5%
- By 2100
- 436,885 · +29.2%
Race, ethnicity, and origin ACS 2023
- Neighborhood character
- Diverse neighborhood (Simpson 0.69)
- Race & ethnicity
- White 42% Hispanic / Latino 28% Black 23% Two or more races 15% Asian 2%
- Hispanic origin (detail)
- Mexican 2% Puerto Rican 8% Cuban 4% Dominican 3%
- Common ancestry
- Hispanic 4% Romanian 2% Estonian 2%
- Foreign-born
- 24% · Canada, Jamaica, China
- Languages at home
- 69% English-only · Spanish 19% French/Haitian/Cajun 6% Other Indo-European 3%
Political lean MEDSL · St. Lucie
- 2024 margin
- Lean R (+9.1) · D 45.1% · R 54.2%
- 2008→2024 swing
- -21.2pp toward R · 2008: 12.1pp · 2024: -9.1pp
- All cycles
- 2024: R+9.1 2020: R+1.6 2016: R+2.5 2012: D+7.9 2008: D+12.1
Not yet ingested
- Civics
- —
Market trends
- HPI YoY
- ▼ -44.19%
- Current HPI
- 392.7681
- Rent YoY
- ▲ 0.22%
- Metro
- Port St. Lucie, FL
- State GDP YoY
- ▲ 3.28%
- F500 in state
- 36
Industry mix (Fortune 500 HQ in FL)
| Industry | F500 HQs | Revenue |
|---|---|---|
| Industrial Technology | 2 | $29B |
|
||
| Insurance | 2 | $17B |
|
||
| Retail | 1 | $60B |
|
||
| Technology Distribution | 1 | $58B |
|
||
| Homebuilding | 1 | $35B |
|
||
| Technology Manufacturing | 1 | $35B |
|
||
Price history
+215.2% since first listed21 events — show timeline
- 2026-05-05 Pending — Stellar MLS as Distributed by MLS Grid
- 2026-05-03 Listed $260,000 Stellar MLS as Distributed by MLS Grid
- 2014-10-25 Listing Removed — Beaches MLS
- 2013-09-21 Listing Removed — Beaches MLS
- 2010-07-28 Sold (Public Records) $90,000 Public Records
- 2010-07-20 Sold (MLS) $90,000 Beaches MLS
- 2010-07-14 Listing Removed — Beaches MLS
- 2010-03-26 Listed $96,870 Beaches MLS
- 2010-03-05 Listed $88,750 Beaches MLS
- 2010-03-05 Listing Removed — Beaches MLS
- 2010-03-05 Listed $188,770 Beaches MLS
- 2010-01-14 Sold (MLS) $52,000 Beaches MLS
- 2009-11-30 Listing Removed — Beaches MLS
- 2008-12-06 Listed $50,000 Beaches MLS
- 2006-04-28 Sold (Public Records) $180,000 Public Records
- 2006-04-13 Sold (MLS) $180,000 Beaches MLS
- 2006-03-13 Listing Removed — Beaches MLS
- 2006-02-01 Listed $199,900 Beaches MLS
- 2004-03-08 Sold (Public Records) $126,000 Public Records
- 2003-09-08 Listed $144,900 Beaches MLS
- 2002-02-18 Sold (Public Records) $82,500 Public Records
Property tax history
+1.7%/yrLatest (2025): $1,686 · +4.4% YoY. Source: county tax records.
Cash-flow waterfall
monthlySold comps — $/sqft
last 12 mo · ≤1 miLoading sold comps…