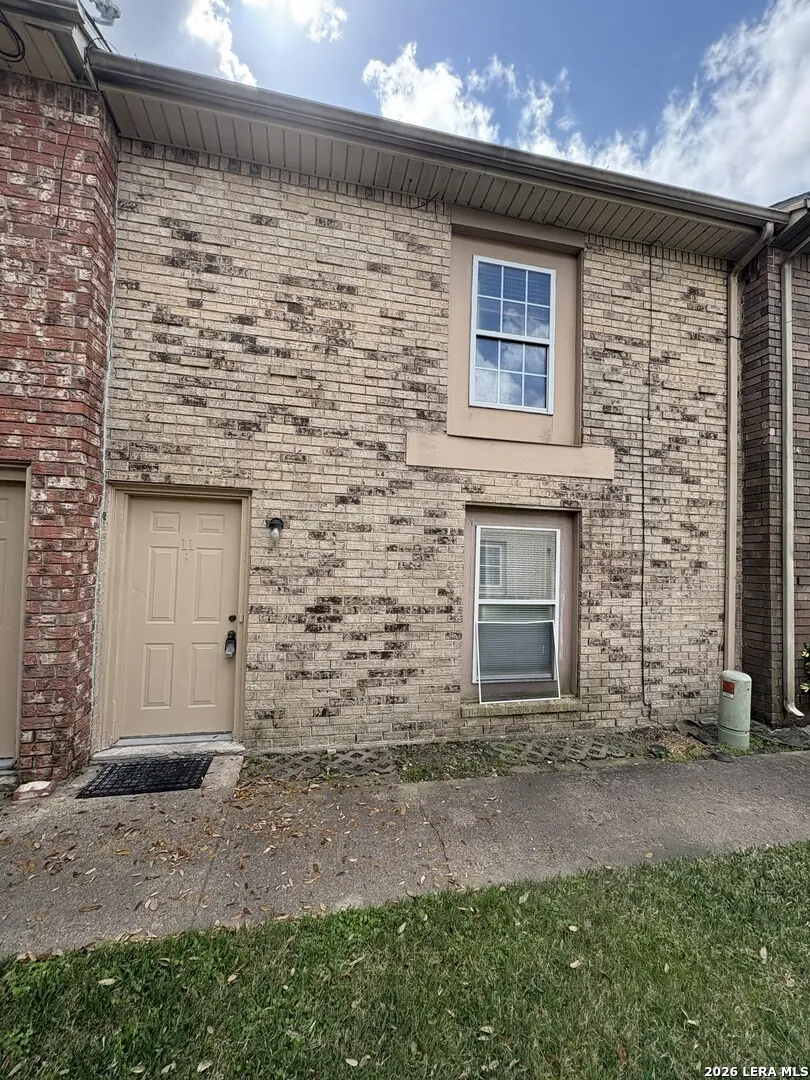
1403 Blalock #11 · Houston, TX
Flood risk 1/10 · Minimal
- FEMA flood zone
- X (unshaded)
- Chance of flooding over 30 yrs
- 0.0%
- Est. flood insurance / yr
- $507 – $1,088
Fire risk 1/10 · Minimal
- Est. fire insurance / yr
- $1,222 – $2,270
Heat risk 9/10 · Severe
- Hot days now (above 109°F)
- 7 days/yr
- Hot days in 30 yrs
- 24 days/yr
Wind risk 9/10 · Severe
- Chance of severe wind over 30 yrs
- 99.0%
Air-quality risk 3/10 · Minor
- Unhealthy air days now
- 3 days/yr
- Unhealthy air days in 30 yrs
- 3 days/yr
Risk factors via First Street. Map © Google.
Why this score? — see what drove the C grade
The composite is a weighted blend of 9 inputs, each scored 0–100. Each bar is that input's sub-score; the figure is the points it added to the 100-point composite (weight × sub-score).
- Cash flow +23.1/30.0
- ARV discount +7.5/15.0
- DSCR +7.4/10.0
- 1% rule +6.9/10.0
- Schools +4.1/10.0
- Livability +3.7/5.0
- Rent growth +2.9/5.0
- Condition / age +2.5/5.0
- Appreciation +0.0/10.0
$120,000
🖨 Deal sheet 📄 Offer letter ✓ Due diligence
Listing remarks MLS
This upstairs condo offers a great opportunity to personalize a space in a central Spring Branch location. The unit is livable but dated and will need some updates and repairs, making it a solid option for anyone looking to add their own touch. Features an open living area, a functional layout, and good natural light. The community provides a quiet, established setting with quick access to I10, Beltway 8, Memorial City, CityCentre, and everyday conveniences.
Key facts
- Open living area
- Quick access to i10
- Functional layout
Tags
Neighborhood map
What this means for you Summary
Snapshot
- This is a 2-bed/1.5-bath condo listed at $120k.
Deal economics
- At list price, monthly cash flow is $215 ($3k/yr) — positive.
- The deal already cash-flows at list — no discount required.
- Meets the 1% rule at list price ($1k rent vs $120k).
- Recommended offer: $113k (6.0% below list) — sets the bar for market timing.
- Cap rate 8.4% vs local median 3.2% in Houston — top-decile yield for the area; either an underpriced asset or a hidden risk that comps aren't pricing in. Stress-test before assuming the spread holds.
Location & tenants
- Location reads 74/100 on livability (#184 in TX, #4,771 nationally) — a middle-class / working-renter tenant base. Strengths: amenities A+, cost of living A+, housing A+; Watch: schools D, crime F.
- Spring Branch ISD (urban): math 47% / reading 46% proficiency, ranked #215 of 826 in TX (top 26%) — families likely to look elsewhere, expect single-tenant / working-renter base with shorter leases.
- Market conditions: Rents rising (+1.4%/yr); 441 active listings in the ZIP; 40 comparable units currently listed for rent nearby; rentals leasing fast (median 13d on market — plan ~1-2 weeks tenant-placement turnaround); 29,883 units permitted in Harris County in 2024 (8,621 in 5+ unit buildings).
Forward outlook
- Local home prices are declining (-3.0%/yr); year-one equity from $830 of loan paydown is wiped out by about $4k of value loss. Plan a longer hold.
- Harris County population projected at +47% by 2050 — long-run rental-demand tailwind backs the buy-and-hold thesis.
Negotiation context
- It's been on market 90 days — a 6% lower offer ($113k) is reasonable based on typical stale-listing flexibility.
- Current owner paid $14k; list at $120k implies a 789% gain — meaningful room to come down on a strong offer.
Risks & watch-outs
- Climate carrying-cost: severe wind risk, 99% chance of damaging wind over 30y; extreme-heat days projected 7→24/yr by 2055 (HVAC capex compounding) — expect insurance premiums to compound above CPI over the hold.
Questions for the listing agent
- It's been on market 90 days. Have you received any prior offers? Is the seller open to a 6% concession, seller financing, or rate buy-down credit?
- Built in 1967 — when were the roof, HVAC, electrical panel, plumbing, and water heater last replaced?
- Any open or pending special assessments — roof, HVAC, plumbing, elevator, façade? What's the per-unit balance and payoff schedule, and is the seller paying it off at close or rolling it to the buyer?
- Why hasn't it sold? Are there any deal-killer items the seller is aware of (foundation, flood, title, zoning, code violations)?
- Is there a deadline driving the sale (1031 exchange, divorce, estate, relocation)? That informs how much negotiation room exists.
- Schools are D-rated, which usually means shorter tenancies and higher turnover. Who's the typical renter profile here, and what's been the actual vacancy rate?
- Crime grade is F in this area — have there been break-ins, vandalism, or insurance claims at this property in the last 3 years? What carrier currently insures it and at what premium?
- What's the average days-on-market for RENTAL listings here right now (not sales)? A rising rental-DOM trend means longer vacancies and softer asking-rent achievability than the comps imply.
- What's the recent tenant-quality profile in this submarket — average credit score on applications, eviction rate, late-payment / NSF rate, and stable-employment percentage? A property-management company in the area should have these aggregated.
- How much new apartment / multifamily construction is in the pipeline within 1–3 miles? Heavy new supply (>2% of stock underway) typically softens rents 12–24 months out; light construction supports rent growth.
Investment metrics
- 1% rule
- 1.19% ✓
- Cap rate
- 8.44%
- Cash-on-cash
- 7.67%
- DSCR
- 1.34
- GRM
- 7.0
CMA / ARV
No comps found within radius.
Projected returns pro-forma
-3.0% appreciation · 1.41% rent growth · sell at horizon
- IRR
- -6.5%
- Equity multiple
- 0.76×
- Total profit
- $-7,935
- Equity at exit
- $17,892
- IRR
- 1.0%
- Equity multiple
- 1.06×
- Total profit
- $2,083
- Equity at exit
- $10,375
Cash invested: $33,600 (down + closing). Projections, not guarantees.
Landlord ↔ Tenant lean methodology
- Overall (STATE)
- 87 Strongly Landlord-Friendly
- State Texas
- 87 Strongly Landlord-Friendly · R+5
- County
- — inherits STATE
- City
- — inherits STATE
ZIP-level market 77055
- Rents YoY
- 1.4%
- Active inventory
- 441
- Price-to-rent
- 7.0×
Monthly cashflow live
- Estimated rent
- $1,424 high interval (Pro) →
- Mortgage (P&I)
- −$629
- Tax from tax record
- −$231 /mo · $2,771/yr
- Insurance
- −$50
- HOA
- −$0
- Vacancy / Maint / Mgmt
- −$299
- Net cashflow
- $215
Break-even live
UW: 25.0% down · 7.5% · 30yr · 1.5% tax · 5.0% vac · 8.0% maint · 8.0% mgmt
Financing live
Cash to close
- Down payment
- $30,000
- Closing costs
- $3,600
- Reserves months
- —
- Total cash needed
- —
Loan-product check · same deal, 3 products live
Conventional
25% down · 7.5% · 30yr
- Down + closing
- —
- Monthly P&I
- —
- Monthly cashflow
- —
- DSCR
- —
- Eligible?
- —
Personal DTI + credit; lowest rate.
DSCR
20% down · 8.5% · 30yr
- Down + closing
- —
- Monthly P&I
- —
- Monthly cashflow
- —
- DSCR
- —
- Eligible?
- —
No personal income docs; deal must DSCR.
Hard money
10% down · 12.0% · 12mo
- Down + closing
- —
- Monthly P&I
- —
- Monthly cashflow
- —
- DSCR
- —
- Eligible?
- —
Short-term bridge; refi at stabilization.
Rent comps 40 comps
| Address | Beds | Baths | Sqft | Rent | $/sqft | DOM | Units | Dist |
|---|---|---|---|---|---|---|---|---|
| 1403 Blalock Rd Houston, TX | 2.0 | 1.5–2.0 | 1276 | $1,525 | $1.20 | 43d | 4 | 0.02mi |
| 9550 Long Point Rd Houston, TX | 2.0–4.0 | 1.0–2.0 | 1130 | $775 | $0.69 | 2d | 10 | 0.21mi |
| 9300 Westview Dr Houston, TX | 2.0 | 2.0 | 1171 | $1,980 | $1.69 | 11d | 1 | 0.24mi |
| 1550 Blalock Rd Houston, TX | 1.0–2.0 | 1.0–1.5 | 965 | $1,414 | $1.47 | 2d | 47 | 0.33mi |
| 1477 Springrock Ln Unit SP99 Houston, TX | 2.0 | 2.5 | 1260 | $1,725 | $1.37 | 5d | 1 | 0.34mi |
| 1217 Blalock Rd Houston, TX | 3.0 | 1.0–2.0 | 818 | $986 | $1.20 | 5d | 15 | 0.35mi |
| 1620 Oak Tree Dr Houston, TX | 1.0–2.0 | 1.0–2.0 | 704 | $1,560 | $2.22 | 5d | 6 | 0.42mi |
| 1620 Oak Tree Dr Unit 1677 Houston, TX | 2.0 | 2.0 | 960 | $1,169 | $1.22 | 10d | 1 | 0.42mi |
| 1620 Oak Tree Dr Unit 2187 Houston, TX | 2.0 | 2.0 | 960 | $1,137 | $1.18 | 3d | 1 | 0.42mi |
| 1620 Oak Tree Dr Unit 2162 Houston, TX | 2.0 | 2.0 | 960 | $1,145 | $1.19 | 5d | 1 | 0.42mi |
| 1620 Oak Tree Dr Unit 1162 Houston, TX | 1.0 | 1.0 | 704 | $979 | $1.39 | 5d | 1 | 0.42mi |
| 1620 Oak Tree Dr Unit 1671 Houston, TX | 1.0 | 1.0 | 704 | $968 | $1.38 | 13d | 1 | 0.42mi |
| 1620 Oak Tree Dr Unit 1694 Houston, TX | 1.0 | 1.0 | 704 | $1,018 | $1.45 | 10d | 1 | 0.42mi |
| 1620 Oak Tree Dr Unit 1148 Houston, TX | 1.0 | 1.0 | 704 | $976 | $1.39 | 3d | 1 | 0.42mi |
| 1620 Oak Tree Dr Unit 1641 Houston, TX | 1.0 | 1.0 | 704 | $1,065 | $1.51 | 15d | 1 | 0.42mi |
| 1620 Oak Tree Dr Houston, TX | 1.0 | 1.0 | 704 | $1,169 | $1.66 | 43d | 1 | 0.42mi |
| 1620 Oak Tree Dr Houston, TX | 2.0 | 2.0 | 960 | $1,495 | $1.56 | 24d | 1 | 0.42mi |
| 1111 Blalock Rd Houston, TX | 1.0 | 1.0 | 733 | $1,034 | $1.41 | 13d | 1 | 0.47mi |
| 1111 Blalock Rd Houston, TX | 2.0 | 2.0 | 1070 | $1,378 | $1.29 | 43d | 1 | 0.47mi |
| 1111 Blalock Rd Unit 1168 Houston, TX | 2.0 | 2.0 | 1030 | $1,350 | $1.31 | 10d | 1 | 0.53mi |
| 1111 Blalock Rd Unit 2162 Houston, TX | 2.0 | 2.0 | 1030 | $1,326 | $1.29 | 5d | 1 | 0.53mi |
| 1111 Blalock Rd Unit 1132 Houston, TX | 1.0 | 1.0 | 733 | $1,084 | $1.48 | 10d | 1 | 0.53mi |
| 1111 Blalock Rd Unit 2148 Houston, TX | 2.0 | 2.0 | 1030 | $1,318 | $1.28 | 3d | 1 | 0.53mi |
| 1111 Blalock Rd Unit 1132 Houston, TX | 1.0 | 1.0 | 733 | $1,080 | $1.47 | 14d | 1 | 0.53mi |
| 1111 Blalock Rd Unit 1112 Houston, TX | 1.0 | 1.0 | 733 | $1,042 | $1.42 | 3d | 1 | 0.53mi |
| 9757 Pine Lake Dr Houston, TX | 1.0 | 1.0 | 718 | $1,029 | $1.43 | 43d | 1 | 0.67mi |
| 9763 Pine Lake Dr Houston, TX | 1.0 | 1.0 | 858 | $1,343 | $1.57 | 43d | 1 | 0.69mi |
| 1610 Campbell Rd Houston, TX | 1.0–2.0 | 1.0–2.0 | 882 | $2,364 | $2.68 | 3d | 49 | 0.69mi |
| 1716 Crestdale Dr Houston, TX | 2.0 | 1.0 | 950 | $1,650 | $1.74 | 43d | 1 | 0.73mi |
| 1760 Campbell Rd Houston, TX | 3.0 | 2.0 | 1354 | $1,675 | $1.24 | 43d | 1 | 0.75mi |
| 1720 Crestdale Dr Houston, TX | 1.0–2.0 | 1.0–2.0 | 832 | $1,390 | $1.67 | 2d | 12 | 0.75mi |
| 1726 Crestdale Dr Houston, TX | 2.0 | 2.0 | 960 | $1,500 | $1.56 | 43d | 1 | 0.78mi |
| 9005 Long Point Rd Unit 17 Houston, TX | 1.0 | 1.0 | 755 | $1,350 | $1.79 | 43d | 1 | 0.82mi |
| 976 Bunker Hill Rd Houston, TX | 2.0 | 2.0 | 996 | $1,605 | $1.61 | 19d | 1 | 0.90mi |
| 976 Bunker Hill Rd Houston, TX | 3.0 | 2.0 | 1380 | $1,990 | $1.44 | 20d | 1 | 0.90mi |
| 976 Bunker Hill Rd Houston, TX | 1.0 | 1.0 | 791 | $1,335 | $1.69 | 17d | 1 | 0.90mi |
| 976 Bunker Hill Rd Houston, TX | 3.0 | 2.0 | 1380 | $1,990 | $1.44 | 43d | 1 | 0.90mi |
| 976 Bunker Hill Rd Houston, TX | 1.0 | 1.0 | 791 | $1,335 | $1.69 | 22d | 1 | 0.90mi |
| 976 Bunker Hill Rd Houston, TX | 2.0 | 2.0 | 996 | $1,605 | $1.61 | 19d | 1 | 0.90mi |
| 9757 Katy Fwy Houston, TX | 1.0 | 1.0 | 978 | $2,031 | $2.08 | 43d | 1 | 0.96mi |
HOA detail condo
- Monthly dues
- $0 · $0/yr
- Assessments
- None detected in remarks — confirm with the listing agent.
Listing history 9 events
-
2026-06-04days on market $120,000 Active 90 DOM
-
2026-06-03days on market $120,000 Active 89 DOM
-
2026-06-02days on market $120,000 Active 88 DOM
-
2026-06-01days on market $120,000 Active 87 DOM
-
2026-05-31days on market $120,000 Active 86 DOM
-
2026-05-12price $120,000 462-char remark
Show marketing remark (462 chars)
This upstairs condo offers a great opportunity to personalize a space in a central Spring Branch location. The unit is livable but dated and will need some updates and repairs, making it a solid option for anyone looking to add their own touch. Features an open living area, a functional layout, and good natural light. The community provides a quiet, established setting with quick access to I10, Beltway 8, Memorial City, CityCentre, and everyday conveniences.
-
2026-04-14price $145,000 462-char remark
Show marketing remark (462 chars)
This upstairs condo offers a great opportunity to personalize a space in a central Spring Branch location. The unit is livable but dated and will need some updates and repairs, making it a solid option for anyone looking to add their own touch. Features an open living area, a functional layout, and good natural light. The community provides a quiet, established setting with quick access to I10, Beltway 8, Memorial City, CityCentre, and everyday conveniences.
-
2026-03-06$160,000 New 462-char remark
Show marketing remark (462 chars)
This upstairs condo offers a great opportunity to personalize a space in a central Spring Branch location. The unit is livable but dated and will need some updates and repairs, making it a solid option for anyone looking to add their own touch. Features an open living area, a functional layout, and good natural light. The community provides a quiet, established setting with quick access to I10, Beltway 8, Memorial City, CityCentre, and everyday conveniences.
-
1991-08-16soldstatus $13,500
ⓘ Source: listings_history table (triggers on properties + properties_extension) + one-shot
backfill from property_details.listing_events for pre-trigger history.
Tax reassessment forecast TX · Resets to sale price
- Current annual tax
- $2,771 · $231/mo
- Projected year-2 tax
- $2,771 · $231/mo
- Expected delta
- $0/yr ($0/mo · 0.0%)
ⓘ Screening estimate from a state-policy table — verify with the county assessor before closing.
Climate risk First Street
- Flood 1/10 Low FEMA zone X (unshaded) · 0% chance over 30 yrs
- Wildfire 1/10 Low
- Heat 9/10 Extreme 7 d/yr ≥109°F today · 24 d/yr by 30 yrs out
- Wind 9/10 Extreme 99% chance of damaging wind over 30 yrs
- Air quality 3/10 Moderate 3 unhealthy d/yr today · 3 by 30 yrs out
Nearby sold comps map
Loading sold comps map…
Walkable amenities ~0.75 mi
Loading nearby amenities…
Taxation est. · year 1
- Rental income
- $17,089
- − Mortgage interest
- −$6,722
- − Property taxes
- −$2,771
- − Insurance
- −$600
- − Repairs & maintenance
- −$1,367
- − Management
- −$1,367
- − Depreciation
- −$3,491
- Taxable income
- $771
- Est. tax owed @ 24.0%
- −$185
- After-tax cash flow
- $2,393/yr
For passive investors: Depreciation is non-cash, so a rental often shows a tax loss while cash-flowing — sheltering income. Rental losses are passive: they offset passive income freely, and up to $25,000/yr can offset ordinary (W-2) income if you actively participate and your MAGI is under $100k (phasing out to $0 by $150k); unused losses carry forward. On sale, claimed depreciation is recaptured at up to 25%, and gains may owe capital-gains tax (a 1031 exchange can defer both). Figures are a year-1 estimate at your 24.0% rate — not tax advice; consult a CPA.
Schools (NCES district)
- District
- Spring Branch ISD
- NCES district ID
- 4841100
- Math proficiency
- 47% ▼ -4.00%
- Reading proficiency
- 46% ▼ -1.00%
- Median HH income
- $60,311
- Composite
- 40.88/100
- National rank
- #3624
- State rank
- #215 of 826 in TX
Livability — Houston
- Score
- 74/100
- State rank
- #184
- US rank
- #4771
Category grades
Schools grade is shown separately in the Schools card above.
Census & demographics
- Census place
- Houston, TX
- County
- Harris County · 4,702,590 people
- City population
- 3,226,434
- Metro
- Houston-The Woodlands-Sugar Land, TX
- Population (ZIP)
- 45,435
- Household income
- $74,369
- Rent vs Own
- Severe rent burden
- 2571.0
Population outlook (Harris County) Hauer SSP2
- Today (2025)
- 5,571,493 people
- By 2030
- 6,089,821 · +9.3%
- By 2040
- 7,142,806 · +28.2%
- By 2050
- 8,185,864 · +46.9%
- By 2075
- 10,574,329 · +89.8%
- By 2100
- 12,109,958 · +117.4%
Race, ethnicity, and origin ACS 2023
- Neighborhood character
- Diverse neighborhood (Simpson 0.61)
- Race & ethnicity
- Hispanic / Latino 53% White 33% Two or more races 18% Asian 6% Black 5% Native American 2%
- Hispanic origin (detail)
- Mexican 32%
- Common ancestry
- Lithuanian 2% Italian 1% Serbian 1%
- Foreign-born
- 34% · Canada, China, Vietnam
- Languages at home
- 46% English-only · Spanish 45% Chinese 2% Arabic 2%
Political lean MEDSL · Harris
- 2024 margin
- Lean D (+5.5) · D 52.0% · R 46.4% · Other 1.6%
- 2008→2024 swing
- +3.9pp toward D · 2008: 1.6pp · 2024: 5.5pp
- All cycles
- 2024: D+5.5 2020: D+13.3 2016: D+12.4 2012: D+0.1 2008: D+1.6
Not yet ingested
- Civics
- —
Market trends
- HPI YoY
- ▼ -488.83%
- Current HPI
- 251.807
- Rent YoY
- ▲ 1.41%
- Metro
- Houston-The Woodlands-Sugar Land, TX
- State GDP YoY
- ▲ 3.95%
- F500 in state
- 110
Industry mix (Fortune 500 HQ in TX)
| Industry | F500 HQs | Revenue |
|---|---|---|
| Energy | 16 | $1,198B |
|
||
| Technology | 5 | $198B |
|
||
| Engineering / Construction | 4 | $72B |
|
||
| Energy Services | 3 | $60B |
|
||
| Utilities | 3 | $41B |
|
||
| Healthcare | 2 | $330B |
|
||
Price history
+788.9% since first listed4 events — show timeline
- 2026-05-12 Price Changed $120,000 LERA
- 2026-04-14 Price Changed $145,000 LERA
- 2026-03-06 Listed $160,000 LERA
- 1991-08-16 Sold (Public Records) $13,500 Public Records
Property tax history
+6.8%/yrLatest (2025): $2,771 · -1.4% YoY. Source: county tax records.
Cash-flow waterfall
monthlySold comps — $/sqft
last 12 mo · ≤1 miLoading sold comps…