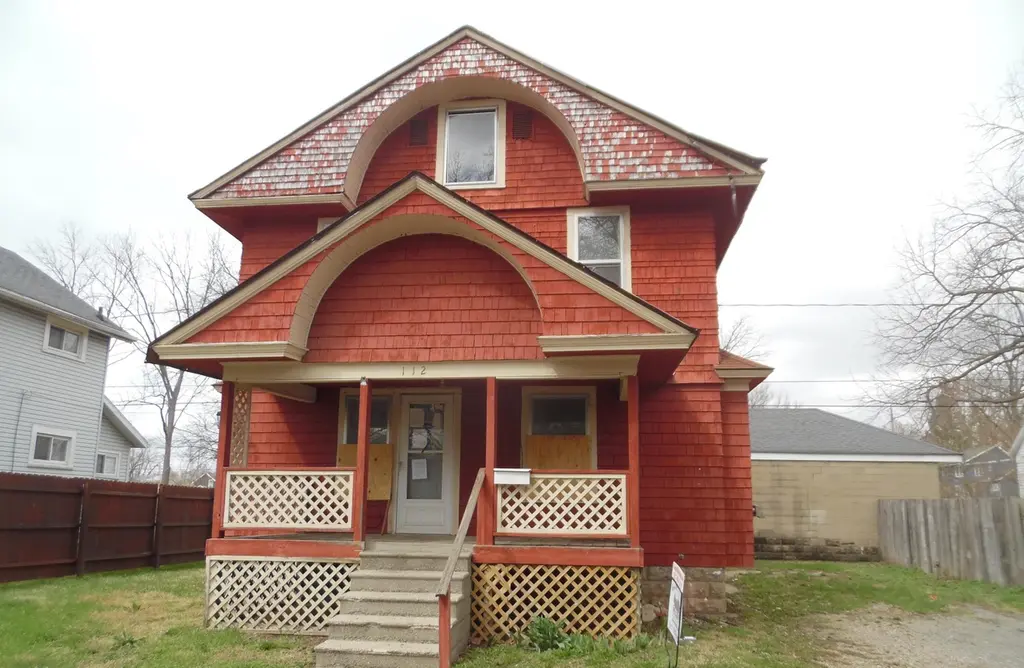
112 Lincoln Ct · Jackson, MI
Flood risk 1/10 · Minimal
- FEMA flood zone
- X (unshaded)
- Chance of flooding over 30 yrs
- 0.0%
- Est. flood insurance / yr
- $473 – $860
Fire risk 1/10 · Minimal
- Est. fire insurance / yr
- $784 – $1,456
Heat risk 2/10 · Minimal
- Hot days now (above 98°F)
- 7 days/yr
- Hot days in 30 yrs
- 14 days/yr
Wind risk 2/10 · Minimal
- Chance of severe wind over 30 yrs
- —
Air-quality risk 2/10 · Minimal
- Unhealthy air days now
- 1 days/yr
- Unhealthy air days in 30 yrs
- 1 days/yr
Risk factors via First Street. Map © Google.
Why this score? — see what drove the D grade
The composite is a weighted blend of 9 inputs, each scored 0–100. Each bar is that input's sub-score; the figure is the points it added to the 100-point composite (weight × sub-score).
- Cash flow +15.0/30.0
- ARV discount +7.5/15.0
- 1% rule +5.0/10.0
- DSCR +5.0/10.0
- Rent growth +4.4/5.0
- Livability +3.7/5.0
- Condition / age +2.5/5.0
- Schools +1.8/10.0
- Appreciation +0.0/10.0
$14,900
🖨 Deal sheet 📄 Offer letter ✓ Due diligence
Listing remarks MLS
Large house on small lot in a fair neighborhood is ready for your TLC to bring this home back to life. Would make a good starter home or investment property.
Key facts
- 3,049 sq ft lot
- Built 1918
- Listed 128 days
Neighborhood map
What this means for you Summary
Snapshot
- This is a 3-bed/1.0-bath single-family listed at $15k.
Deal economics
- At list price, monthly cash flow is $1k ($13k/yr) — positive.
- The deal already cash-flows at list — no discount required.
- Meets the 1% rule at list price ($2k rent vs $15k).
- Recommended offer: $13k (12.0% below list) — sets the bar for market timing.
- Cap rate 93.5% vs local median 5.4% in Jackson — top-decile yield for the area; either an underpriced asset or a hidden risk that comps aren't pricing in. Stress-test before assuming the spread holds.
Location & tenants
- Location reads 74/100 on livability (#197 in MI, #4,970 nationally) — a middle-class / working-renter tenant base. Strengths: cost of living A+, housing A+, health & safety A+; Watch: schools D, crime F, employment F.
- Jackson Public Schools (urban): math 15% / reading 28% proficiency, ranked #458 of 540 in MI (top 85%) — low school quality limits family demand, transient renter base, plan for 1-2y turnover; 63% free/reduced lunch — lower-income household profile, screen leases tightly.
- Market conditions: Rents rising fast (+7.5%/yr); 164 active listings in the ZIP; 317 units permitted in Jackson County in 2024 (103 in 5+ unit buildings).
- This rent runs 32% of the median local income ($56k/yr) — at the standard rent-burdened threshold; future hikes will face affordability resistance.
Forward outlook
- Local home prices are declining (-3.0%/yr); year-one equity from $103 of loan paydown is wiped out by about $447 of value loss. Plan a longer hold.
- Jackson County population projected at -13% by 2050 — secular population decline; favor cash flow + early exit over multi-decade hold.
- At projected returns (-3.0% appreciation + 7.5% rent growth), your $4k cash investment doubles in ~1 year — after that, you're playing with house money.
Negotiation context
- It's been on market 128 days — a 12% lower offer ($13k) is reasonable based on typical stale-listing flexibility.
- 5 sale attempts; this cycle's ask has dropped $15k (50%) from the opening price — seller is motivated, your offer sets the floor, not the list.
Risks & watch-outs
- Watch-outs: built in 1918 — expect roof / HVAC / electrical / plumbing capex.
Questions for the listing agent
- It's been on market 128 days. Have you received any prior offers? Is the seller open to a 12% concession, seller financing, or rate buy-down credit?
- Built in 1918 — when were the roof, HVAC, electrical panel, plumbing, and water heater last replaced?
- Why hasn't it sold? Are there any deal-killer items the seller is aware of (foundation, flood, title, zoning, code violations)?
- Is there a deadline driving the sale (1031 exchange, divorce, estate, relocation)? That informs how much negotiation room exists.
- Schools are D-rated, which usually means shorter tenancies and higher turnover. Who's the typical renter profile here, and what's been the actual vacancy rate?
- Crime grade is F in this area — have there been break-ins, vandalism, or insurance claims at this property in the last 3 years? What carrier currently insures it and at what premium?
- The area grade is low — what's the realistic commute time and amenity access for the typical tenant pool here? Any planned neighborhood developments (good or bad) we should know about?
- What's the average days-on-market for RENTAL listings here right now (not sales)? A rising rental-DOM trend means longer vacancies and softer asking-rent achievability than the comps imply.
- What's the recent tenant-quality profile in this submarket — average credit score on applications, eviction rate, late-payment / NSF rate, and stable-employment percentage? A property-management company in the area should have these aggregated.
- How much new for-sale + rental construction is in the pipeline within 1–3 miles? Heavy new supply typically softens prices + rents 12–24 months out; constrained supply supports both.
Investment metrics
- 1% rule
- 10.08% ✓
- Cap rate
- 93.52%
- Cash-on-cash
- 311.53%
- DSCR
- 14.86
- GRM
- 0.8
CMA / ARV
- ARV (median comp)
- $95,595
- List price
- $14,900
- Delta
- -84.41%
- Verdict
- UNDERPRICED
- Comps
- 20 within 1.0 mi
Show comp detail 12 sales within ~0.75 mi
| Address | Dist | Beds/Ba | Sqft | Sold | Price | $/sf | Match |
|---|---|---|---|---|---|---|---|
| 112 Lincoln Ct | 0.00mi | 3/1.0 | 1,077 (0%) | 1mo | $14,900 | $14 | 99 |
| 147 W Mansion St | 0.31mi | 3/1.0 | 1,070 (-1%) | 6mo | $116,900 | $109 | 80 |
| 141 E Euclid Ave | 0.31mi | 3/1.0 | 1,088 (+1%) | 7mo | $131,000 | $120 | 78 |
| 132 E Euclid Ave | 0.33mi | 3/1.5 | 1,104 (+2%) | 1mo | $150,000 | $136 | 77 |
| 1511 S Martin Luther King Jr Dr | 0.40mi | 3/1.0 | 1,134 (+5%) | 0mo | $87,000 | $77 | 72 |
| 308 E Addison St | 0.34mi | 3/1.0 | 1,170 (+9%) | 2mo | $65,000 | $56 | 68 |
| 2016 S Jackson St | 0.33mi | 3/1.5 | 998 (-7%) | 6mo | $172,000 | $172 | 65 |
| 127 Damon St | 0.49mi | 3/1.0 | 1,122 (+4%) | 7mo | $75,000 | $67 | 64 |
| 209 W High St | 0.65mi | 3/1.0 | 1,032 (-4%) | 1mo | $133,000 | $129 | 62 |
| 335 Prairie St | 0.46mi | 3/1.0 | 950 (-12%) | 4mo | $165,000 | $174 | 56 |
| 138 Pierce Ave | 0.44mi | 4/1.5 (+1) | 1,230 (+14%) | 1mo | $121,000 | $98 | 48 |
| 400 Colfax St | 0.65mi | 2/1.5 (-1) | 1,180 (+10%) | 4mo | $173,000 | $147 | 43 |
Match score weights: distance 35% · size 25% · config 20% · recency 20%. Top-matched comps best support the ARV.
Projected returns pro-forma
-3.0% appreciation · 7.54% rent growth · sell at horizon
- IRR
- —
- Equity multiple
- 18.68×
- Total profit
- $73,762
- Equity at exit
- $2,222
- IRR
- —
- Equity multiple
- 45.46×
- Total profit
- $185,475
- Equity at exit
- $1,288
Cash invested: $4,172 (down + closing). Projections, not guarantees.
Landlord ↔ Tenant lean methodology
- Overall (STATE)
- 62 Landlord-Friendly
- State Michigan
- 62 Landlord-Friendly · EVEN
- County
- — inherits STATE
- City
- — inherits STATE
ZIP-level market 49203
- Home prices YoY
- -31.7%
- Rents YoY
- 7.5%
- Active inventory
- 164
- Price-to-rent
- 0.8×
Monthly cashflow live
- Estimated rent
- $1,501 medium interval (Pro) →
- Mortgage (P&I)
- −$78
- Tax est. 1.5%
- −$19 /mo · $224/yr
- Insurance
- −$6
- HOA
- −$0
- Vacancy / Maint / Mgmt
- −$315
- Net cashflow
- $1,083
Break-even live
UW: 25.0% down · 7.5% · 30yr · 1.5% tax · 5.0% vac · 8.0% maint · 8.0% mgmt
Financing live
Cash to close
- Down payment
- $3,725
- Closing costs
- $447
- Reserves months
- —
- Total cash needed
- —
Loan-product check · same deal, 3 products live
Conventional
25% down · 7.5% · 30yr
- Down + closing
- —
- Monthly P&I
- —
- Monthly cashflow
- —
- DSCR
- —
- Eligible?
- —
Personal DTI + credit; lowest rate.
DSCR
20% down · 8.5% · 30yr
- Down + closing
- —
- Monthly P&I
- —
- Monthly cashflow
- —
- DSCR
- —
- Eligible?
- —
No personal income docs; deal must DSCR.
Hard money
10% down · 12.0% · 12mo
- Down + closing
- —
- Monthly P&I
- —
- Monthly cashflow
- —
- DSCR
- —
- Eligible?
- —
Short-term bridge; refi at stabilization.
Listing history 22 events
-
2026-05-08status Pending 157-char remark
Show marketing remark (157 chars)
Large house on small lot in a fair neighborhood is ready for your TLC to bring this home back to life. Would make a good starter home or investment property.
-
2026-05-08status Pending 157-char remark
Show marketing remark (157 chars)
Large house on small lot in a fair neighborhood is ready for your TLC to bring this home back to life. Would make a good starter home or investment property.
-
2026-05-08status Pending
Show marketing remark (157 chars)
Large house on small lot in a fair neighborhood is ready for your TLC to bring this home back to life. Would make a good starter home or investment property.
-
2026-04-30price $14,900 157-char remark
Show marketing remark (157 chars)
Large house on small lot in a fair neighborhood is ready for your TLC to bring this home back to life. Would make a good starter home or investment property.
-
2026-04-29price $14,900 157-char remark
Show marketing remark (157 chars)
Large house on small lot in a fair neighborhood is ready for your TLC to bring this home back to life. Would make a good starter home or investment property.
-
2026-04-29price $14,900
Show marketing remark (157 chars)
Large house on small lot in a fair neighborhood is ready for your TLC to bring this home back to life. Would make a good starter home or investment property.
-
2026-02-21price $19,900 157-char remark
Show marketing remark (157 chars)
Large house on small lot in a fair neighborhood is ready for your TLC to bring this home back to life. Would make a good starter home or investment property.
-
2026-02-20price $19,900 157-char remark
Show marketing remark (157 chars)
Large house on small lot in a fair neighborhood is ready for your TLC to bring this home back to life. Would make a good starter home or investment property.
-
2026-02-20price $19,900
Show marketing remark (157 chars)
Large house on small lot in a fair neighborhood is ready for your TLC to bring this home back to life. Would make a good starter home or investment property.
-
2025-12-30$29,900 Active 157-char remark
Show marketing remark (157 chars)
Large house on small lot in a fair neighborhood is ready for your TLC to bring this home back to life. Would make a good starter home or investment property.
-
2025-12-30$29,900 Active 157-char remark
Show marketing remark (157 chars)
Large house on small lot in a fair neighborhood is ready for your TLC to bring this home back to life. Would make a good starter home or investment property.
-
2025-12-30$29,900 Active
Show marketing remark (157 chars)
Large house on small lot in a fair neighborhood is ready for your TLC to bring this home back to life. Would make a good starter home or investment property.
-
2025-12-09historical
-
2025-12-09historical
-
2025-11-07price $34,300
-
2025-11-07price $34,300
-
2025-11-07price $34,300
-
2025-10-10price $36,100
-
2025-10-10price $36,100
-
2025-10-10price $36,100
-
2025-09-11$37,895 Active
-
2025-09-11$37,895 Active
ⓘ Source: listings_history table (triggers on properties + properties_extension) + one-shot
backfill from property_details.listing_events for pre-trigger history.
Climate risk First Street
- Flood 1/10 Low FEMA zone X (unshaded) · 0% chance over 30 yrs
- Wildfire 1/10 Low
- Heat 2/10 Low 7 d/yr ≥98°F today · 14 d/yr by 30 yrs out
- Wind 2/10 Low
- Air quality 2/10 Low 1 unhealthy d/yr today · 1 by 30 yrs out
Nearby sold comps map
Loading sold comps map…
Walkable amenities ~0.75 mi
Loading nearby amenities…
Taxation est. · year 1
- Rental income
- $18,016
- − Mortgage interest
- −$835
- − Property taxes
- −$224
- − Insurance
- −$74
- − Repairs & maintenance
- −$1,441
- − Management
- −$1,441
- − Depreciation
- −$433
- Taxable income
- $13,567
- Est. tax owed @ 24.0%
- −$3,256
- After-tax cash flow
- $9,741/yr
For passive investors: Depreciation is non-cash, so a rental often shows a tax loss while cash-flowing — sheltering income. Rental losses are passive: they offset passive income freely, and up to $25,000/yr can offset ordinary (W-2) income if you actively participate and your MAGI is under $100k (phasing out to $0 by $150k); unused losses carry forward. On sale, claimed depreciation is recaptured at up to 25%, and gains may owe capital-gains tax (a 1031 exchange can defer both). Figures are a year-1 estimate at your 24.0% rate — not tax advice; consult a CPA.
Schools (NCES district)
- District
- Jackson Public Schools
- NCES district ID
- 2619620
- Math proficiency
- 15% ▼ -6.00%
- Reading proficiency
- 28% ▼ -3.00%
- Median HH income
- $38,344
- Composite
- 17.99/100
- National rank
- #8986
- State rank
- #458 of 540 in MI
Livability — Jackson
- Score
- 74/100
- State rank
- #197
- US rank
- #4970
Category grades
Schools grade is shown separately in the Schools card above.
Census & demographics
- County
- Jackson County · 85,581 people
- City population
- 85,581
- Metro
- Jackson, MI
- Population (ZIP)
- 36,474
- Household income
- $56,201
- Rent vs Own
- Severe rent burden
- 1383.0
Population outlook (Jackson County) Hauer SSP2
- Today (2025)
- 156,365 people
- By 2030
- 153,123 · -2.1%
- By 2040
- 144,981 · -7.3%
- By 2050
- 135,671 · -13.2%
- By 2075
- 113,833 · -27.2%
- By 2100
- 86,592 · -44.6%
Race, ethnicity, and origin ACS 2023
- Neighborhood character
- Predominantly White (73%)
- Race & ethnicity
- White 73% Black 15% Two or more races 9% Hispanic / Latino 5%
- Common ancestry
- Romanian 6% Lithuanian 3% Slovak 2%
- Foreign-born
- 2% · Canada
- Languages at home
- 97% English-only · Spanish 1% Other Indo-European 1%
Political lean MEDSL · Jackson
- 2024 margin
- Strong R (+21.3) · D 38.6% · R 59.9% · Other 1.5%
- 2008→2024 swing
- -23.7pp toward R · 2008: 2.4pp · 2024: -21.3pp
- All cycles
- 2024: R+21.3 2020: R+19.0 2016: R+20.1 2012: R+5.8 2008: D+2.4
Not yet ingested
- Civics
- —
Market trends
- HPI YoY
- ▼ -98.09%
- Current HPI
- 211.5474
- Rent YoY
- ▲ 7.54%
- Metro
- Jackson, MI
- State GDP YoY
- ▲ 1.37%
- F500 in state
- 28
Industry mix (Fortune 500 HQ in MI)
| Industry | F500 HQs | Revenue |
|---|---|---|
| Automotive Parts | 3 | $48B |
|
||
| Automotive | 2 | $372B |
|
||
| Chemicals | 1 | $45B |
|
||
| Automotive Retail | 1 | $29B |
|
||
| Healthcare / Medical Devices | 1 | $23B |
|
||
| Automotive Technology | 1 | $20B |
|
||
Price history
-60.7% since first listed22 events — show timeline
- 2026-05-08 Pending — MiRealSource-MiMLS
- 2026-05-08 Pending — REALCOMP
- 2026-05-08 Pending — SW Michigan MLS
- 2026-04-30 Price Changed $14,900 MiRealSource-MiMLS
- 2026-04-29 Price Changed $14,900 REALCOMP
- 2026-04-29 Price Changed $14,900 SW Michigan MLS
- 2026-02-21 Price Changed $19,900 MiRealSource-MiMLS
- 2026-02-20 Price Changed $19,900 REALCOMP
- 2026-02-20 Price Changed $19,900 SW Michigan MLS
- 2025-12-30 Listed $29,900 SW Michigan MLS
- 2025-12-30 Listed $29,900 REALCOMP
- 2025-12-30 Listed $29,900 MiRealSource-MiMLS
- 2025-12-09 Listing Removed — REALCOMP
- 2025-12-09 Listing Removed — MiRealSource-MiMLS
- 2025-11-07 Price Changed $34,300 MiRealSource-MiMLS
- 2025-11-07 Price Changed $34,300 REALCOMP
- 2025-11-07 Price Changed $34,300 SW Michigan MLS
- 2025-10-10 Price Changed $36,100 MiRealSource-MiMLS
- 2025-10-10 Price Changed $36,100 REALCOMP
- 2025-10-10 Price Changed $36,100 SW Michigan MLS
- 2025-09-11 Listed $37,895 REALCOMP
- 2025-09-11 Listed $37,895 MiRealSource-MiMLS
Property tax history
+4.4%/yrLatest (2025): $1,054 · -32.5% YoY. Source: county tax records.
Cash-flow waterfall
monthlySold comps — $/sqft
last 12 mo · ≤1 miLoading sold comps…