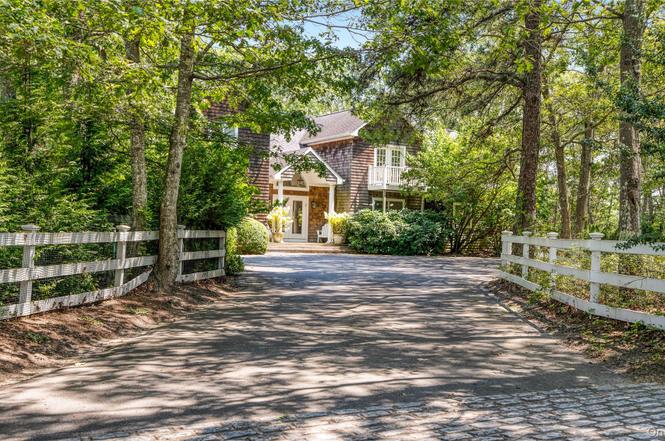
9 Rosebud Ln · Quogue, NY
Flood risk 1/10 · Minimal
- FEMA flood zone
- X (unshaded)
- Chance of flooding over 30 yrs
- 0.0%
- Est. flood insurance / yr
- $473 – $860
Fire risk 2/10 · Minimal
- Est. fire insurance / yr
- $691 – $1,283
Heat risk 4/10 · Minor
- Hot days now (above 90°F)
- 7 days/yr
- Hot days in 30 yrs
- 19 days/yr
Wind risk 8/10 · Major
- Chance of severe wind over 30 yrs
- 80.0%
Air-quality risk 2/10 · Minimal
- Unhealthy air days now
- 2 days/yr
- Unhealthy air days in 30 yrs
- 2 days/yr
Risk factors via First Street. Map © Google.
Why this score? — see what drove the A- grade
The composite is a weighted blend of 9 inputs, each scored 0–100. Each bar is that input's sub-score; the figure is the points it added to the 100-point composite (weight × sub-score).
- Cash flow +30.0/30.0
- 1% rule +10.0/10.0
- DSCR +10.0/10.0
- ARV discount +8.3/15.0
- Appreciation +7.0/10.0
- Schools +6.6/10.0
- Livability +3.4/5.0
- Rent growth +2.5/5.0
- Condition / age +2.5/5.0
$2,775,000
🖨 Deal sheet 📄 Offer letter ✓ Due diligence
Listing remarks
Quogue Village Ultimate Retreat Enjoy resort-style living at its finest in this exceptional Quogue Village residence, nestled on 2.02 +/- acres bordering a 6.5 acre reserve. Thoughtfully crafted with both luxury and leisure in mind, this 7 bedroom, 9 full bath, 4705 sf +/- home offers an unmatched array of amenities. The main level features a spacious foyer, leading to a light filled cathedral ceiling living room with fireplace, an expansive dining room seating 12 or more, Open kitchen with breakfast eat-in area , and a Great room with a wet bar, all looking out through Glass doorways to the luxurious yard. Completing the main floor there are two en-suite bedrooms and an additional full bat
Key facts
- Private balcony
- Heated pool
- Finished lower level
Tags
Property features AI
Exterior
- Parking: 2-car garage; No carport
- Utilities: Septic tank; Utilities: see remarks
- Home design: Single family residence; Living area based on plans
- Construction: Shingle siding
- Exterior features: Balcony; Back yard; Basketball court with hoop; Fire pit; Garden; Tennis court(s); Private pool
Interior
- Kitchen: Chef's kitchen; Open, eat-in kitchen with breakfast bar; Stainless steel appliances
- Bedrooms: Includes a first-floor bedroom
- Bathrooms: Nine full bathrooms; Double vanity(s) in primary/ensuite bathrooms
- Heating & cooling: Central air conditioning; Oil heating; Propane heating
- Interior features: First-floor bedroom; First-floor full bathroom; Breakfast bar; Built-in features; Cathedral ceilings; Chef's kitchen; Double vanity in bath; Eat-in kitchen; Formal dining room; High ceilings; Open kitchen layout; Primary bathroom; Walk-in closets; Patio
- Laundry & utility: Basement (full)
Neighborhood map
What this means for you Summary
Snapshot
- This is a 5-bed/6.0-bath single-family listed at $2.77M.
Deal economics
- At list price, monthly cash flow is $14k ($171k/yr) — positive.
- The deal already cash-flows at list — no discount required.
- Meets the 1% rule at list price ($42k rent vs $2.77M).
- Recommended offer: $2.44M (12.0% below list) — sets the bar for market timing.
Location & tenants
- Location reads 67/100 on livability (#600 in NY) — a middle-class / working-renter tenant base. Strengths: crime A+, employment A+, health & safety B+; Watch: amenities F, commute F, cost of living F.
- Quogue Union Free School District (suburban): math 70% / reading 80% proficiency, ranked #125 of 755 in NY (top 17%) — strong family-tenant draw, lease renewals of 3-5y typical; only 4% free/reduced lunch — higher-income household profile.
- Zoned schools: Quogue Elementary School (math 87% / reading 92%, grade A+, #45 of 2,108 statewide, top 3%, 84 students, 0% FRL) — zoned schools at 0% FRL track the district average.
- Zoned-school proficiency averages 90% at this address vs 75% district-wide (+14 pts) — the actual schools serving this property are materially stronger than the Quogue Union Free School District average implies; a family-tenant draw the district grade alone would hide.
- Market conditions: 37 active listings in the ZIP; 7 comparable units currently listed for rent nearby; rentals at typical pace (median 24d on market — plan ~3-4 weeks tenant-placement turnaround); 1,366 units permitted in Suffolk County in 2024 (216 in 5+ unit buildings).
Forward outlook
- In year one you build about $131k of equity ($19k loan paydown + $111k appreciation (4.0% local appreciation)).
- Suffolk County population projected to shrink 5% by 2050 — rents likely to lag national; underwrite the cash flow, not the appreciation.
- At projected returns (4.0% appreciation + 3.0% rent growth), your $777k cash investment doubles in ~3 years — after that, you're playing with house money.
- By year 2, paydown + projected appreciation supports a ~$210k cash-out refi (75% LTV) — recoverable capital for the next deal without selling this one.
Negotiation context
- It's been on market 242 days — a 12% lower offer ($2.44M) is reasonable based on typical stale-listing flexibility.
- 4 sale attempts since 3y ago; this cycle's ask has dropped $475k (15%) from the opening price — seller is motivated, your offer sets the floor, not the list.
Risks & watch-outs
- Climate carrying-cost: severe wind risk, 80% chance of damaging wind over 30y — expect insurance premiums to compound above CPI over the hold.
Questions for the listing agent
- It's been on market 242 days. Have you received any prior offers? Is the seller open to a 12% concession, seller financing, or rate buy-down credit?
- Why hasn't it sold? Are there any deal-killer items the seller is aware of (foundation, flood, title, zoning, code violations)?
- Is there a deadline driving the sale (1031 exchange, divorce, estate, relocation)? That informs how much negotiation room exists.
- Schools are A-rated — typically a magnet for longer-tenancy family renters. What's the average tenant stay here, and is there a school-zone premium baked into asking?
- What's the average days-on-market for RENTAL listings here right now (not sales)? A rising rental-DOM trend means longer vacancies and softer asking-rent achievability than the comps imply.
- What's the recent tenant-quality profile in this submarket — average credit score on applications, eviction rate, late-payment / NSF rate, and stable-employment percentage? A property-management company in the area should have these aggregated.
- How much new for-sale + rental construction is in the pipeline within 1–3 miles? Heavy new supply typically softens prices + rents 12–24 months out; constrained supply supports both.
Investment metrics
- 1% rule
- 1.53% ✓
- Cap rate
- 12.46%
- Cash-on-cash
- 22.03%
- DSCR
- 1.98
- GRM
- 5.5
CMA / ARV
- ARV (on-the-fly)
- $2,826,451
- Comps found
- 3
Show comp detail 3 sales within ~0.75 mi
| Address | Dist | Beds/Ba | Sqft | Sold | Price | $/sf | Match |
|---|---|---|---|---|---|---|---|
| 12 Honeysuckle Ln | 0.31mi | 5/4.5 | 4,100 (-4%) | 1mo | $2,700,000 | $659 | 71 |
| 3 Sachem Ln | 0.47mi | 4/4.5 (-1) | 4,000 (-7%) | 0mo | $2,700,000 | $675 | 56 |
| 140 Damascus Rd | 0.53mi | 4/3.5 (-1) | 3,666 (-14%) | 4mo | $2,375,000 | $648 | 32 |
Match score weights: distance 35% · size 25% · config 20% · recency 20%. Top-matched comps best support the ARV.
Projected returns pro-forma
4.01% appreciation · 3.0% rent growth · sell at horizon
- IRR
- 30.2%
- Equity multiple
- 2.80×
- Total profit
- $1,395,185
- Equity at exit
- $1,409,016
- IRR
- 29.7%
- Equity multiple
- 5.52×
- Total profit
- $3,515,202
- Equity at exit
- $2,306,197
Cash invested: $777,000 (down + closing). Projections, not guarantees.
Landlord ↔ Tenant lean methodology
- Overall (STATE)
- 15 Strongly Tenant-Friendly
- State New York
- 15 Strongly Tenant-Friendly · D+10
- County
- — inherits STATE
- City
- — inherits STATE
ZIP-level market 11959
- Home prices YoY
- 1.1%
- Active inventory
- 37
- Price-to-rent
- 5.5×
Monthly cashflow live
- Estimated rent
- $42,335 high interval (Pro) →
- Mortgage (P&I)
- −$14,552
- Tax est. 1.5%
- −$3,469 /mo · $41,625/yr
- Insurance
- −$1,156
- HOA
- −$0
- Vacancy / Maint / Mgmt
- −$8,890
- Net cashflow
- $14,267
Break-even live
UW: 25.0% down · 7.5% · 30yr · 1.5% tax · 5.0% vac · 8.0% maint · 8.0% mgmt
Financing live
Cash to close
- Down payment
- $693,750
- Closing costs
- $83,250
- Reserves months
- —
- Total cash needed
- —
Loan-product check · same deal, 3 products live
Conventional
25% down · 7.5% · 30yr
- Down + closing
- —
- Monthly P&I
- —
- Monthly cashflow
- —
- DSCR
- —
- Eligible?
- —
Personal DTI + credit; lowest rate.
DSCR
20% down · 8.5% · 30yr
- Down + closing
- —
- Monthly P&I
- —
- Monthly cashflow
- —
- DSCR
- —
- Eligible?
- —
No personal income docs; deal must DSCR.
Hard money
10% down · 12.0% · 12mo
- Down + closing
- —
- Monthly P&I
- —
- Monthly cashflow
- —
- DSCR
- —
- Eligible?
- —
Short-term bridge; refi at stabilization.
Rent comps 7 comps
| Address | Beds | Baths | Sqft | Rent | $/sqft | DOM | Units | Dist |
|---|---|---|---|---|---|---|---|---|
| 3 Rosebud Ln East Quogue, NY | 6.0 | 7.5 | 4500 | $55,000 | $12.22 | 43d | 1 | 0.18mi |
| 3 Cherry Blossom Ln East Quogue, NY | 5.0 | 4.5 | 3632 | $40,000 | $11.01 | 43d | 1 | 0.33mi |
| 15 Fox Hollow Dr East Quogue, NY | 6.0 | 5.0 | 3375 | $27,500 | $8.15 | 7d | 1 | 0.47mi |
| 99 Spinney Rd East Quogue, NY | 5.0 | 4.5 | 3512 | $95,000 | $27.05 | 24d | 1 | 0.94mi |
| 32A Vail Ave East Quogue, NY | 4.0 | 5.0 | 4442 | $23,000 | $5.18 | 10d | 1 | 0.99mi |
| 28 Old Meeting House Rd Quogue, NY | 5.0 | 5.5 | 4500 | $30,000 | $6.67 | 24d | 1 | 1.22mi |
| 50 Old Main Rd Quogue, NY | 4.0 | 4.5 | 3702 | $30,000 | $8.10 | 24d | 1 | 1.45mi |
Listing history 12 events
-
2026-04-24status Pending
-
2026-03-27price $2,775,000
-
2026-02-13status Active
-
2026-02-11historical
-
2025-11-05price $2,999,000
-
2025-08-22$3,250,000 Active
-
2024-07-02historical $60,000
-
2024-05-28price $60,000
-
2024-05-04price $75,000
-
2024-04-17$85,000
-
2024-02-24historical $85,000
-
2023-08-17$85,000
ⓘ Source: listings_history table (triggers on properties + properties_extension) + one-shot
backfill from property_details.listing_events for pre-trigger history.
Climate risk First Street
- Flood 1/10 Low FEMA zone X (unshaded) · 0% chance over 30 yrs
- Wildfire 2/10 Low
- Heat 4/10 Moderate 7 d/yr ≥90°F today · 19 d/yr by 30 yrs out
- Wind 8/10 Severe 80% chance of damaging wind over 30 yrs
- Air quality 2/10 Low 2 unhealthy d/yr today · 2 by 30 yrs out
Nearby sold comps map
Loading sold comps map…
Walkable amenities ~0.75 mi
Loading nearby amenities…
Taxation est. · year 1
- Rental income
- $508,017
- − Mortgage interest
- −$155,443
- − Property taxes
- −$41,625
- − Insurance
- −$13,875
- − Repairs & maintenance
- −$40,641
- − Management
- −$40,641
- − Depreciation
- −$80,727
- Taxable income
- $135,064
- Est. tax owed @ 24.0%
- −$32,415
- After-tax cash flow
- $138,789/yr
For passive investors: Depreciation is non-cash, so a rental often shows a tax loss while cash-flowing — sheltering income. Rental losses are passive: they offset passive income freely, and up to $25,000/yr can offset ordinary (W-2) income if you actively participate and your MAGI is under $100k (phasing out to $0 by $150k); unused losses carry forward. On sale, claimed depreciation is recaptured at up to 25%, and gains may owe capital-gains tax (a 1031 exchange can defer both). Figures are a year-1 estimate at your 24.0% rate — not tax advice; consult a CPA.
Schools (NCES district)
- District
- Quogue Union Free School District
- NCES district ID
- 3624060
- Math proficiency
- 70% ▼ -10.00%
- Reading proficiency
- 80% ▬ 0.00%
- Median HH income
- $66,746
- Composite
- 66.09/100
- National rank
- #960
- State rank
- #125 of 755 in NY
Livability — Quogue
- Score
- 67/100
- State rank
- #600
- US rank
- #10895
Category grades
Schools grade is shown separately in the Schools card above.
Census & demographics
- Census place
- Quogue, NY
- City population
- 576
- Population (ZIP)
- 576
Population outlook (Suffolk County) Hauer SSP2
- Today (2025)
- 1,505,262 people
- By 2030
- 1,498,318 · -0.5%
- By 2040
- 1,471,101 · -2.3%
- By 2050
- 1,424,848 · -5.3%
- By 2075
- 1,337,157 · -11.2%
- By 2100
- 1,217,720 · -19.1%
Race, ethnicity, and origin ACS 2023
- Neighborhood character
- Predominantly White (71%)
- Race & ethnicity
- White 71% Two or more races 23% Hispanic / Latino 23% Black 3%
- Hispanic origin (detail)
- Common ancestry
- Italian 21% Portuguese 7% Scotch-Irish 4%
- Foreign-born
- 18% · Canada
- Languages at home
- 83% English-only · Spanish 17%
Political lean MEDSL · Suffolk
- 2024 margin
- Lean R (+10.0) · D 45.0% · R 55.0%
- 2008→2024 swing
- -16.0pp toward R · 2008: 6.0pp · 2024: -10.0pp
- All cycles
- 2024: R+10.0 2020: R+0.0 2016: R+8.2 2012: D+2.9 2008: D+6.0
Not yet ingested
- Civics
- —
Market trends
- HPI YoY
- ▲ 4.01%
- Current HPI
- 364.8746
- Rent YoY
- —
- Metro
- —
- State GDP YoY
- ▲ 2.60%
- F500 in state
- 92
Industry mix (Fortune 500 HQ in NY)
| Industry | F500 HQs | Revenue |
|---|---|---|
| Financial Services | 10 | $950B |
|
||
| Consumer Goods | 9 | $162B |
|
||
| Insurance | 4 | $225B |
|
||
| Telecommunications | 2 | $144B |
|
||
| Pharmaceuticals | 2 | $112B |
|
||
| Media / Entertainment | 2 | $69B |
|
||
Price history
+3164.7% since first listed12 events — show timeline
- 2026-04-24 Pending — OneKey® MLS as Distributed by MLS Grid
- 2026-03-27 Price Changed $2,775,000 OneKey® MLS as Distributed by MLS Grid
- 2026-02-13 Relisted — OneKey® MLS as Distributed by MLS Grid
- 2026-02-11 Listing Removed — OneKey® MLS as Distributed by MLS Grid
- 2025-11-05 Price Changed $2,999,000 OneKey® MLS as Distributed by MLS Grid
- 2025-08-22 Listed $3,250,000 OneKey® MLS as Distributed by MLS Grid
- 2024-07-02 Rental Removed $60,000 ONEKEY
- 2024-05-28 Price Changed $60,000 ONEKEY
- 2024-05-04 Price Changed $75,000 ONEKEY
- 2024-04-17 Listed for Rent $85,000 ONEKEY
- 2024-02-24 Rental Removed $85,000 ONEKEY
- 2023-08-17 Listed for Rent $85,000 ONEKEY
Property tax history
-1.0%/yrLatest (2025): $2,331 · +5.8% YoY. Source: county tax records.
Cash-flow waterfall
monthlySold comps — $/sqft
last 12 mo · ≤1 miLoading sold comps…