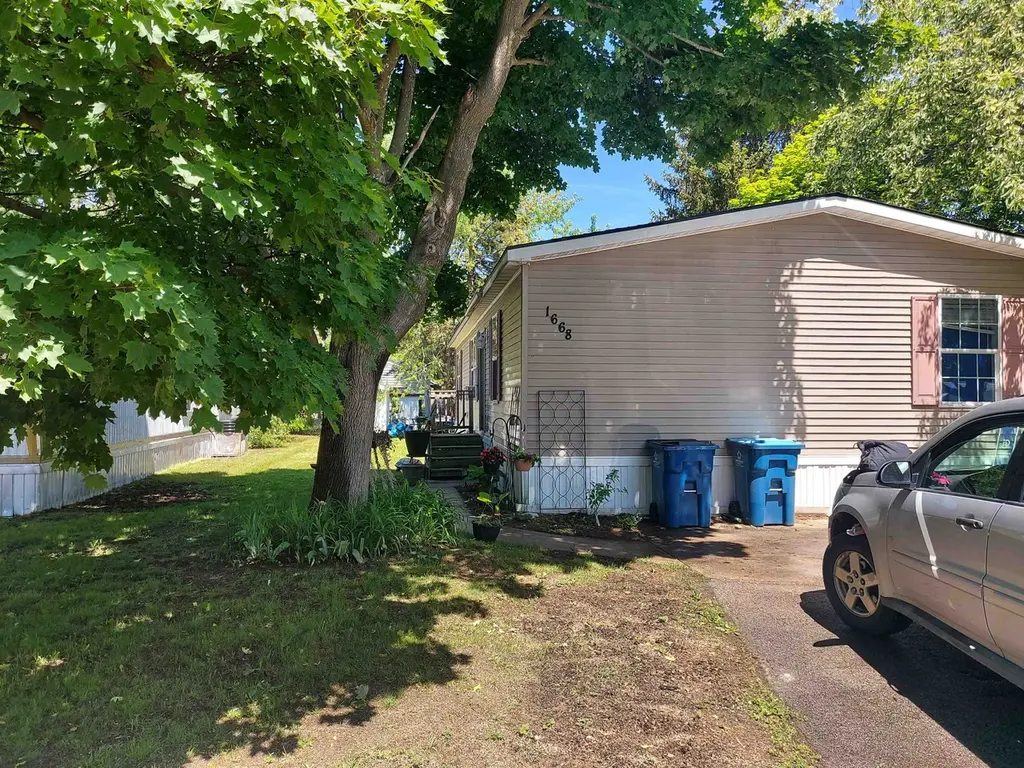
1668 Rex Pl · Traverse City, MI
Flood risk No data
- FEMA flood zone
- —
- Chance of flooding over 30 yrs
- —
- Est. flood insurance / yr
- —
Fire risk No data
- Est. fire insurance / yr
- —
Heat risk No data
- Hot days now (above threshold)
- —
- Hot days in 30 yrs
- —
Wind risk No data
- Chance of severe wind over 30 yrs
- —
Air-quality risk No data
- Unhealthy air days now
- —
- Unhealthy air days in 30 yrs
- —
Risk factors via First Street. Map © Google.
Why this score? — see what drove the B grade
The composite is a weighted blend of 9 inputs, each scored 0–100. Each bar is that input's sub-score; the figure is the points it added to the 100-point composite (weight × sub-score).
- Cash flow +30.0/30.0
- 1% rule +10.0/10.0
- DSCR +10.0/10.0
- ARV discount +7.5/15.0
- Livability +4.5/5.0
- Schools +4.4/10.0
- Condition / age +2.8/5.0
- Rent growth +2.4/5.0
- Appreciation +0.0/10.0
$74,000
🖨 Deal sheet 📄 Offer letter ✓ Due diligence
Listing remarks MLS
Located on a nice shady lot on a quiet street in Kings Court. Cute double wide with 3 bedrooms, 2 baths, 1400 sq ft. Sellers are in the middle of packing, and will have the walls freshly painted, and carpets clean. Making it nice and fresh for the new home owner. Photos will be updated, room size approx, no A/C. New shingles 2022' Current lot rent $900 includes amenities. (Trash-water-sewer-wifi) Dog on property.
Key facts
- Freshly painted
- Carpets clean
- New shingles
Tags
Property features AI
Finance
- HOA & community: Association allows pets; Association fee includes trash removal
Exterior
- Utilities: Community well water; Community sewer; Cable available; Natural gas
- Home design: Manufactured double-wide home; Built in 2005; Residential property
- Construction: Vinyl siding exterior; Manufactured construction; Built in 2005
- Exterior features: Vinyl siding; Shed on property; No water features
Interior
- Kitchen: Kitchen approx. 9 x 13; Dishwasher; Range/Oven; Refrigerator
- Bedrooms: Main-level bedroom; Primary bedroom approx. 13 x 13; Second bedroom approx. 10 x 13; Third bedroom approx. 12' wide
- Bathrooms: Two full bathrooms; Primary bathroom included
- Heating & cooling: Forced air heating; Natural gas
- Interior features: Basement (other type); First-floor bedroom
- Laundry & utility: Main-level laundry; Washer; Dryer
Neighborhood map
What this means for you Summary
Snapshot
- This is a 3-bed/1.0-bath other listed at $74k. Condition is rated average.
Deal economics
- At list price, monthly cash flow is $1k ($14k/yr) — positive.
- The deal already cash-flows at list — no discount required.
- Meets the 1% rule at list price ($2k rent vs $74k).
- Cap rate 24.7% vs local median 1.7% in Traverse City — top-decile yield for the area; either an underpriced asset or a hidden risk that comps aren't pricing in. Stress-test before assuming the spread holds.
Location & tenants
- Location reads 91/100 on livability (#4 in MI, #46 nationally) — a professional / high-income tenant draw. Strengths: amenities A+, commute A+, housing A+.
- Traverse City Area Public Schools (town): math 45% / reading 56% proficiency, ranked #94 of 540 in MI (top 17%) — acceptable for families but not a draw, mixed tenant base, ~2y average lease.
- Market conditions: Rents soft (-0.5%/yr); 322 active listings in the ZIP; 8 comparable units currently listed for rent nearby; rentals lingering (median 44d on market — plan ~5-8 weeks vacancy on turnover, expect pricing pressure); 100% of comp listings sitting > 30 days — soft ceiling on asking rent; 883 units permitted in Grand Traverse County in 2024 (501 in 5+ unit buildings).
- This rent runs 35% of the median local income ($72k/yr) — at the standard rent-burdened threshold; future hikes will face affordability resistance.
Forward outlook
- Local home prices are declining (-3.0%/yr); year-one equity from $512 of loan paydown is wiped out by about $2k of value loss. Plan a longer hold.
- Grand Traverse County population projected at +20% by 2050 — long-run rental-demand tailwind backs the buy-and-hold thesis.
- At projected returns (-3.0% appreciation + 0.0% rent growth), your $21k cash investment doubles in ~2 years — after that, you're playing with house money.
Negotiation context
- Only 11 days on market — expect competitive offers; lowballing is unlikely to land.
- 2 sale attempts with the ask held roughly flat each time — persistent listings suggest the price (not the market) is what's stuck; bring a comps-based counter.
Questions for the listing agent
- Is there a deadline driving the sale (1031 exchange, divorce, estate, relocation)? That informs how much negotiation room exists.
- Schools are A-rated — typically a magnet for longer-tenancy family renters. What's the average tenant stay here, and is there a school-zone premium baked into asking?
- What's the average days-on-market for RENTAL listings here right now (not sales)? A rising rental-DOM trend means longer vacancies and softer asking-rent achievability than the comps imply.
- What's the recent tenant-quality profile in this submarket — average credit score on applications, eviction rate, late-payment / NSF rate, and stable-employment percentage? A property-management company in the area should have these aggregated.
- How much new for-sale + rental construction is in the pipeline within 1–3 miles? Heavy new supply typically softens prices + rents 12–24 months out; constrained supply supports both.
Investment metrics
- 1% rule
- 2.82% ✓
- Cap rate
- 24.72%
- Cash-on-cash
- 65.80%
- DSCR
- 3.93
- GRM
- 3.0
CMA / ARV
No comps found within radius.
Projected returns pro-forma
-3.0% appreciation · 0.0% rent growth · sell at horizon
- IRR
- 61.6%
- Equity multiple
- 3.62×
- Total profit
- $54,291
- Equity at exit
- $11,034
- IRR
- 65.2%
- Equity multiple
- 6.64×
- Total profit
- $116,962
- Equity at exit
- $6,398
Cash invested: $20,720 (down + closing). Projections, not guarantees.
Landlord ↔ Tenant lean methodology
- Overall (STATE)
- 62 Landlord-Friendly
- State Michigan
- 62 Landlord-Friendly · EVEN
- County
- — inherits STATE
- City
- — inherits STATE
ZIP-level market 49686
- Rents YoY
- -0.5%
- Active inventory
- 322
- Price-to-rent
- 3.0×
Monthly cashflow live
- Estimated rent
- $2,086 high interval (Pro) →
- Mortgage (P&I)
- −$388
- Tax est. 1.5%
- −$92 /mo · $1,110/yr
- Insurance
- −$31
- HOA
- −$0
- Vacancy / Maint / Mgmt
- −$438
- Net cashflow
- $1,136
Break-even live
UW: 25.0% down · 7.5% · 30yr · 1.5% tax · 5.0% vac · 8.0% maint · 8.0% mgmt
Financing live
Cash to close
- Down payment
- $18,500
- Closing costs
- $2,220
- Reserves months
- —
- Total cash needed
- —
Loan-product check · same deal, 3 products live
Conventional
25% down · 7.5% · 30yr
- Down + closing
- —
- Monthly P&I
- —
- Monthly cashflow
- —
- DSCR
- —
- Eligible?
- —
Personal DTI + credit; lowest rate.
DSCR
20% down · 8.5% · 30yr
- Down + closing
- —
- Monthly P&I
- —
- Monthly cashflow
- —
- DSCR
- —
- Eligible?
- —
No personal income docs; deal must DSCR.
Hard money
10% down · 12.0% · 12mo
- Down + closing
- —
- Monthly P&I
- —
- Monthly cashflow
- —
- DSCR
- —
- Eligible?
- —
Short-term bridge; refi at stabilization.
Rent comps 8 comps
| Address | Beds | Baths | Sqft | Rent | $/sqft | DOM | Units | Dist |
|---|---|---|---|---|---|---|---|---|
| 1585 Ray Blvd Traverse City, MI | 3.0 | 2.0 | 1246 | $1,699 | $1.36 | 43d | 1 | 0.13mi |
| 2944 Glen Dr Traverse City, MI | 3.0 | 2.0 | 1165 | $1,800 | $1.55 | 43d | 1 | 0.38mi |
| 1555 Ridge Blvd Traverse City, MI | 3.0 | 1.0–2.0 | 1059 | $2,225 | $2.10 | 44d | 1 | 0.47mi |
| 1555 Ridge Blvd Traverse City, MI | 2.0 | 1.0–2.0 | 1063 | $1,935 | $1.82 | 43d | 11 | 0.47mi |
| 1021 Manitou Dr Unit 3 Bedroom/2 Bathroom Waitlist Traverse City, MI | 3.0 | 2.0 | 1330 | $2,000 | $1.50 | 43d | 1 | 0.79mi |
| 1021 Manitou Dr Unit 2 Bedroom/1 Bathroom Waitlist Traverse City, MI | 2.0 | 1.0 | 1056 | $1,700 | $1.61 | 43d | 1 | 0.79mi |
| 1560 Simsbury St Traverse City, MI | 2.0–3.0 | 1.5–2.0 | 1293 | $2,775 | $2.15 | 43d | 8 | 1.15mi |
| 1542 Simsbury St #7 Traverse City, MI | 3.0 | 2.0 | 1446 | $2,775 | $1.92 | 43d | 1 | 1.16mi |
Listing history 9 events
-
2026-06-19days on market $74,000 Active 11 DOM
-
2026-06-18days on market $74,000 Active 10 DOM
-
2026-06-17days on market $74,000 Active 9 DOM
-
2026-06-16days on market $74,000 Active 8 DOM
-
2026-06-15days on market $74,000 Active 7 DOM
-
2026-06-14days on market $74,000 Active 5 DOM
-
2026-06-12days on market $74,000 Active 4 DOM
-
2026-06-09remarks 416-char remark
-
2026-06-09$74,000 Active 1 DOM
ⓘ Source: listings_history table (triggers on properties + properties_extension) + one-shot
backfill from property_details.listing_events for pre-trigger history.
Nearby sold comps map
Loading sold comps map…
Walkable amenities ~0.75 mi
Loading nearby amenities…
Taxation est. · year 1
- Rental income
- $25,026
- − Mortgage interest
- −$4,145
- − Property taxes
- −$1,110
- − Insurance
- −$370
- − Repairs & maintenance
- −$2,002
- − Management
- −$2,002
- − Depreciation
- −$2,153
- Taxable income
- $13,244
- Est. tax owed @ 24.0%
- −$3,179
- After-tax cash flow
- $10,455/yr
For passive investors: Depreciation is non-cash, so a rental often shows a tax loss while cash-flowing — sheltering income. Rental losses are passive: they offset passive income freely, and up to $25,000/yr can offset ordinary (W-2) income if you actively participate and your MAGI is under $100k (phasing out to $0 by $150k); unused losses carry forward. On sale, claimed depreciation is recaptured at up to 25%, and gains may owe capital-gains tax (a 1031 exchange can defer both). Figures are a year-1 estimate at your 24.0% rate — not tax advice; consult a CPA.
Condition & rehab AI · 10 photos
This double-wide mobile home requires cosmetic updates to its kitchen and bathroom, along with some exterior maintenance. Painting and organizing the interior spaces will significantly enhance its resale and rental value.
Repairs flagged
- Minor Kitchen cabinets — Worn appearance
- Minor Bathroom fixtures — Dated appearance
- Moderate Exterior siding — Weathered appearance
Value-add opportunities
- Both Paint interior walls — Fresh paint enhances curb appeal and interior aesthetics
- Both Organize kitchen and bathroom — Clutter detracts from home's appeal
- Both Trim and maintain landscaping — Well-maintained landscaping improves curb appeal and adds value
Renovation cost estimate screening
| Repair item | Severity | Est. cost |
|---|---|---|
| Kitchen cabinets · Worn appearance | Minor | $500–3,000 |
| Bathroom fixtures · Dated appearance | Minor | $500–3,000 |
| Exterior siding · Weathered appearance | Moderate | $3,000–15,000 |
| Total estimated repair cost · 3 items | $4,000–21,000 |
Value-add ROI direction
- Both Paint interior walls — Fresh paint enhances curb appeal and interior aesthetics ↑
- Both Organize kitchen and bathroom — Clutter detracts from home's appeal ↑
- Both Trim and maintain landscaping — Well-maintained landscaping improves curb appeal and adds value ↑
ⓘ Cost ranges are severity-bucket heuristics (US national rule-of-thumb). Get contractor quotes + a written scope before underwriting a rehab budget.
Schools (NCES district)
- District
- Traverse City Area Public Schools
- NCES district ID
- 2633870
- Math proficiency
- 45% ▼ -3.00%
- Reading proficiency
- 56% ▼ -6.00%
- Median HH income
- $53,645
- Composite
- 43.51/100
- National rank
- #2990
- State rank
- #94 of 540 in MI
Livability — Traverse City
- Score
- 91/100
- State rank
- #4
- US rank
- #46
Category grades
Schools grade is shown separately in the Schools card above.
Census & demographics
- County
- Grand Traverse County · 47,077 people
- City population
- 47,077
- Metro
- Traverse City, MI
- Population (ZIP)
- 25,492
- Household income
- $71,609
- Rent vs Own
- Severe rent burden
- 676.0
Population outlook (Grand Traverse County) Hauer SSP2
- Today (2025)
- 102,241 people
- By 2030
- 107,172 · +4.8%
- By 2040
- 115,676 · +13.1%
- By 2050
- 122,377 · +19.7%
- By 2075
- 136,554 · +33.6%
- By 2100
- 137,871 · +34.8%
Race, ethnicity, and origin ACS 2023
- Neighborhood character
- Predominantly White (91%)
- Race & ethnicity
- White 91% Two or more races 6% Hispanic / Latino 5% Native American 1%
- Hispanic origin (detail)
- Mexican 4%
- Common ancestry
- Romanian 11% Lithuanian 5% Slovak 4%
- Foreign-born
- 2% · Canada
- Languages at home
- 96% English-only · Spanish 3%
Political lean MEDSL · Grand Traverse
- 2024 margin
- Toss-up / Even · D 48.3% · R 50.1% · Other 1.6%
- 2008→2024 swing
- +1.3pp toward D · 2008: -3.0pp · 2024: -1.7pp
- All cycles
- 2024: R+1.7 2020: R+3.0 2016: R+12.5 2012: R+11.8 2008: R+3.0
Not yet ingested
- Civics
- —
Market trends
- HPI YoY
- ▼ -276.28%
- Current HPI
- 352.4866
- Rent YoY
- ▼ -0.49%
- Metro
- Traverse City, MI
- State GDP YoY
- ▲ 1.37%
- F500 in state
- 28
Industry mix (Fortune 500 HQ in MI)
| Industry | F500 HQs | Revenue |
|---|---|---|
| Automotive Parts | 3 | $48B |
|
||
| Automotive | 2 | $372B |
|
||
| Chemicals | 1 | $45B |
|
||
| Automotive Retail | 1 | $29B |
|
||
| Healthcare / Medical Devices | 1 | $23B |
|
||
| Automotive Technology | 1 | $20B |
|
||
Price history
+0.0% since first listed2 events — show timeline
- 2026-06-08 Listed $74,000 REALCOMP
- 2026-06-08 Listed $74,000 MiRealSource-MiMLS
Property tax history
-5.6%/yrLatest (2025): $80 · -5.6% YoY. Source: county tax records.
Cash-flow waterfall
monthlySold comps — $/sqft
last 12 mo · ≤1 miLoading sold comps…