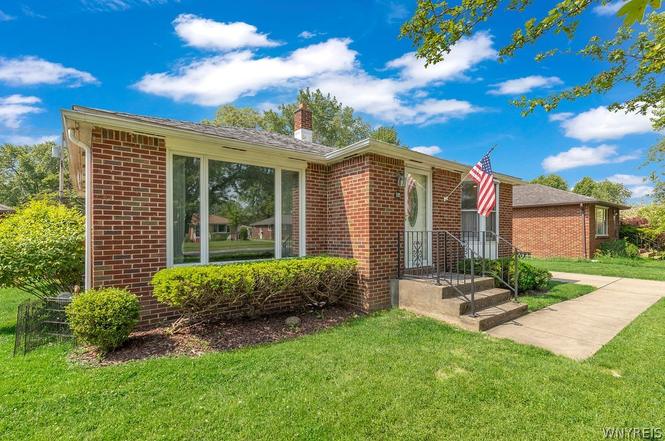
185 Siegfried Dr · Williamsville, NY
Flood risk 1/10 · Minimal
- FEMA flood zone
- X (unshaded)
- Chance of flooding over 30 yrs
- 0.0%
- Est. flood insurance / yr
- $473 – $860
Fire risk 1/10 · Minimal
- Est. fire insurance / yr
- $691 – $1,283
Heat risk 2/10 · Minimal
- Hot days now (above 94°F)
- 7 days/yr
- Hot days in 30 yrs
- 15 days/yr
Wind risk 1/10 · Minimal
- Chance of severe wind over 30 yrs
- —
Air-quality risk 3/10 · Minor
- Unhealthy air days now
- 2 days/yr
- Unhealthy air days in 30 yrs
- 3 days/yr
Risk factors via First Street. Map © Google.
Why this score? — see what drove the D+ grade
The composite is a weighted blend of 9 inputs, each scored 0–100. Each bar is that input's sub-score; the figure is the points it added to the 100-point composite (weight × sub-score).
- ARV discount +13.3/15.0
- Cash flow +10.7/30.0
- Schools +6.3/10.0
- Livability +4.2/5.0
- Rent growth +3.8/5.0
- 1% rule +3.4/10.0
- DSCR +3.1/10.0
- Condition / age +2.5/5.0
- Appreciation +0.0/10.0
$275,000
🖨 Deal sheet (PDF) 📄 Offer letter ✓ Due diligence
Listing remarks
Welcome to 185 Siegfried Drive! This well-maintained brick ranch has been lovingly maintained by one family since it was built. Nestled in the highly desirable Williamsville School District, this move-in-ready home offers the perfect blend of charm, thoughtful updates and comfortable living spaces. Step inside to discover a bright & inviting interior and a well-designed floor plan. The living room features a huge, oversized window filling it with natural light. The large eat-in kitchen is well layout and appliance for your culinary adventures. There are well-protected hard wood floors under the carpeting in the living room and bedrooms. The bathroom fixtures have been updated, includi
Key facts
- Screened patio
- 9,000 sq ft lot
- 2 garage spots
Tags
Property features AI
Exterior
- Parking: Detached garage with electricity; 2 garage spaces
- Utilities: Electricity connected (circuit breakers); Public water connected; Sewer connected
- Home design: Single-story home; Existing construction
- Construction: Brick construction; Asphalt roof; Poured foundation; Copper plumbing
- Exterior features: Concrete driveway; Patio
Interior
- Kitchen: Electric oven and range; Microwave; Dishwasher; Refrigerator
- Bedrooms: Three main-level bedrooms (all on the first floor)
- Flooring: Hardwood; Vinyl; Varies
- Bathrooms: One full bathroom; One half bathroom; One main-level bathroom
- Heating & cooling: Gas forced-air heating; Central air conditioning
- Interior features: Eat-in kitchen; Full basement with sump pump; Recreation room
- Laundry & utility: Washer and dryer; Laundry located in the basement; Gas water heater
Neighborhood map
What this means for you Summary
Snapshot
- This is a 3-bed/1.0-bath single-family listed at $275k.
Deal economics
- At list price, monthly cash flow is $-132 ($-2k/yr) — negative.
- To cash-flow at today's rent, offer at most $252k (8.5% below list).
- To meet the 1% rule (rent ≥ 1% of price), the offer needs to be $232k (15.6% below list).
- Recommended offer: $232k (15.6% below list) — sets the bar for 1% rule.
- Cap rate 5.7% vs local median 3.5% in Williamsville — top-decile yield for the area; either an underpriced asset or a hidden risk that comps aren't pricing in. Stress-test before assuming the spread holds.
Location & tenants
- Location reads 84/100 on livability (#44 in NY, #693 nationally) — a professional / high-income tenant draw. Strengths: schools A+, commute A+, employment A+.
- Williamsville Central School District (suburban): math 64% / reading 77% proficiency, ranked #114 of 590 in NY (top 19%) — strong family-tenant draw, lease renewals of 3-5y typical; only 10% free/reduced lunch — higher-income household profile.
- Market conditions: Rents rising fast (+5.0%/yr); 329 active listings in the ZIP; 5 comparable units currently listed for rent nearby; rentals leasing fast (median 2d on market — plan ~1-2 weeks tenant-placement turnaround); solid renter incomes; 1,244 units permitted in Erie County in 2024 (563 in 5+ unit buildings).
Forward outlook
- Local home prices are declining (-3.0%/yr); year-one equity from $2k of loan paydown is wiped out by about $8k of value loss. Plan a longer hold.
Negotiation context
- Only 8 days on market — expect competitive offers; lowballing is unlikely to land.
Risks & watch-outs
- Watch-outs: built in 1957 — expect roof / HVAC / electrical / plumbing capex.
Questions for the listing agent
- What do current leases actually rent for vs. the listed asking? Can we see a recent rent roll and the last 12 months of T-12 income?
- Built in 1957 — when were the roof, HVAC, electrical panel, plumbing, and water heater last replaced?
- Is there a deadline driving the sale (1031 exchange, divorce, estate, relocation)? That informs how much negotiation room exists.
- Schools are A-rated — typically a magnet for longer-tenancy family renters. What's the average tenant stay here, and is there a school-zone premium baked into asking?
- The area grade is low — what's the realistic commute time and amenity access for the typical tenant pool here? Any planned neighborhood developments (good or bad) we should know about?
- What's the average days-on-market for RENTAL listings here right now (not sales)? A rising rental-DOM trend means longer vacancies and softer asking-rent achievability than the comps imply.
- What's the recent tenant-quality profile in this submarket — average credit score on applications, eviction rate, late-payment / NSF rate, and stable-employment percentage? A property-management company in the area should have these aggregated.
- How much new for-sale + rental construction is in the pipeline within 1–3 miles? Heavy new supply typically softens prices + rents 12–24 months out; constrained supply supports both.
Investment metrics
- 1% rule
- 0.84% ✗
- Cap rate
- 5.72%
- Cash-on-cash
- -2.06%
- DSCR
- 0.91
- GRM
- 9.9
CMA / ARV
- ARV (on-the-fly)
- $315,700
- Comps found
- 4
Show comp detail 4 sales within ~0.75 mi
| Address | Dist | Beds/Ba | Sqft | Sold | Price | $/sf | Match |
|---|---|---|---|---|---|---|---|
| 219 Forest Hill Dr | 0.08mi | 3/1.5 | 1,143 (+4%) | 5mo | $320,000 | $280 | 83 |
| 194 Siegfried Dr | 0.04mi | 3/2.0 | 1,168 (+6%) | 12mo | $335,058 | $287 | 74 |
| 1117 N Forest Rd | 0.31mi | 3/1.0 | 1,041 (-5%) | 10mo | $349,000 | $335 | 68 |
| 77 Siegfried Dr | 0.21mi | 3/1.5 | 1,228 (+12%) | 5mo | $310,000 | $252 | 65 |
Match score weights: distance 35% · size 25% · config 20% · recency 20%. Top-matched comps best support the ARV.
Projected returns pro-forma
-3.0% appreciation · 5.01% rent growth · sell at horizon
- IRR
- -17.4%
- Equity multiple
- 0.37×
- Total profit
- $-48,125
- Equity at exit
- $41,003
- IRR
- -5.9%
- Equity multiple
- 0.58×
- Total profit
- $-31,977
- Equity at exit
- $23,777
Cash invested: $77,000 (down + closing). Projections, not guarantees.
Landlord ↔ Tenant lean methodology
- Overall (STATE)
- 15 Strongly Tenant-Friendly
- State New York
- 15 Strongly Tenant-Friendly · D+10
- County
- — inherits STATE
- City
- — inherits STATE
ZIP-level market 14221
- Rents YoY
- 5.0%
- Active inventory
- 329
- Price-to-rent
- 9.9×
Monthly cashflow live
- Estimated rent
- $2,321 high interval (Pro) →
- Mortgage (P&I)
- −$1,442
- Tax from tax record
- −$409 /mo · $4,913/yr
- Insurance
- −$115
- HOA
- −$0
- Vacancy / Maint / Mgmt
- −$487
- Net cashflow
- $-132
Break-even live
Sensitivity live
| Price | -10% $23 | -5% $-54 | +0% $-132 | +5% $-210 | +10% $-288 |
|---|---|---|---|---|---|
| Rent | -10% $-316 | -5% $-224 | +0% $-132 | +5% $-41 | +10% $51 |
| Rate | -1.0pp $6 | -0.5pp $-62 | base $-132 | +0.5pp $-204 | +1.0pp $-276 |
UW: 25.0% down · 7.5% · 30yr · 1.5% tax · 5.0% vac · 8.0% maint · 8.0% mgmt
Financing live
Cash to close
- Down payment
- $68,750
- Closing costs
- $8,250
- Reserves months
- —
- Total cash needed
- —
Loan-product check · same deal, 3 products live
Conventional
25% down · 7.5% · 30yr
- Down + closing
- —
- Monthly P&I
- —
- Monthly cashflow
- —
- DSCR
- —
- Eligible?
- —
Personal DTI + credit; lowest rate.
DSCR
20% down · 8.5% · 30yr
- Down + closing
- —
- Monthly P&I
- —
- Monthly cashflow
- —
- DSCR
- —
- Eligible?
- —
No personal income docs; deal must DSCR.
Hard money
10% down · 12.0% · 12mo
- Down + closing
- —
- Monthly P&I
- —
- Monthly cashflow
- —
- DSCR
- —
- Eligible?
- —
Short-term bridge; refi at stabilization.
Rent comps 5 comps
| Address | Beds | Baths | Sqft | Rent | $/sqft | DOM | Units | Dist |
|---|---|---|---|---|---|---|---|---|
| 1325 N Forest Rd Buffalo, NY | 1.0–3.0 | 1.0 | 870 | $2,095 | $2.41 | 2d | 9 | 0.54mi |
| 540 Mill St Buffalo, NY | 3.0 | 1.5 | 1300 | $2,095 | $1.61 | 2d | 1 | 0.75mi |
| 116 Segsbury Rd Buffalo, NY | 3.0 | 2.0 | 1488 | $2,950 | $1.98 | 24d | 1 | 0.77mi |
| 255 Evans St Williamsville, NY | 1.0–2.0 | 1.0–2.0 | 975 | $2,350 | $2.41 | 2d | 13 | 1.29mi |
| 499 Burroughs Dr Unit 5 Amherst, NY | 2.0 | 1.5 | 1200 | $1,800 | $1.50 | 2d | 1 | 1.30mi |
Listing history 7 events
-
2026-06-19status $275,000 Pending 8 DOM
-
2026-06-18days on market $275,000 Active 8 DOM
-
2026-06-17days on market $275,000 Active 7 DOM
-
2026-06-16days on market $275,000 Active 6 DOM
-
2026-06-15days on market $275,000 Active 5 DOM
-
2026-06-13remarks 695-char remark
-
2026-06-13$275,000 Active 3 DOM
ⓘ Source: listings_history table (triggers on properties + properties_extension) + one-shot
backfill from property_details.listing_events for pre-trigger history.
Tax reassessment forecast NY · Partial reset (capped growth)
- Current annual tax
- $4,913 · $409/mo
- Projected year-2 tax
- $4,913 · $409/mo
- Expected delta
- $0/yr ($0/mo · 0.0%)
ⓘ Screening estimate from a state-policy table — verify with the county assessor before closing.
Climate risk First Street
- Flood 1/10 Low FEMA zone X (unshaded) · 0% chance over 30 yrs
- Wildfire 1/10 Low
- Heat 2/10 Low 7 d/yr ≥94°F today · 15 d/yr by 30 yrs out
- Wind 1/10 Low
- Air quality 3/10 Moderate 2 unhealthy d/yr today · 3 by 30 yrs out
Nearby sold comps map
Loading sold comps map…
Walkable amenities ~0.75 mi
Loading nearby amenities…
Taxation est. · year 1
- Rental income
- $27,856
- − Mortgage interest
- −$15,404
- − Property taxes
- −$4,913
- − Insurance
- −$1,375
- − Repairs & maintenance
- −$2,228
- − Management
- −$2,228
- − Depreciation
- −$8,000
- Taxable loss
- −$6,294
- Est. tax savings @ 24.0%
- +$1,510
- After-tax cash flow
- $-77/yr
For passive investors: Depreciation is non-cash, so a rental often shows a tax loss while cash-flowing — sheltering income. Rental losses are passive: they offset passive income freely, and up to $25,000/yr can offset ordinary (W-2) income if you actively participate and your MAGI is under $100k (phasing out to $0 by $150k); unused losses carry forward. On sale, claimed depreciation is recaptured at up to 25%, and gains may owe capital-gains tax (a 1031 exchange can defer both). Figures are a year-1 estimate at your 24.0% rate — not tax advice; consult a CPA.
Schools (NCES district)
- District
- Williamsville Central School District
- NCES district ID
- 3631470
- Math proficiency
- 64% ▼ -14.00%
- Reading proficiency
- 77% ▲ 6.00%
- Median HH income
- $79,907
- Composite
- 62.59/100
- National rank
- #678
- State rank
- #114 of 590 in NY
Livability — Williamsville
- Score
- 84/100
- State rank
- #44
- US rank
- #693
Category grades
Schools grade is shown separately in the Schools card above.
Census & demographics
- County
- Erie County · 714,559 people
- City population
- 55,255
- Metro
- Buffalo-Cheektowaga, NY
- Population (ZIP)
- 55,255
- Household income
- $101,615
- Rent vs Own
- Severe rent burden
- 1956.0
Population outlook (Erie County) Hauer SSP2
- Today (2025)
- 933,037 people
- By 2030
- 935,181 · +0.2%
- By 2040
- 928,531 · -0.5%
- By 2050
- 905,725 · -2.9%
- By 2075
- 834,037 · -10.6%
- By 2100
- 708,033 · -24.1%
Race, ethnicity, and origin ACS 2023
- Neighborhood character
- Predominantly White (84%)
- Race & ethnicity
- White 84% Asian 8% Two or more races 4% Hispanic / Latino 3% Black 2%
- Common ancestry
- Romanian 15% Lithuanian 2% Slovak 2%
- Foreign-born
- 10% · Canada, China, South Korea
- Languages at home
- 88% English-only · Other Indo-European 3% Other Asian/Pacific 2% Spanish 2%
Political lean MEDSL · Erie
- 2024 margin
- Lean D (+9.7) · D 54.8% · R 45.2%
- 2008→2024 swing
- -7.9pp toward R · 2008: 17.5pp · 2024: 9.7pp
- All cycles
- 2024: D+9.7 2020: D+14.7 2016: D+4.8 2012: D+15.6 2008: D+17.5
Not yet ingested
- Civics
- —
Market trends
- HPI YoY
- ▼ -301.37%
- Current HPI
- 322.6947
- Rent YoY
- ▲ 5.01%
- Metro
- Buffalo-Cheektowaga, NY
- State GDP YoY
- ▲ 2.60%
- F500 in state
- 92
Industry mix (Fortune 500 HQ in NY)
| Industry | F500 HQs | Revenue |
|---|---|---|
| Financial Services | 10 | $950B |
|
||
| Consumer Goods | 9 | $162B |
|
||
| Insurance | 4 | $225B |
|
||
| Telecommunications | 2 | $144B |
|
||
| Pharmaceuticals | 2 | $112B |
|
||
| Media / Entertainment | 2 | $69B |
|
||
Price history
1 event — show timeline
- 2026-06-10 Listed $275,000 WNYREIS
Property tax history
+4.9%/yrLatest (2025): $4,913 · +0.6% YoY. Source: county tax records.
Cash-flow waterfall
monthlySold comps — $/sqft
last 12 mo · ≤1 miLoading sold comps…