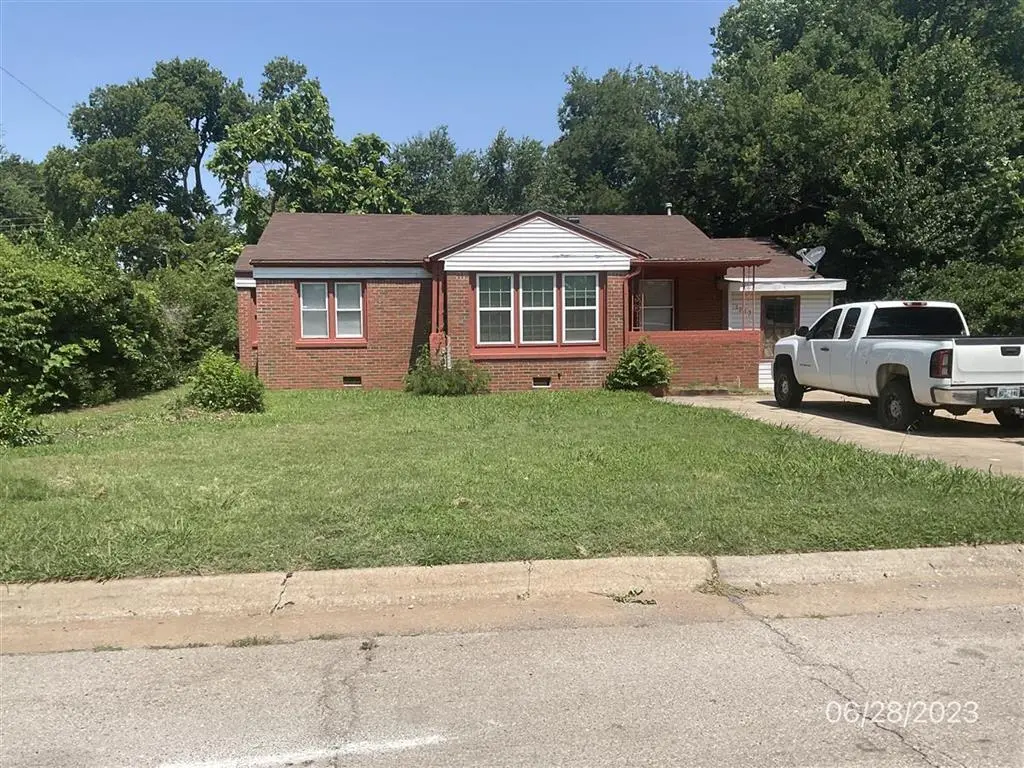
1233 Staton Dr · Oklahoma City, OK
Flood risk 1/10 · Minimal
- FEMA flood zone
- X (unshaded)
- Chance of flooding over 30 yrs
- 0.0%
- Est. flood insurance / yr
- $507 – $1,088
Fire risk 1/10 · Minimal
- Est. fire insurance / yr
- $2,463 – $4,575
Heat risk 6/10 · Moderate
- Hot days now (above 107°F)
- 7 days/yr
- Hot days in 30 yrs
- 19 days/yr
Wind risk 2/10 · Minimal
- Chance of severe wind over 30 yrs
- 3.0%
Air-quality risk 2/10 · Minimal
- Unhealthy air days now
- 1 days/yr
- Unhealthy air days in 30 yrs
- 2 days/yr
Risk factors via First Street. Map © Google.
Why this score? — see what drove the C grade
The composite is a weighted blend of 9 inputs, each scored 0–100. Each bar is that input's sub-score; the figure is the points it added to the 100-point composite (weight × sub-score).
- Cash flow +21.6/30.0
- ARV discount +12.8/15.0
- DSCR +6.9/10.0
- 1% rule +4.8/10.0
- Livability +4.0/5.0
- Rent growth +3.0/5.0
- Condition / age +2.5/5.0
- Schools +0.7/10.0
- Appreciation +0.0/10.0
$120,000
🖨 Deal sheet 📄 Offer letter ✓ Due diligence
Listing remarks MLS
Realtor is related to seller closing at Milestone Title 24 notice to show no sign placed in the yard
Key facts
- 9,718 sq ft lot
- Built 1947
- Listed 220 days
Neighborhood map
What this means for you Summary
Snapshot
- This is a 2-bed/1.0-bath single-family listed at $120k.
Deal economics
- At list price, monthly cash flow is $182 ($2k/yr) — positive.
- The deal already cash-flows at list — no discount required.
- To meet the 1% rule (rent ≥ 1% of price), the offer needs to be $117k (2.1% below list).
- Recommended offer: $106k (12.0% below list) — sets the bar for market timing.
- Cap rate 8.1% vs local median 3.7% in Oklahoma City — top-decile yield for the area; either an underpriced asset or a hidden risk that comps aren't pricing in. Stress-test before assuming the spread holds.
Location & tenants
- Location reads 80/100 on livability (#3 in OK, #1,635 nationally) — a professional / high-income tenant draw. Strengths: amenities A+, commute A+, cost of living A+; Watch: schools F, crime F.
- Oklahoma City (urban): math 7% / reading 10% proficiency, ranked #254 of 270 in OK (top 94%) — low school quality limits family demand, transient renter base, plan for 1-2y turnover; 82% free/reduced lunch — lower-income household profile, screen leases tightly.
- Market conditions: Rents rising (+2.1%/yr); 81 active listings in the ZIP; 31 comparable units currently listed for rent nearby; rentals at typical pace (median 24d on market — plan ~3-4 weeks tenant-placement turnaround); 45% of comp listings sitting > 30 days — soft ceiling on asking rent; lower-income renter base — watch delinquency; 5,365 units permitted in Oklahoma County in 2024 (569 in 5+ unit buildings).
- This rent runs 35% of the median local income ($40k/yr) — at the standard rent-burdened threshold; future hikes will face affordability resistance.
Forward outlook
- Local home prices are declining (-3.0%/yr); year-one equity from $830 of loan paydown is wiped out by about $4k of value loss. Plan a longer hold.
- Oklahoma County population projected at +41% by 2050 — long-run rental-demand tailwind backs the buy-and-hold thesis.
Negotiation context
- It's been on market 220 days — a 12% lower offer ($106k) is reasonable based on typical stale-listing flexibility.
- 4 sale attempts since 24y ago; this cycle's ask has dropped $75k (38%) from the opening price — seller is motivated, your offer sets the floor, not the list.
- Current owner paid $69k; list at $120k implies a 74% gain — meaningful room to come down on a strong offer.
Risks & watch-outs
- Watch-outs: built in 1947 — expect roof / HVAC / electrical / plumbing capex.
- Climate carrying-cost: extreme-heat days projected 7→19/yr by 2055 (HVAC capex compounding) — expect insurance premiums to compound above CPI over the hold.
Questions for the listing agent
- It's been on market 220 days. Have you received any prior offers? Is the seller open to a 12% concession, seller financing, or rate buy-down credit?
- Built in 1947 — when were the roof, HVAC, electrical panel, plumbing, and water heater last replaced?
- Why hasn't it sold? Are there any deal-killer items the seller is aware of (foundation, flood, title, zoning, code violations)?
- Is there a deadline driving the sale (1031 exchange, divorce, estate, relocation)? That informs how much negotiation room exists.
- Schools are F-rated, which usually means shorter tenancies and higher turnover. Who's the typical renter profile here, and what's been the actual vacancy rate?
- Crime grade is F in this area — have there been break-ins, vandalism, or insurance claims at this property in the last 3 years? What carrier currently insures it and at what premium?
- What's the average days-on-market for RENTAL listings here right now (not sales)? A rising rental-DOM trend means longer vacancies and softer asking-rent achievability than the comps imply.
- What's the recent tenant-quality profile in this submarket — average credit score on applications, eviction rate, late-payment / NSF rate, and stable-employment percentage? A property-management company in the area should have these aggregated.
- How much new for-sale + rental construction is in the pipeline within 1–3 miles? Heavy new supply typically softens prices + rents 12–24 months out; constrained supply supports both.
Investment metrics
- 1% rule
- 0.98% ✗
- Cap rate
- 8.11%
- Cash-on-cash
- 6.48%
- DSCR
- 1.29
- GRM
- 8.5
CMA / ARV
- ARV (median comp)
- $135,923
- List price
- $120,000
- Delta
- -11.71%
- Verdict
- UNDERPRICED
- Comps
- 20 within 1.0 mi
Show comp detail 12 sales within ~0.75 mi
| Address | Dist | Beds/Ba | Sqft | Sold | Price | $/sf | Match |
|---|---|---|---|---|---|---|---|
| 1416 NE 39th St | 0.19mi | 3/1.0 (+1) | 1,036 (+2%) | 7mo | $75,000 | $72 | 77 |
| 1304 NE 43rd St | 0.37mi | 2/1.0 | 1,041 (+2%) | 10mo | $125,000 | $120 | 71 |
| 1225 NE 42nd St | 0.32mi | 2/1.0 | 1,104 (+8%) | 2mo | $82,000 | $74 | 69 |
| 1200 NE 48th St | 0.64mi | 2/1.0 | 1,000 (-2%) | 2mo | $95,000 | $95 | 65 |
| 4146 N Prospect Ave | 0.28mi | 3/1.0 (+1) | 1,118 (+10%) | 1mo | $150,000 | $134 | 65 |
| 846 Marilyn St | 0.57mi | 3/1.0 (+1) | 1,000 (-2%) | 5mo | $68,000 | $68 | 62 |
| 4213 N Lottie Ave | 0.28mi | 3/1.0 (+1) | 1,149 (+13%) | 1mo | $90,000 | $78 | 60 |
| 746 NE 36th St | 0.60mi | 3/2.0 (+1) | 1,052 (+3%) | 3mo | $128,000 | $122 | 55 |
| 3600 Springlake Dr | 0.51mi | 3/1.5 (+1) | 1,090 (+7%) | 3mo | $83,000 | $76 | 55 |
| 929 NE 32nd St | 0.68mi | 2/1.0 | 915 (-10%) | 2mo | $50,000 | $55 | 50 |
| 3512 N Rhode Island Ave | 0.60mi | 3/2.0 (+1) | 944 (-7%) | 7mo | $125,000 | $132 | 45 |
| 736 E Eubanks St | 0.65mi | 3/1.0 (+1) | 1,128 (+11%) | 4mo | $120,000 | $106 | 43 |
Match score weights: distance 35% · size 25% · config 20% · recency 20%. Top-matched comps best support the ARV.
Projected returns pro-forma
-3.0% appreciation · 2.13% rent growth · sell at horizon
- IRR
- -7.3%
- Equity multiple
- 0.73×
- Total profit
- $-8,937
- Equity at exit
- $17,892
- IRR
- 1.3%
- Equity multiple
- 1.09×
- Total profit
- $2,858
- Equity at exit
- $10,375
Cash invested: $33,600 (down + closing). Projections, not guarantees.
Landlord ↔ Tenant lean methodology
- Overall (STATE)
- 83 Strongly Landlord-Friendly
- State Oklahoma
- 83 Strongly Landlord-Friendly · R+20
- County
- — inherits STATE
- City
- — inherits STATE
ZIP-level market 73111
- Home prices YoY
- -13.6%
- Rents YoY
- 2.1%
- Active inventory
- 81
- Price-to-rent
- 8.5×
Monthly cashflow live
- Estimated rent
- $1,175 high interval (Pro) →
- Mortgage (P&I)
- −$629
- Tax from tax record
- −$67 /mo · $808/yr
- Insurance
- −$50
- HOA
- −$0
- Vacancy / Maint / Mgmt
- −$247
- Net cashflow
- $182
Break-even live
UW: 25.0% down · 7.5% · 30yr · 1.5% tax · 5.0% vac · 8.0% maint · 8.0% mgmt
Financing live
Cash to close
- Down payment
- $30,000
- Closing costs
- $3,600
- Reserves months
- —
- Total cash needed
- —
Loan-product check · same deal, 3 products live
Conventional
25% down · 7.5% · 30yr
- Down + closing
- —
- Monthly P&I
- —
- Monthly cashflow
- —
- DSCR
- —
- Eligible?
- —
Personal DTI + credit; lowest rate.
DSCR
20% down · 8.5% · 30yr
- Down + closing
- —
- Monthly P&I
- —
- Monthly cashflow
- —
- DSCR
- —
- Eligible?
- —
No personal income docs; deal must DSCR.
Hard money
10% down · 12.0% · 12mo
- Down + closing
- —
- Monthly P&I
- —
- Monthly cashflow
- —
- DSCR
- —
- Eligible?
- —
Short-term bridge; refi at stabilization.
Rent comps 31 comps
| Address | Beds | Baths | Sqft | Rent | $/sqft | DOM | Units | Dist |
|---|---|---|---|---|---|---|---|---|
| 1216 NE 42nd St Oklahoma City, OK | 2.0 | 1.0 | 1009 | $1,125 | $1.11 | 43d | 1 | 0.29mi |
| 1516 Park Cir Oklahoma City, OK | 3.0 | 1.0 | 1118 | $1,250 | $1.12 | 23d | 1 | 0.33mi |
| 1221 NE 43rd St Oklahoma City, OK | 3.0 | 2.0 | 1282 | $1,435 | $1.12 | 43d | 1 | 0.38mi |
| 846 Marilyn St Oklahoma City, OK | 3.0 | 1.0 | 1000 | $1,049 | $1.05 | 43d | 1 | 0.58mi |
| 1621 NE 33rd St Oklahoma City, OK | 3.0 | 2.0 | 1500 | $1,975 | $1.32 | 43d | 1 | 0.59mi |
| 1701 NE 34th St Oklahoma City, OK | 2.0 | 1.5 | 900 | $1,000 | $1.11 | 43d | 1 | 0.61mi |
| 1515 NE 48th St Oklahoma City, OK | 1.0–2.0 | 1.0–2.0 | 729 | $925 | $1.27 | 23d | 1 | 0.74mi |
| 1825 Meyers Pl Oklahoma City, OK | 3.0 | 1.5 | 1155 | $1,850 | $1.60 | 1d | 1 | 0.76mi |
| 1825 Meyers Pl Oklahoma City, OK | 3.0 | 2.0 | 1155 | $1,850 | $1.60 | 21d | 1 | 0.76mi |
| 1637 Bishop Bobby L Williams Dr Oklahoma City, OK | 2.0 | 1.0 | 820 | $1,150 | $1.40 | 43d | 1 | 0.77mi |
| 1427 NE 28th St Oklahoma City, OK | 1.0 | 1.0 | 876 | $695 | $0.79 | 43d | 1 | 0.86mi |
| 2908 N Fonshill Ave Oklahoma City, OK | 3.0 | 2.0 | 1325 | $1,225 | $0.92 | 43d | 1 | 0.87mi |
| 2709 N Fonshill Ave Oklahoma City, OK | 2.0 | 1.0 | 949 | $1,100 | $1.16 | 23d | 1 | 0.94mi |
| 704 NE 31st St Oklahoma City, OK | 3.0 | 1.0 | 952 | $1,300 | $1.37 | 43d | 1 | 0.94mi |
| 4445 N Lincoln Blvd Oklahoma City, OK | 1.0–2.0 | 1.0–2.0 | 861 | $1,710 | $1.98 | 1d | 42 | 0.94mi |
| 1438 NE 27th St Oklahoma City, OK | 3.0 | 1.0 | 736 | $1,000 | $1.36 | 43d | 1 | 0.95mi |
| 4641 Woodland Blvd Oklahoma City, OK | 2.0 | 1.0 | 820 | $730 | $0.89 | 43d | 1 | 0.99mi |
| 2020 NE 30th St Oklahoma City, OK | 3.0 | 1.0 | 1056 | $1,150 | $1.09 | 43d | 1 | 1.06mi |
| 714 NE 27th St Unit 4 Oklahoma City, OK | 2.0 | 1.0 | 950 | $845 | $0.89 | 23d | 1 | 1.11mi |
| 736 NE 26th St Oklahoma City, OK | 2.0 | 1.0 | 927 | $1,050 | $1.13 | 2d | 1 | 1.15mi |
| 1439 NE 24th St Oklahoma City, OK | 3.0 | 1.0 | 874 | $1,025 | $1.17 | 15d | 1 | 1.19mi |
| 1921 NE 25th St Unit 3 Oklahoma City, OK | 2.0 | 1.0 | 900 | $875 | $0.97 | 19d | 1 | 1.21mi |
| 1904 NE 25th St Oklahoma City, OK | 2.0 | 1.0 | 939 | $950 | $1.01 | 3d | 1 | 1.21mi |
| 1812 NE 24th St Oklahoma City, OK | 3.0 | 1.0 | 1071 | $1,175 | $1.10 | 2d | 1 | 1.22mi |
| 1931 NE 25th St Unit 10 Oklahoma City, OK | 2.0 | 1.0 | 900 | $875 | $0.97 | 23d | 1 | 1.22mi |
| 2312 N Everest Ave Oklahoma City, OK | 3.0 | 1.0 | 1100 | $1,299 | $1.18 | 43d | 1 | 1.27mi |
| 1401 NE 22nd St Oklahoma City, OK | 2.0 | 1.0 | 728 | $1,100 | $1.51 | 23d | 1 | 1.29mi |
| 2225 Glen Ellyn St Oklahoma City, OK | 2.0 | 1.0 | 1095 | $925 | $0.84 | 43d | 1 | 1.30mi |
| 215 NE 28th St Oklahoma City, OK | 2.0 | 1.0–2.0 | 694 | $1,289 | $1.86 | 1d | 10 | 1.32mi |
| 2148 N Stonewall Ave Oklahoma City, OK | 2.0 | 1.0 | 1055 | $875 | $0.83 | 3d | 1 | 1.37mi |
| 2128 N Stonewall Ave Unit 1 Oklahoma City, OK | 2.0 | 1.0 | 960 | $800 | $0.83 | 2d | 1 | 1.42mi |
Listing history 24 events
-
2026-06-18days on market $120,000 Active 220 DOM
-
2026-06-17days on market $120,000 Active 219 DOM
-
2026-06-16days on market $120,000 Active 218 DOM
-
2026-06-15days on market $120,000 Active 217 DOM
-
2026-06-13days on market $120,000 Active 215 DOM
-
2026-06-09days on market $120,000 Active 211 DOM
-
2026-06-08days on market $120,000 Active 210 DOM
-
2026-06-07days on market $120,000 Active 209 DOM
-
2026-06-05days on market $120,000 Active 206 DOM
-
2026-06-03days on market $120,000 Active 205 DOM
-
2026-06-02days on market $120,000 Active 204 DOM
-
2026-06-01days on market $120,000 Active 203 DOM
-
2026-05-31days on market $120,000 Active 202 DOM
-
2026-04-04price $120,000 100-char remark
Show marketing remark (100 chars)
Realtor is related to seller closing at Milestone Title 24 notice to show no sign placed in the yard
-
2026-02-25price $160,000 100-char remark
Show marketing remark (100 chars)
Realtor is related to seller closing at Milestone Title 24 notice to show no sign placed in the yard
-
2025-11-10$195,000 Active 100-char remark
Show marketing remark (100 chars)
Realtor is related to seller closing at Milestone Title 24 notice to show no sign placed in the yard
-
2010-10-01historical
-
2010-02-28historical
-
2009-09-07$70,000
-
2008-04-18$70,000
-
2006-11-22soldstatus $69,000
-
2002-12-06soldstatus $18,000
-
2002-11-29soldstatus $24,900
-
2002-10-01$24,900
ⓘ Source: listings_history table (triggers on properties + properties_extension) + one-shot
backfill from property_details.listing_events for pre-trigger history.
Tax reassessment forecast OK · Resets to sale price
- Current annual tax
- $808 · $67/mo
- Projected year-2 tax
- $1,080 · $90/mo
- Expected delta
- +$272/yr (+$23/mo · 33.6%)
ⓘ Screening estimate from a state-policy table — verify with the county assessor before closing.
Climate risk First Street
- Flood 1/10 Low FEMA zone X (unshaded) · 0% chance over 30 yrs
- Wildfire 1/10 Low
- Heat 6/10 Major 7 d/yr ≥107°F today · 19 d/yr by 30 yrs out
- Wind 2/10 Low 3% chance of damaging wind over 30 yrs
- Air quality 2/10 Low 1 unhealthy d/yr today · 2 by 30 yrs out
Nearby sold comps map
Loading sold comps map…
Walkable amenities ~0.75 mi
Loading nearby amenities…
Taxation est. · year 1
- Rental income
- $14,099
- − Mortgage interest
- −$6,722
- − Property taxes
- −$808
- − Insurance
- −$600
- − Repairs & maintenance
- −$1,128
- − Management
- −$1,128
- − Depreciation
- −$3,491
- Taxable income
- $222
- Est. tax owed @ 24.0%
- −$53
- After-tax cash flow
- $2,125/yr
For passive investors: Depreciation is non-cash, so a rental often shows a tax loss while cash-flowing — sheltering income. Rental losses are passive: they offset passive income freely, and up to $25,000/yr can offset ordinary (W-2) income if you actively participate and your MAGI is under $100k (phasing out to $0 by $150k); unused losses carry forward. On sale, claimed depreciation is recaptured at up to 25%, and gains may owe capital-gains tax (a 1031 exchange can defer both). Figures are a year-1 estimate at your 24.0% rate — not tax advice; consult a CPA.
Schools (NCES district)
- District
- Oklahoma City
- NCES district ID
- 4022770
- Math proficiency
- 7% ▼ -5.00%
- Reading proficiency
- 10% ▼ -6.00%
- Median HH income
- $35,606
- Composite
- 7.0/100
- National rank
- #9970
- State rank
- #254 of 270 in OK
Livability — Oklahoma City
- Score
- 80/100
- State rank
- #3
- US rank
- #1635
Category grades
Schools grade is shown separately in the Schools card above.
Census & demographics
- Census place
- Oklahoma City, OK
- County
- Oklahoma County · 771,644 people
- City population
- 498,656
- Metro
- Oklahoma City, OK
- Population (ZIP)
- 10,727
- Household income
- $40,340
- Rent vs Own
- Severe rent burden
- 804.0
Population outlook (Oklahoma County) Hauer SSP2
- Today (2025)
- 911,875 people
- By 2030
- 982,413 · +7.7%
- By 2040
- 1,130,468 · +24.0%
- By 2050
- 1,288,422 · +41.3%
- By 2075
- 1,711,482 · +87.7%
- By 2100
- 2,088,448 · +129.0%
Race, ethnicity, and origin ACS 2023
- Neighborhood character
- Predominantly Black (76%)
- Race & ethnicity
- Black 76% White 13% Two or more races 7% Hispanic / Latino 6% Native American 2%
- Hispanic origin (detail)
- Mexican 4%
- Foreign-born
- 2% · Canada
- Languages at home
- 94% English-only · Spanish 6%
Political lean MEDSL · Oklahoma
- 2024 margin
- Toss-up / Even · D 48.0% · R 49.7% · Other 2.3%
- 2008→2024 swing
- +15.1pp toward D · 2008: -16.8pp · 2024: -1.7pp
- All cycles
- 2024: R+1.7 2020: R+1.1 2016: R+10.5 2012: R+16.7 2008: R+16.8
Not yet ingested
- Civics
- —
Market trends
- HPI YoY
- ▼ -34.64%
- Current HPI
- 220.6395
- Rent YoY
- ▲ 2.13%
- Metro
- Oklahoma City, OK
- State GDP YoY
- ▲ 1.55%
- F500 in state
- 6
Industry mix (Fortune 500 HQ in OK)
| Industry | F500 HQs | Revenue |
|---|---|---|
| Energy | 3 | $48B |
|
||
Price history
+381.9% since first listed11 events — show timeline
- 2026-04-04 Price Changed $120,000 MLSOK
- 2026-02-25 Price Changed $160,000 MLSOK
- 2025-11-10 Listed $195,000 MLSOK
- 2010-10-01 Listing Removed — MLSOK
- 2010-02-28 Listing Removed — MLSOK
- 2009-09-07 Listed $70,000 MLSOK
- 2008-04-18 Listed $70,000 MLSOK
- 2006-11-22 Sold (Public Records) $69,000 Public Records
- 2002-12-06 Sold (Public Records) $18,000 Public Records
- 2002-11-29 Sold (MLS) $24,900 MLSOK
- 2002-10-01 Listed $24,900 MLSOK
Property tax history
+4.4%/yrLatest (2025): $808 · +4.2% YoY. Source: county tax records.
Cash-flow waterfall
monthlySold comps — $/sqft
last 12 mo · ≤1 miLoading sold comps…