2114 Ohio St · Michigan City, IN
Flood risk 6/10 · Moderate
- FEMA flood zone
- X (unshaded)
- Chance of flooding over 30 yrs
- 0.75%
- Est. flood insurance / yr
- $473 – $860
Fire risk 3/10 · Minor
- Est. fire insurance / yr
- $717 – $1,331
Heat risk 3/10 · Minor
- Hot days now (above 99°F)
- 7 days/yr
- Hot days in 30 yrs
- 14 days/yr
Wind risk 2/10 · Minimal
- Chance of severe wind over 30 yrs
- —
Air-quality risk 3/10 · Minor
- Unhealthy air days now
- 2 days/yr
- Unhealthy air days in 30 yrs
- 3 days/yr
Risk factors via First Street. Map © Google.
Why this score? — see what drove the F grade
The composite is a weighted blend of 9 inputs, each scored 0–100. Each bar is that input's sub-score; the figure is the points it added to the 100-point composite (weight × sub-score).
- Cash flow +7.3/30.0
- ARV discount +5.0/15.0
- Rent growth +4.9/5.0
- Livability +4.0/5.0
- Condition / age +2.5/5.0
- Schools +2.2/10.0
- 1% rule +2.0/10.0
- DSCR +1.4/10.0
- Appreciation +0.0/10.0
$159,000
🖨 Deal sheet 📄 Offer letter ✓ Due diligence
Listing remarks
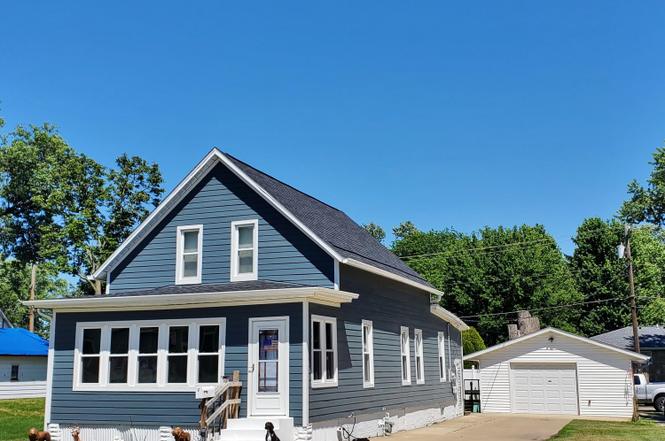
Take a look at this nice 4 bedroom, one and one half story traditional home situated on over two lots and close to everything! All new items include: roof, siding, gutters, windows, storm doors and more. The A/C and furnace are less than 3 years old. The side entrance has steps and a lift chair leading to the enclosed back porch with sliders to decking with new remote-controlled retractable awning. The kitchen includes all appliances and has an attached laundry room and bath with new walk-in shower. The dining and living rooms flow beautifully to compliment today's lifestyles in everyday living and entertaining. The enclosed front porch is perfect for enjoying your morning cup of coffee or
Key facts
- New siding
- New gutters
- New a/c
Tags
Property features AI
Exterior
- Parking: Detached garage with garage door opener; Garage faces front; Driveway; Alley access; Off-street and additional parking
- Utilities: Electricity connected (100 Amp service); Natural gas connected; Public water; Public sewer
- Home design: One and one-half stories; Built in 1900
- Construction: Cement siding; Asphalt roof; Crawl space foundation
- Exterior features: Covered front and rear porch; Deck; Shed(s); Neighborhood view
Interior
- Kitchen: Gas range; Refrigerator
- Bedrooms: Primary bedroom; Bedroom 2; Bedroom 3; Bedroom 4; Total rooms: 10; Laundry room on main level
- Flooring: Carpet; Vinyl
- Bathrooms: One three-quarter bathroom
- Heating & cooling: Forced air heating (natural gas); Central air conditioning
- Interior features: Eat-in kitchen; Accessible approach with ramp; Insulated windows; Storage
- Laundry & utility: Washer; Dryer; Laundry room (main level)
Neighborhood map
What this means for you Summary
Snapshot
- This is a 2-bed/1.0-bath single-family listed at $159k.
Deal economics
- At list price, monthly cash flow is $-215 ($-3k/yr) — negative.
- To cash-flow at today's rent, offer at most $128k (19.5% below list).
- To meet the 1% rule (rent ≥ 1% of price), the offer needs to be $112k (29.6% below list).
- Recommended offer: $112k (29.6% below list) — sets the bar for 1% rule.
- Cap rate 4.7% vs local median 2.7% in Michigan City — top-decile yield for the area; either an underpriced asset or a hidden risk that comps aren't pricing in. Stress-test before assuming the spread holds.
Location & tenants
- Location reads 81/100 on livability (#15 in IN, #1,317 nationally) — a professional / high-income tenant draw. Strengths: commute A+, cost of living A+, housing A+; Watch: employment D, schools D-, amenities D-.
- Michigan City Area Schools (urban): math 23% / reading 28% proficiency, ranked #262 of 301 in IN (top 87%) — low school quality limits family demand, transient renter base, plan for 1-2y turnover; 68% free/reduced lunch — lower-income household profile, screen leases tightly.
- Market conditions: Rents rising fast (+9.7%/yr); 371 active listings in the ZIP; 7 comparable units currently listed for rent nearby; rentals lingering (median 44d on market — plan ~5-8 weeks vacancy on turnover, expect pricing pressure); 100% of comp listings sitting > 30 days — soft ceiling on asking rent; 216 units permitted in LaPorte County in 2024 (75 in 5+ unit buildings).
Forward outlook
- Local home prices are declining (-3.0%/yr); year-one equity from $1k of loan paydown is wiped out by about $5k of value loss. Plan a longer hold.
- LaPorte County population projected to shrink 7% by 2050 — rents likely to lag national; underwrite the cash flow, not the appreciation.
Negotiation context
- Only 4 days on market — expect competitive offers; lowballing is unlikely to land.
Risks & watch-outs
- Watch-outs: built in 1900 — expect roof / HVAC / electrical / plumbing capex.
- Climate carrying-cost: major flood risk — expect insurance premiums to compound above CPI over the hold.
Questions for the listing agent
- What do current leases actually rent for vs. the listed asking? Can we see a recent rent roll and the last 12 months of T-12 income?
- Built in 1900 — when were the roof, HVAC, electrical panel, plumbing, and water heater last replaced?
- Is there a deadline driving the sale (1031 exchange, divorce, estate, relocation)? That informs how much negotiation room exists.
- Schools are D-rated, which usually means shorter tenancies and higher turnover. Who's the typical renter profile here, and what's been the actual vacancy rate?
- The area grade is low — what's the realistic commute time and amenity access for the typical tenant pool here? Any planned neighborhood developments (good or bad) we should know about?
- What's the average days-on-market for RENTAL listings here right now (not sales)? A rising rental-DOM trend means longer vacancies and softer asking-rent achievability than the comps imply.
- What's the recent tenant-quality profile in this submarket — average credit score on applications, eviction rate, late-payment / NSF rate, and stable-employment percentage? A property-management company in the area should have these aggregated.
- How much new for-sale + rental construction is in the pipeline within 1–3 miles? Heavy new supply typically softens prices + rents 12–24 months out; constrained supply supports both.
Investment metrics
- 1% rule
- 0.70% ✗
- Cap rate
- 4.67%
- Cash-on-cash
- -5.78%
- DSCR
- 0.74
- GRM
- 11.8
CMA / ARV
- ARV (on-the-fly)
- $150,480
- Comps found
- 12
Show comp detail 12 sales within ~0.75 mi
| Address | Dist | Beds/Ba | Sqft | Sold | Price | $/sf | Match |
|---|---|---|---|---|---|---|---|
| 2414 Manhattan St | 0.26mi | 3/1.0 (+1) | 840 (-4%) | 1mo | $157,000 | $187 | 75 |
| 108 Roberta Ave | 0.23mi | 3/1.0 (+1) | 936 (+6%) | 6mo | $150,000 | $160 | 68 |
| 701 Indiana Ave | 0.32mi | 3/1.0 (+1) | 936 (+6%) | 10mo | $164,000 | $175 | 61 |
| 1410 Oak St | 0.73mi | 2/1.0 | 905 (+3%) | 5mo | $119,000 | $131 | 57 |
| 720 Hoyt St | 0.29mi | 2/1.5 | 1,008 (+14%) | 6mo | $168,750 | $167 | 56 |
| 309 Redpath Ave | 0.43mi | 3/1.0 (+1) | 988 (+12%) | 1mo | $135,000 | $137 | 54 |
| 310 Beech St | 0.62mi | 3/1.0 (+1) | 960 (+9%) | 0mo | $165,000 | $172 | 51 |
| 338 Southwood Dr | 0.75mi | 3/1.0 (+1) | 924 (+5%) | 2mo | $158,000 | $171 | 50 |
| 631 Donnelly St | 0.70mi | 2/1.0 | 944 (+7%) | 10mo | $148,857 | $158 | 47 |
| 614 Carlon Ct | 0.73mi | 3/1.0 (+1) | 832 (-6%) | 10mo | $158,000 | $190 | 44 |
| 1307 Elston St | 0.47mi | 3/1.0 (+1) | 754 (-14%) | 10mo | $50,000 | $66 | 41 |
| 206 Avalon Ct | 0.69mi | 3/1.0 (+1) | 996 (+13%) | 3mo | $219,900 | $221 | 38 |
Match score weights: distance 35% · size 25% · config 20% · recency 20%. Top-matched comps best support the ARV.
Projected returns pro-forma
-3.0% appreciation · 8.0% rent growth · sell at horizon
- IRR
- -20.8%
- Equity multiple
- 0.25×
- Total profit
- $-33,500
- Equity at exit
- $23,707
- IRR
- -5.7%
- Equity multiple
- 0.56×
- Total profit
- $-19,778
- Equity at exit
- $13,747
Cash invested: $44,520 (down + closing). Projections, not guarantees.
Landlord ↔ Tenant lean methodology
- Overall (STATE)
- 90 Strongly Landlord-Friendly
- State Indiana
- 90 Strongly Landlord-Friendly · R+11
- County
- — inherits STATE
- City
- — inherits STATE
ZIP-level market 46360
- Rents YoY
- 9.7%
- Active inventory
- 371
- Price-to-rent
- 11.8×
Monthly cashflow live
- Estimated rent
- $1,119 high interval (Pro) →
- Mortgage (P&I)
- −$834
- Tax est. 1.5%
- −$199 /mo · $2,385/yr
- Insurance
- −$66
- HOA
- −$0
- Vacancy / Maint / Mgmt
- −$235
- Net cashflow
- $-215
Break-even live
UW: 25.0% down · 7.5% · 30yr · 1.5% tax · 5.0% vac · 8.0% maint · 8.0% mgmt
Financing live
Cash to close
- Down payment
- $39,750
- Closing costs
- $4,770
- Reserves months
- —
- Total cash needed
- —
Loan-product check · same deal, 3 products live
Conventional
25% down · 7.5% · 30yr
- Down + closing
- —
- Monthly P&I
- —
- Monthly cashflow
- —
- DSCR
- —
- Eligible?
- —
Personal DTI + credit; lowest rate.
DSCR
20% down · 8.5% · 30yr
- Down + closing
- —
- Monthly P&I
- —
- Monthly cashflow
- —
- DSCR
- —
- Eligible?
- —
No personal income docs; deal must DSCR.
Hard money
10% down · 12.0% · 12mo
- Down + closing
- —
- Monthly P&I
- —
- Monthly cashflow
- —
- DSCR
- —
- Eligible?
- —
Short-term bridge; refi at stabilization.
Rent comps 7 comps
| Address | Beds | Baths | Sqft | Rent | $/sqft | DOM | Units | Dist |
|---|---|---|---|---|---|---|---|---|
| 106 Ruby Ct Michigan City, IN | 2.0 | 1.0 | 744 | $1,195 | $1.61 | 43d | 1 | 0.36mi |
| 934 Henry St Michigan City, IN | 3.0 | 1.0 | 1100 | $1,250 | $1.14 | 43d | 1 | 0.42mi |
| 1122 Spring St Unit B Michigan City, IN | 1.0 | 1.0 | 750 | $950 | $1.27 | 43d | 1 | 0.85mi |
| 909 Spring St Michigan City, IN | 1.0 | 1.0 | 975 | $955 | $0.98 | 43d | 1 | 0.92mi |
| 221 Barker Rd Michigan City, IN | 1.0 | 1.0 | 737 | $887 | $1.20 | 43d | 2 | 1.25mi |
| 121 S Porter St Unit A Michigan City, IN | 2.0 | 2.0 | 1050 | $925 | $0.88 | 43d | 1 | 1.36mi |
| 3201 Mall Ct Michigan City, IN | 1.0 | 1.0 | 625 | $995 | $1.59 | 43d | 1 | 1.43mi |
Listing history 5 events
-
2026-06-19days on market $159,000 Active 4 DOM
-
2026-06-18days on market $159,000 Active 3 DOM
-
2026-06-17days on market $159,000 Active 2 DOM
-
2026-06-15remarks 699-char remark
-
2026-06-15$159,000 Active 1 DOM
ⓘ Source: listings_history table (triggers on properties + properties_extension) + one-shot
backfill from property_details.listing_events for pre-trigger history.
Climate risk First Street
- Flood 6/10 Major FEMA zone X (unshaded) · 75% chance over 30 yrs
- Wildfire 3/10 Moderate
- Heat 3/10 Moderate 7 d/yr ≥99°F today · 14 d/yr by 30 yrs out
- Wind 2/10 Low
- Air quality 3/10 Moderate 2 unhealthy d/yr today · 3 by 30 yrs out
Nearby sold comps map
Loading sold comps map…
Walkable amenities ~0.75 mi
Loading nearby amenities…
Taxation est. · year 1
- Rental income
- $13,431
- − Mortgage interest
- −$8,906
- − Property taxes
- −$2,385
- − Insurance
- −$795
- − Repairs & maintenance
- −$1,075
- − Management
- −$1,075
- − Depreciation
- −$4,625
- Taxable loss
- −$5,430
- Est. tax savings @ 24.0%
- +$1,303
- After-tax cash flow
- $-1,272/yr
For passive investors: Depreciation is non-cash, so a rental often shows a tax loss while cash-flowing — sheltering income. Rental losses are passive: they offset passive income freely, and up to $25,000/yr can offset ordinary (W-2) income if you actively participate and your MAGI is under $100k (phasing out to $0 by $150k); unused losses carry forward. On sale, claimed depreciation is recaptured at up to 25%, and gains may owe capital-gains tax (a 1031 exchange can defer both). Figures are a year-1 estimate at your 24.0% rate — not tax advice; consult a CPA.
Schools (NCES district)
- District
- Michigan City Area Schools
- NCES district ID
- 1806570
- Math proficiency
- 23% ▼ -16.00%
- Reading proficiency
- 28% ▼ -10.00%
- Median HH income
- $42,629
- Composite
- 21.76/100
- National rank
- #8257
- State rank
- #262 of 301 in IN
Livability — Michigan City
- Score
- 81/100
- State rank
- #15
- US rank
- #1317
Category grades
Schools grade is shown separately in the Schools card above.
Census & demographics
- Census place
- Michigan City, IN
- County
- La Porte County · 88,580 people
- City population
- 43,817
- Metro
- Michigan City-La Porte, IN
- Population (ZIP)
- 43,817
- Household income
- $59,266
- Rent vs Own
- Severe rent burden
- 1152.0
Population outlook (LaPorte County) Hauer SSP2
- Today (2025)
- 109,757 people
- By 2030
- 108,288 · -1.3%
- By 2040
- 105,070 · -4.3%
- By 2050
- 102,330 · -6.8%
- By 2075
- 97,009 · -11.6%
- By 2100
- 86,459 · -21.2%
Race, ethnicity, and origin ACS 2023
- Neighborhood character
- Predominantly White (67%)
- Race & ethnicity
- White 67% Black 20% Hispanic / Latino 8% Two or more races 7%
- Hispanic origin (detail)
- Mexican 5%
- Common ancestry
- Romanian 11% Lithuanian 2% Iranian 1%
- Foreign-born
- 3% · Canada
- Languages at home
- 95% English-only · Spanish 3%
Political lean MEDSL · LaPorte
- 2024 margin
- R (+14.1) · D 42.1% · R 56.2% · Other 1.7%
- 2008→2024 swing
- -19.1pp toward R · 2008: 5.0pp · 2024: -14.1pp
- All cycles
- 2024: R+14.1 2020: R+7.2 2016: R+6.4 2012: D+12.6 2008: D+5.0
Not yet ingested
- Civics
- —
Market trends
- HPI YoY
- ▼ -210.27%
- Current HPI
- 206.0882
- Rent YoY
- ▲ 9.72%
- Metro
- Michigan City-La Porte, IN
- State GDP YoY
- ▲ 2.90%
- F500 in state
- 18
Industry mix (Fortune 500 HQ in IN)
| Industry | F500 HQs | Revenue |
|---|---|---|
| Industrial Machinery | 2 | $37B |
|
||
| Healthcare | 1 | $177B |
|
||
| Pharmaceuticals | 1 | $45B |
|
||
| Metals / Steel | 1 | $18B |
|
||
| Agriculture | 1 | $17B |
|
||
| Packaging | 1 | $12B |
|
||
Price history
1 event — show timeline
- 2026-06-15 Listed $159,000 NIRA MLS as Distributed by MLS Grid
Property tax history
+3.3%/yrLatest (2024): $256 · +217.3% YoY. Source: county tax records.
Cash-flow waterfall
monthlySold comps — $/sqft
last 12 mo · ≤1 miLoading sold comps…