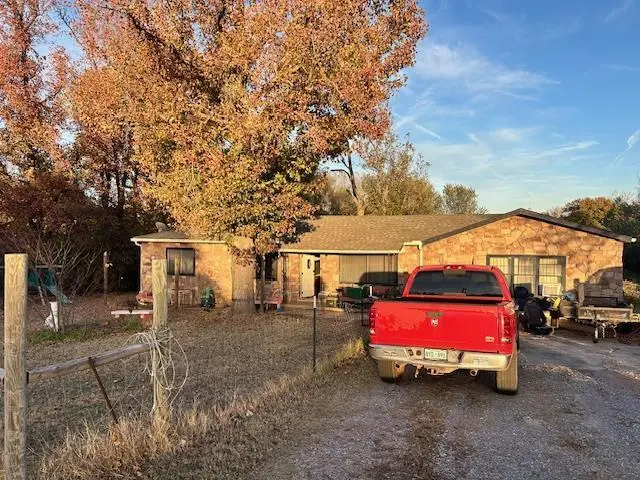
4600 S Harrah Rd · Harrah, OK
Flood risk 9/10 · Severe
- FEMA flood zone
- X (unshaded)
- Chance of flooding over 30 yrs
- 0.99%
- Est. flood insurance / yr
- $507 – $1,088
Fire risk 6/10 · Moderate
- Est. fire insurance / yr
- $2,463 – $4,575
Heat risk 5/10 · Moderate
- Hot days now (above 108°F)
- 7 days/yr
- Hot days in 30 yrs
- 17 days/yr
Wind risk 3/10 · Minor
- Chance of severe wind over 30 yrs
- 6.0%
Air-quality risk 2/10 · Minimal
- Unhealthy air days now
- 0 days/yr
- Unhealthy air days in 30 yrs
- 1 days/yr
Risk factors via First Street. Map © Google.
Why this score? — see what drove the B- grade
The composite is a weighted blend of 9 inputs, each scored 0–100. Each bar is that input's sub-score; the figure is the points it added to the 100-point composite (weight × sub-score).
- Cash flow +26.2/30.0
- ARV discount +15.0/15.0
- DSCR +8.9/10.0
- 1% rule +7.0/10.0
- Livability +3.2/5.0
- Rent growth +2.5/5.0
- Condition / age +2.5/5.0
- Schools +2.4/10.0
- Appreciation +0.0/10.0
$150,000
🖨 Deal sheet 📄 Offer letter ✓ Due diligence
Listing remarks MLS
Sold while processing.
Key facts
- 2.5 acre lot
- Built 1972
Property features AI
Finance
- Other: Property listed as lender approval/short sale; Livestock permitted; Located in Pottawatomie Township
- Financial info: Loan qualification possible; Not assumable
- HOA & community: No mandatory association dues
Exterior
- Home design: Split-level residence; Single-family home; Existing property
- Construction: Frame and masonry veneer construction; Composition roof; Combination foundation; Built (year not provided)
- Exterior features: Covered deck; Outbuildings; Combination fencing; Interior, wooded lot
Interior
- Bedrooms: 3 bedrooms
- Bathrooms: 1 full bathroom
- Interior features: Two living areas; No fireplace
Neighborhood map
What this means for you Summary
Snapshot
- This is a 3-bed/2.0-bath single-family listed at $150k.
Deal economics
- At list price, monthly cash flow is $316 ($4k/yr) — positive.
- The deal already cash-flows at list — no discount required.
- Meets the 1% rule at list price ($2k rent vs $150k).
- Cap rate 9.4% vs local median 4.3% in Harrah — top-decile yield for the area; either an underpriced asset or a hidden risk that comps aren't pricing in. Stress-test before assuming the spread holds.
Location & tenants
- Location reads 64/100 on livability (#163 in OK) — a middle-class / working-renter tenant base. Strengths: cost of living A+, housing A+, crime A-; Watch: amenities F, commute F, health & safety D-.
- Harrah (town): math 24% / reading 29% proficiency, ranked #82 of 270 in OK (top 30%) — low school quality limits family demand, transient renter base, plan for 1-2y turnover.
- Zoned schools: Clara Reynolds Es (math 27% / reading 27%, grade F, #311 of 845 statewide, top 40%, 313 students, 0% FRL); Harrah Hs (math 27% / reading 27%, grade F, #125 of 447 statewide, top 31%, 630 students, 0% FRL) — zoned schools average 0% FRL vs 42% district-wide (42 pts lower); this property's tenant base skews higher-income than the district average.
- Market conditions: 96 active listings in the ZIP; 1 comparable units currently listed for rent nearby; 5,365 units permitted in Oklahoma County in 2024 (569 in 5+ unit buildings).
Forward outlook
- Local home prices are declining (-3.0%/yr); year-one equity from $1k of loan paydown is wiped out by about $4k of value loss. Plan a longer hold.
- Oklahoma County population projected at +41% by 2050 — long-run rental-demand tailwind backs the buy-and-hold thesis.
Negotiation context
- Only 1 days on market — expect competitive offers; lowballing is unlikely to land.
- 7 sale attempts since 27y ago with the ask held roughly flat each time — persistent listings suggest the price (not the market) is what's stuck; bring a comps-based counter.
Risks & watch-outs
- Watch-outs: flood insurance adds $66/mo.
- Climate carrying-cost: severe flood risk; major wildfire risk; extreme-heat days projected 7→17/yr by 2055 (HVAC capex compounding) — expect insurance premiums to compound above CPI over the hold.
Questions for the listing agent
- Built in 1972 — when were the roof, HVAC, electrical panel, plumbing, and water heater last replaced?
- What's the actual annual flood-insurance premium (NFIP or private), and is the property in a SFHA with mandatory coverage?
- Is there a deadline driving the sale (1031 exchange, divorce, estate, relocation)? That informs how much negotiation room exists.
- Schools are D-rated, which usually means shorter tenancies and higher turnover. Who's the typical renter profile here, and what's been the actual vacancy rate?
- What's the average days-on-market for RENTAL listings here right now (not sales)? A rising rental-DOM trend means longer vacancies and softer asking-rent achievability than the comps imply.
- What's the recent tenant-quality profile in this submarket — average credit score on applications, eviction rate, late-payment / NSF rate, and stable-employment percentage? A property-management company in the area should have these aggregated.
- How much new for-sale + rental construction is in the pipeline within 1–3 miles? Heavy new supply typically softens prices + rents 12–24 months out; constrained supply supports both.
Investment metrics
- 1% rule
- 1.20% ✓
- Cap rate
- 9.35%
- Cash-on-cash
- 10.92%
- DSCR
- 1.49
- GRM
- 6.9
CMA / ARV
- ARV (on-the-fly)
- $222,904
- Comps found
- 12
Show comp detail 12 sales within ~0.75 mi
| Address | Dist | Beds/Ba | Sqft | Sold | Price | $/sf | Match |
|---|---|---|---|---|---|---|---|
| 21118 Winding Brk | 0.17mi | 4/2.0 (+1) | 1,518 (+2%) | 1mo | $225,500 | $149 | 84 |
| 4353 Titan Ter | 0.25mi | 3/2.0 | 1,420 (-5%) | 4mo | $222,000 | $156 | 77 |
| 21081 River Mist Dr | 0.56mi | 4/2.0 (+1) | 1,470 (-2%) | 2mo | $222,300 | $151 | 64 |
| 3856 Ada Ave | 0.70mi | 4/2.0 (+1) | 1,470 (-2%) | 1mo | $213,564 | $145 | 59 |
| 4637 Lincoln Lndg | 0.26mi | 4/2.0 (+1) | 1,701 (+14%) | 3mo | $267,496 | $157 | 58 |
| 3865 Ada Ave | 0.73mi | 4/2.0 (+1) | 1,470 (-2%) | 4mo | $227,211 | $155 | 55 |
| 3880 Louthea Ln | 0.59mi | 3/2.0 | 1,633 (+9%) | 3mo | $238,900 | $146 | 55 |
| 3872 Ada Ave | 0.72mi | 3/2.0 | 1,355 (-9%) | 2mo | $215,680 | $159 | 49 |
| 3864 Louthea Ln | 0.62mi | 4/2.0 (+1) | 1,640 (+10%) | 2mo | $225,833 | $138 | 48 |
| 21097 River Mist Dr | 0.56mi | 4/2.0 (+1) | 1,640 (+10%) | 5mo | $240,866 | $147 | 48 |
| 3816 Ada Ave | 0.72mi | 3/2.0 | 1,633 (+9%) | 5mo | $231,782 | $142 | 47 |
| 3881 Ada Ave | 0.72mi | 4/2.0 (+1) | 1,640 (+10%) | 2mo | $232,879 | $142 | 44 |
Match score weights: distance 35% · size 25% · config 20% · recency 20%. Top-matched comps best support the ARV.
Projected returns pro-forma
-3.0% appreciation · 3.0% rent growth · sell at horizon
- IRR
- -2.6%
- Equity multiple
- 0.90×
- Total profit
- $-4,130
- Equity at exit
- $22,365
- IRR
- 7.1%
- Equity multiple
- 1.54×
- Total profit
- $22,579
- Equity at exit
- $12,969
Cash invested: $42,000 (down + closing). Projections, not guarantees.
Landlord ↔ Tenant lean methodology
- Overall (STATE)
- 83 Strongly Landlord-Friendly
- State Oklahoma
- 83 Strongly Landlord-Friendly · R+20
- County
- — inherits STATE
- City
- — inherits STATE
ZIP-level market 74857
- Home prices YoY
- -10.6%
- Active inventory
- 96
- Price-to-rent
- 6.9×
Monthly cashflow live
- Estimated rent
- $1,800 medium interval (Pro) →
- Mortgage (P&I)
- −$787
- Tax from tax record
- −$191 /mo · $2,289/yr
- Insurance
- −$62
- Flood insurance flood zone
- −$66 /mo · $798/yr
- HOA
- −$0
- Vacancy / Maint / Mgmt
- −$378
- Net cashflow
- $316
Break-even live
UW: 25.0% down · 7.5% · 30yr · 1.5% tax · 5.0% vac · 8.0% maint · 8.0% mgmt
Financing live
Cash to close
- Down payment
- $37,500
- Closing costs
- $4,500
- Reserves months
- —
- Total cash needed
- —
Loan-product check · same deal, 3 products live
Conventional
25% down · 7.5% · 30yr
- Down + closing
- —
- Monthly P&I
- —
- Monthly cashflow
- —
- DSCR
- —
- Eligible?
- —
Personal DTI + credit; lowest rate.
DSCR
20% down · 8.5% · 30yr
- Down + closing
- —
- Monthly P&I
- —
- Monthly cashflow
- —
- DSCR
- —
- Eligible?
- —
No personal income docs; deal must DSCR.
Hard money
10% down · 12.0% · 12mo
- Down + closing
- —
- Monthly P&I
- —
- Monthly cashflow
- —
- DSCR
- —
- Eligible?
- —
Short-term bridge; refi at stabilization.
Rent comps 1 comps
| Address | Beds | Baths | Sqft | Rent | $/sqft | DOM | Units | Dist |
|---|---|---|---|---|---|---|---|---|
| 4301 Driftwood Dr Harrah, OK | 4.0 | 2.0 | 1723 | $1,800 | $1.04 | 16d | 1 | 0.30mi |
Listing history 17 events
-
2026-04-29status Pending
-
2026-04-29$150,000 Active
-
2026-03-11historical
-
2025-11-12$188,000 Active
-
2021-03-26soldstatus $170,000
-
2021-03-18soldstatus $170,000 Sold 22-char remark
Show marketing remark (22 chars)
Sold while processing.
-
2021-02-03historical 22-char remark
Show marketing remark (22 chars)
Sold while processing.
-
2021-01-30$172,500 22-char remark
Show marketing remark (22 chars)
Sold while processing.
-
2018-08-06historical
-
2018-07-22$115,000 Active
-
2014-03-06soldstatus $113,000
-
2014-03-03soldstatus $112,900
-
2013-03-13$115,000
-
2013-02-01historical
-
2012-11-05$124,900
-
2000-03-24soldstatus $85,000
-
1999-07-15$99,000
ⓘ Source: listings_history table (triggers on properties + properties_extension) + one-shot
backfill from property_details.listing_events for pre-trigger history.
Tax reassessment forecast OK · Resets to sale price
- Current annual tax
- $2,289 · $191/mo
- Projected year-2 tax
- $2,289 · $191/mo
- Expected delta
- $0/yr ($0/mo · 0.0%)
ⓘ Screening estimate from a state-policy table — verify with the county assessor before closing.
Climate risk First Street
- Flood 9/10 Extreme FEMA zone X (unshaded) · 99% chance over 30 yrs
- Wildfire 6/10 Major
- Heat 5/10 Major 7 d/yr ≥108°F today · 17 d/yr by 30 yrs out
- Wind 3/10 Moderate 6% chance of damaging wind over 30 yrs
- Air quality 2/10 Low 0 unhealthy d/yr today · 1 by 30 yrs out
Nearby sold comps map
Loading sold comps map…
Walkable amenities ~0.75 mi
Loading nearby amenities…
Taxation est. · year 1
- Rental income
- $21,600
- − Mortgage interest
- −$8,402
- − Property taxes
- −$2,289
- − Insurance
- −$1,547
- − Repairs & maintenance
- −$1,728
- − Management
- −$1,728
- − Depreciation
- −$4,364
- Taxable income
- $1,542
- Est. tax owed @ 24.0%
- −$370
- After-tax cash flow
- $3,418/yr
For passive investors: Depreciation is non-cash, so a rental often shows a tax loss while cash-flowing — sheltering income. Rental losses are passive: they offset passive income freely, and up to $25,000/yr can offset ordinary (W-2) income if you actively participate and your MAGI is under $100k (phasing out to $0 by $150k); unused losses carry forward. On sale, claimed depreciation is recaptured at up to 25%, and gains may owe capital-gains tax (a 1031 exchange can defer both). Figures are a year-1 estimate at your 24.0% rate — not tax advice; consult a CPA.
Schools (NCES district)
- District
- Harrah
- NCES district ID
- 4013890
- Math proficiency
- 24% ▼ -9.00%
- Reading proficiency
- 29% ▼ -9.00%
- Median HH income
- $52,737
- Composite
- 23.55/100
- National rank
- #7860
- State rank
- #82 of 270 in OK
Livability — Harrah
- Score
- 64/100
- State rank
- #163
- US rank
- #13659
Category grades
Schools grade is shown separately in the Schools card above.
Census & demographics
- City population
- 123,141
- Population (ZIP)
- 9,902
Population outlook (Oklahoma County) Hauer SSP2
- Today (2025)
- 911,875 people
- By 2030
- 982,413 · +7.7%
- By 2040
- 1,130,468 · +24.0%
- By 2050
- 1,288,422 · +41.3%
- By 2075
- 1,711,482 · +87.7%
- By 2100
- 2,088,448 · +129.0%
Race, ethnicity, and origin ACS 2023
- Neighborhood character
- Predominantly White (79%)
- Race & ethnicity
- White 79% Two or more races 9% Native American 8% Hispanic / Latino 4% Black 2%
- Common ancestry
- Slovak 2% Iranian 2% Romanian 1%
- Foreign-born
- 1% · Canada
- Languages at home
- 96% English-only · Spanish 3%
Political lean MEDSL · Oklahoma
- 2024 margin
- Toss-up / Even · D 48.0% · R 49.7% · Other 2.3%
- 2008→2024 swing
- +15.1pp toward D · 2008: -16.8pp · 2024: -1.7pp
- All cycles
- 2024: R+1.7 2020: R+1.1 2016: R+10.5 2012: R+16.7 2008: R+16.8
Not yet ingested
- Civics
- —
Market trends
- HPI YoY
- ▼ -33.83%
- Current HPI
- 284.6727
- Rent YoY
- —
- Metro
- —
- State GDP YoY
- ▲ 1.55%
- F500 in state
- 6
Industry mix (Fortune 500 HQ in OK)
| Industry | F500 HQs | Revenue |
|---|---|---|
| Energy | 3 | $48B |
|
||
Price history
+51.5% since first listed17 events — show timeline
- 2026-04-29 Pending — MLSOK
- 2026-04-29 Listed $150,000 MLSOK
- 2026-03-11 Listing Removed — MLSOK
- 2025-11-12 Listed $188,000 MLSOK
- 2021-03-26 Sold (Public Records) $170,000 Public Records
- 2021-03-18 Sold (MLS) $170,000 MLSOK
- 2021-02-03 Listing Removed — MLSOK
- 2021-01-30 Listed $172,500 MLSOK
- 2018-08-06 Listing Removed — MLSOK
- 2018-07-22 Listed $115,000 MLSOK
- 2014-03-06 Sold (Public Records) $113,000 Public Records
- 2014-03-03 Sold (MLS) $112,900 MLSOK
- 2013-03-13 Listed $115,000 MLSOK
- 2013-02-01 Listing Removed — MLSOK
- 2012-11-05 Listed $124,900 MLSOK
- 2000-03-24 Sold (Public Records) $85,000 Public Records
- 1999-07-15 Listed $99,000 MLSOK
Property tax history
+6.9%/yrLatest (2025): $2,289 · +2.1% YoY. Source: county tax records.
Cash-flow waterfall
monthlySold comps — $/sqft
last 12 mo · ≤1 miLoading sold comps…