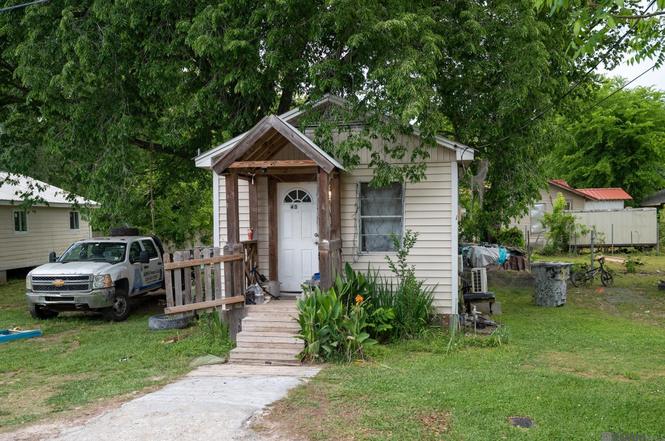
406 W Caroline St · Gonzales, LA
Flood risk 7/10 · Major
- FEMA flood zone
- AE
- Chance of flooding over 30 yrs
- 0.76%
- Est. flood insurance / yr
- $1,737 – $8,500
Fire risk 1/10 · Minimal
- Est. fire insurance / yr
- $1,269 – $2,357
Heat risk 8/10 · Major
- Hot days now (above 108°F)
- 7 days/yr
- Hot days in 30 yrs
- 21 days/yr
Wind risk 9/10 · Severe
- Chance of severe wind over 30 yrs
- 99.0%
Air-quality risk 2/10 · Minimal
- Unhealthy air days now
- 2 days/yr
- Unhealthy air days in 30 yrs
- 2 days/yr
Risk factors via First Street. Map © Google.
Why this score? — see what drove the B grade
The composite is a weighted blend of 9 inputs, each scored 0–100. Each bar is that input's sub-score; the figure is the points it added to the 100-point composite (weight × sub-score).
- Cash flow +30.0/30.0
- 1% rule +10.0/10.0
- DSCR +10.0/10.0
- ARV discount +7.5/15.0
- Schools +4.7/10.0
- Rent growth +3.3/5.0
- Livability +3.2/5.0
- Condition / age +2.5/5.0
- Appreciation +0.0/10.0
$59,900
🖨 Deal sheet 📄 Offer letter ✓ Due diligence
Listing remarks
Small investment property in the city limits of Gonzales has vinyl siding, metal roof and mini split ac system. Home has gas available but no meter. House is leased $150 per week.
Key facts
- Gas available
- Metal roof
- Mini split ac system
Tags
Property features AI
Finance
- Other: Located in the Picard Addition subdivision; Directions: From Airline Hwy/Burnside (LA Hwy 44) cross railroad tracks. At next light take right, then right on W Caroline. Bounding streets: Hwy 44 and W. Caroline
Exterior
- Parking: Open parking
- Utilities: Public water; Public sewer
- Home design: Detached single-family residence; Residential property
- Construction: Vinyl siding; Frame construction; Pillar/post/pier foundation; Built with traditional single-story design
- Exterior features: 50 ft frontage; Lot dimensions approximately 50 x 102
Interior
- Bathrooms: 1 full bathroom
- Heating & cooling: Central heating; Electric heating; Central air conditioning; Additional/other cooling
- Interior features: Central cooling; Additional cooling system (other); Central heating; Electric heating
Neighborhood map
What this means for you Summary
Snapshot
- This is a 1-bed/1.0-bath single-family listed at $60k.
Deal economics
- At list price, monthly cash flow is $75 ($903/yr) — positive.
- The deal already cash-flows at list — no discount required.
- Meets the 1% rule at list price ($1k rent vs $60k).
- Cap rate 16.3% vs local median 4.5% in Gonzales — top-decile yield for the area; either an underpriced asset or a hidden risk that comps aren't pricing in. Stress-test before assuming the spread holds.
Location & tenants
- Location reads 65/100 on livability (#135 in LA) — a middle-class / working-renter tenant base. Strengths: cost of living A+, housing A+; Watch: employment D, crime F, amenities F.
- Ascension Parish (suburban): math 48% / reading 58% proficiency, ranked #7 of 98 in LA (top 7%) — acceptable for families but not a draw, mixed tenant base, ~2y average lease.
- Market conditions: Rents rising (+3.3%/yr); 567 active listings in the ZIP; 1 comparable units currently listed for rent nearby; solid renter incomes; 579 units permitted in Ascension Parish in 2024 (0 in 5+ unit buildings).
- This rent is only 16% of the median local income ($83k/yr) — well below the 30% rent-burden line; pricing power to push rent on renewal without tenant pushback.
Forward outlook
- Local home prices are declining (-3.0%/yr); year-one equity from $414 of loan paydown is wiped out by about $2k of value loss. Plan a longer hold.
- Ascension County population projected at +43% by 2050 — long-run rental-demand tailwind backs the buy-and-hold thesis.
Negotiation context
- Only 3 days on market — expect competitive offers; lowballing is unlikely to land.
- Current owner paid $43k; 39% above their basis — modest negotiation headroom, anchor on the comps not their cost.
Risks & watch-outs
- Watch-outs: flood insurance adds $427/mo.
- Climate carrying-cost: in FEMA flood zone AE (mandatory federal flood insurance); severe wind risk, 99% chance of damaging wind over 30y; extreme-heat days projected 7→21/yr by 2055 (HVAC capex compounding) — expect insurance premiums to compound above CPI over the hold.
Questions for the listing agent
- What's the actual annual flood-insurance premium (NFIP or private), and is the property in a SFHA with mandatory coverage?
- Is there a deadline driving the sale (1031 exchange, divorce, estate, relocation)? That informs how much negotiation room exists.
- Schools are B-rated — typically a magnet for longer-tenancy family renters. What's the average tenant stay here, and is there a school-zone premium baked into asking?
- Crime grade is F in this area — have there been break-ins, vandalism, or insurance claims at this property in the last 3 years? What carrier currently insures it and at what premium?
- What's the average days-on-market for RENTAL listings here right now (not sales)? A rising rental-DOM trend means longer vacancies and softer asking-rent achievability than the comps imply.
- What's the recent tenant-quality profile in this submarket — average credit score on applications, eviction rate, late-payment / NSF rate, and stable-employment percentage? A property-management company in the area should have these aggregated.
- How much new for-sale + rental construction is in the pipeline within 1–3 miles? Heavy new supply typically softens prices + rents 12–24 months out; constrained supply supports both.
Investment metrics
- 1% rule
- 1.89% ✓
- Cap rate
- 16.35%
- Cash-on-cash
- 35.90%
- DSCR
- 2.60
- GRM
- 4.4
CMA / ARV
No comps found within radius.
Projected returns pro-forma
-3.0% appreciation · 3.26% rent growth · sell at horizon
- IRR
- -6.9%
- Equity multiple
- 0.74×
- Total profit
- $-4,349
- Equity at exit
- $8,931
- IRR
- 3.7%
- Equity multiple
- 1.28×
- Total profit
- $4,692
- Equity at exit
- $5,179
Cash invested: $16,772 (down + closing). Projections, not guarantees.
Landlord ↔ Tenant lean methodology
- Overall (STATE)
- 90 Strongly Landlord-Friendly
- State Louisiana
- 90 Strongly Landlord-Friendly · R+12
- County
- — inherits STATE
- City
- — inherits STATE
ZIP-level market 70737
- Rents YoY
- 3.3%
- Active inventory
- 567
- Price-to-rent
- 4.4×
Monthly cashflow live
- Estimated rent
- $1,132 medium interval (Pro) →
- Mortgage (P&I)
- −$314
- Tax from tax record
- −$53 /mo · $639/yr
- Insurance
- −$25
- Flood insurance flood zone
- −$427 /mo · $5,118/yr
- HOA
- −$0
- Vacancy / Maint / Mgmt
- −$238
- Net cashflow
- $75
Break-even live
UW: 25.0% down · 7.5% · 30yr · 1.5% tax · 5.0% vac · 8.0% maint · 8.0% mgmt
Financing live
Cash to close
- Down payment
- $14,975
- Closing costs
- $1,797
- Reserves months
- —
- Total cash needed
- —
Loan-product check · same deal, 3 products live
Conventional
25% down · 7.5% · 30yr
- Down + closing
- —
- Monthly P&I
- —
- Monthly cashflow
- —
- DSCR
- —
- Eligible?
- —
Personal DTI + credit; lowest rate.
DSCR
20% down · 8.5% · 30yr
- Down + closing
- —
- Monthly P&I
- —
- Monthly cashflow
- —
- DSCR
- —
- Eligible?
- —
No personal income docs; deal must DSCR.
Hard money
10% down · 12.0% · 12mo
- Down + closing
- —
- Monthly P&I
- —
- Monthly cashflow
- —
- DSCR
- —
- Eligible?
- —
Short-term bridge; refi at stabilization.
Rent comps 1 comps
| Address | Beds | Baths | Sqft | Rent | $/sqft | DOM | Units | Dist |
|---|---|---|---|---|---|---|---|---|
| 39503 LA-74 Unit 18 Gonzales, LA | 2.0 | 1.0 | 700 | $900 | $1.29 | 14d | 1 | 1.27mi |
Listing history 4 events
-
2026-06-18days on market $59,900 Active 3 DOM
-
2026-06-17days on market $59,900 Active 2 DOM
-
2026-06-15remarks 179-char remark
-
2026-06-15$59,900 Active 1 DOM
ⓘ Source: listings_history table (triggers on properties + properties_extension) + one-shot
backfill from property_details.listing_events for pre-trigger history.
Tax reassessment forecast LA · Resets to sale price
- Current annual tax
- $639 · $53/mo
- Projected year-2 tax
- $639 · $53/mo
- Expected delta
- $0/yr ($0/mo · 0.0%)
ⓘ Screening estimate from a state-policy table — verify with the county assessor before closing.
Climate risk First Street
- Flood 7/10 Severe FEMA zone AE · 76% chance over 30 yrs
- Wildfire 1/10 Low
- Heat 8/10 Severe 7 d/yr ≥108°F today · 21 d/yr by 30 yrs out
- Wind 9/10 Extreme 99% chance of damaging wind over 30 yrs
- Air quality 2/10 Low 2 unhealthy d/yr today · 2 by 30 yrs out
Nearby sold comps map
Loading sold comps map…
Walkable amenities ~0.75 mi
Loading nearby amenities…
Taxation est. · year 1
- Rental income
- $13,583
- − Mortgage interest
- −$3,355
- − Property taxes
- −$639
- − Insurance
- −$5,418
- − Repairs & maintenance
- −$1,087
- − Management
- −$1,087
- − Depreciation
- −$1,743
- Taxable income
- $254
- Est. tax owed @ 24.0%
- −$61
- After-tax cash flow
- $842/yr
For passive investors: Depreciation is non-cash, so a rental often shows a tax loss while cash-flowing — sheltering income. Rental losses are passive: they offset passive income freely, and up to $25,000/yr can offset ordinary (W-2) income if you actively participate and your MAGI is under $100k (phasing out to $0 by $150k); unused losses carry forward. On sale, claimed depreciation is recaptured at up to 25%, and gains may owe capital-gains tax (a 1031 exchange can defer both). Figures are a year-1 estimate at your 24.0% rate — not tax advice; consult a CPA.
Schools (NCES district)
- District
- Ascension Parish
- NCES district ID
- 2200090
- Math proficiency
- 48% ▼ -31.00%
- Reading proficiency
- 58% ▼ -25.00%
- Median HH income
- $68,423
- Composite
- 47.0/100
- National rank
- #2347
- State rank
- #7 of 98 in LA
Livability — Gonzales
- Score
- 65/100
- State rank
- #135
- US rank
- #12429
Category grades
Schools grade is shown separately in the Schools card above.
Census & demographics
- Census place
- Gonzales, LA
- County
- Ascension Parish · 98,362 people
- City population
- 49,084
- Metro
- Baton Rouge, LA
- Population (ZIP)
- 49,084
- Household income
- $82,521
- Rent vs Own
- Severe rent burden
- 863.0
Population outlook (Ascension County) Hauer SSP2
- Today (2025)
- 145,480 people
- By 2030
- 158,329 · +8.8%
- By 2040
- 183,741 · +26.3%
- By 2050
- 207,615 · +42.7%
- By 2075
- 260,244 · +78.9%
- By 2100
- 289,576 · +99.0%
Race, ethnicity, and origin ACS 2023
- Neighborhood character
- Diverse neighborhood (Simpson 0.57)
- Race & ethnicity
- White 59% Black 26% Hispanic / Latino 10% Two or more races 7%
- Hispanic origin (detail)
- Mexican 6%
- Common ancestry
- Lithuanian 15% Serbian 1% Slovak 1%
- Foreign-born
- 7% · Canada
- Languages at home
- 89% English-only · Spanish 9% French/Haitian/Cajun 1% Other Indo-European 1%
Political lean MEDSL · Ascension
- 2024 margin
- Solid R (+34.0) · D 32.2% · R 66.1% · Other 1.7%
- 2008→2024 swing
- +1.7pp toward D · 2008: -35.7pp · 2024: -34.0pp
- All cycles
- 2024: R+34.0 2020: R+32.5 2016: R+36.0 2012: R+34.3 2008: R+35.7
Not yet ingested
- Civics
- —
Market trends
- HPI YoY
- ▼ -89.49%
- Current HPI
- 145.3384
- Rent YoY
- ▲ 3.26%
- Metro
- Baton Rouge, LA
- State GDP YoY
- ▲ 3.29%
- F500 in state
- 10
Industry mix (Fortune 500 HQ in LA)
| Industry | F500 HQs | Revenue |
|---|---|---|
| Telecommunications | 2 | $23B |
|
||
| Utilities | 1 | $12B |
|
||
| Wholesale / Distribution | 1 | $5B |
|
||
| Advertising | 1 | $2B |
|
||
Price history
+199.5% since first listed5 events — show timeline
- 2026-06-14 Listed $59,900 GBRMLS
- 2011-03-24 Sold (Public Records) $43,000 Public Records
- 2008-10-08 Sold (Public Records) $32,000 Public Records
- 2007-12-26 Sold (Public Records) $33,000 Public Records
- 2004-09-29 Sold (Public Records) $20,000 Public Records
Property tax history
+3.5%/yrLatest (2025): $639 · +46.5% YoY. Source: county tax records.
Cash-flow waterfall
monthlySold comps — $/sqft
last 12 mo · ≤1 miLoading sold comps…