671 Lilac Dr · Providence, PA
Flood risk No data
- FEMA flood zone
- —
- Chance of flooding over 30 yrs
- —
- Est. flood insurance / yr
- —
Fire risk No data
- Est. fire insurance / yr
- —
Heat risk No data
- Hot days now (above threshold)
- —
- Hot days in 30 yrs
- —
Wind risk No data
- Chance of severe wind over 30 yrs
- —
Air-quality risk No data
- Unhealthy air days now
- —
- Unhealthy air days in 30 yrs
- —
Risk factors via First Street. Map © Google.
Why this score? — see what drove the B- grade
The composite is a weighted blend of 9 inputs, each scored 0–100. Each bar is that input's sub-score; the figure is the points it added to the 100-point composite (weight × sub-score).
- Cash flow +30.0/30.0
- 1% rule +10.0/10.0
- DSCR +10.0/10.0
- ARV discount +3.9/15.0
- Schools +3.8/10.0
- Rent growth +2.5/5.0
- Livability +2.5/5.0
- Condition / age +2.5/5.0
- Appreciation +0.0/10.0
$97,000
🖨 Deal sheet 📄 Offer letter ✓ Due diligence
Listing remarks MLS
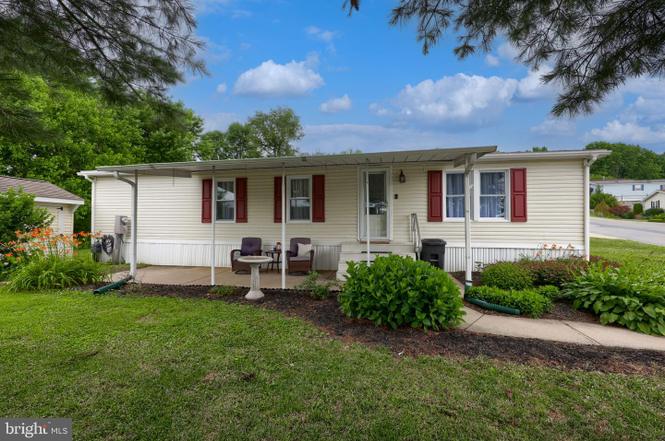
Don't miss this incredible opportunity to own a tastefully renovated 3 bedroom 2 bathroom home in Sunset Estates! As you step inside, you'll notice the abundance of natural light that floods in from the new windows. The kitchen features beautiful tile flooring, new countertops, freshly painted cabinets, and a brand new stove. Back the hallway, you'll find a designated laundry room with lots of extra storage. You'll be impressed with the updated main bathroom and spacious bedrooms with large closets. The primary bedroom boasts a tasteful en-suite featuring a brand new tub/shower. This home also features a brand new furnace and newer roof (2-3 years old). Schedule your appointment today because this one won't last long!
Key facts
- Large tub
- New furnace
- Kitchen counter tops
Tags
Property features AI
Finance
- Other: Not in a federal flood zone
- Financial info: Property manager present; Ownership interest: Ground rent; Annual ground rent noted
- HOA & community: Ground rent exists (paid monthly)
Exterior
- Parking: Driveway
- Utilities: Public water; Public sewer; Electric hot water
- Home design: Manufactured home; Double wide
- Construction: Vinyl siding
- Exterior features: Patio(s); Landscaped lot; Community pool
Interior
- Kitchen: Oven/Range - Gas; Dishwasher
- Bedrooms: 3 bedrooms on main level
- Bathrooms: 2 full bathrooms on main level; 2 full bathrooms total
- Heating & cooling: Forced air heating; Propane (leased) heating fuel; Central air conditioning (electric)
- Interior features: Excellent condition; Water conditioner (owned); No basement
- Laundry & utility: Washer; Dryer
Neighborhood map
What this means for you Summary
Snapshot
- This is a 3-bed/2.0-bath manufactured listed at $97k.
Deal economics
- At list price, monthly cash flow is $650 ($8k/yr) — positive.
- The deal already cash-flows at list — no discount required.
- Meets the 1% rule at list price ($2k rent vs $97k).
Location & tenants
- Location reads: area grade B — affects rentability + tenant quality, not the cash-flow math above.
- Solanco SD (rural): math 31% / reading 57% proficiency, ranked #272 of 539 in PA (top 50%) — families likely to look elsewhere, expect single-tenant / working-renter base with shorter leases.
- Zoned schools: Solanco Hs (math 57% / reading 24%, grade F, #255 of 437 statewide, top 60%, 1,081 students, 35% FRL) — zoned schools at 35% FRL track the district average.
- Market conditions: 25 active listings in the ZIP; 3 comparable units currently listed for rent nearby; rentals at typical pace (median 21d on market — plan ~3-4 weeks tenant-placement turnaround); 1,093 units permitted in Lancaster County in 2024 (201 in 5+ unit buildings).
Forward outlook
- Local home prices are declining (-3.0%/yr); year-one equity from $671 of loan paydown is wiped out by about $3k of value loss. Plan a longer hold.
- Lancaster County population projected at +5% by 2050 — modest demand growth; plan on rents tracking national, not racing it.
- At projected returns (-3.0% appreciation + 3.0% rent growth), your $27k cash investment doubles in ~5 years — after that, you're playing with house money.
Negotiation context
- Only 1 days on market — expect competitive offers; lowballing is unlikely to land.
- 2 sale attempts since 3y ago with the ask held roughly flat each time — persistent listings suggest the price (not the market) is what's stuck; bring a comps-based counter.
- Current owner paid $75k; 29% above their basis — modest negotiation headroom, anchor on the comps not their cost.
Questions for the listing agent
- Is there a deadline driving the sale (1031 exchange, divorce, estate, relocation)? That informs how much negotiation room exists.
- What's the average days-on-market for RENTAL listings here right now (not sales)? A rising rental-DOM trend means longer vacancies and softer asking-rent achievability than the comps imply.
- What's the recent tenant-quality profile in this submarket — average credit score on applications, eviction rate, late-payment / NSF rate, and stable-employment percentage? A property-management company in the area should have these aggregated.
- How much new for-sale + rental construction is in the pipeline within 1–3 miles? Heavy new supply typically softens prices + rents 12–24 months out; constrained supply supports both.
Investment metrics
- 1% rule
- 1.61% ✓
- Cap rate
- 14.33%
- Cash-on-cash
- 28.72%
- DSCR
- 2.28
- GRM
- 5.2
CMA / ARV
- ARV (on-the-fly)
- $89,856
- Comps found
- 1
Show comp detail 1 sale within ~0.75 mi
| Address | Dist | Beds/Ba | Sqft | Sold | Price | $/sf | Match |
|---|---|---|---|---|---|---|---|
| 58 Ridgedale Ave | 0.18mi | 3/2.0 | 980 (-15%) | 14mo | $76,000 | $78 | 56 |
Match score weights: distance 35% · size 25% · config 20% · recency 20%. Top-matched comps best support the ARV.
Projected returns pro-forma
-3.0% appreciation · 3.0% rent growth · sell at horizon
- IRR
- 23.0%
- Equity multiple
- 1.94×
- Total profit
- $25,653
- Equity at exit
- $14,463
- IRR
- 31.0%
- Equity multiple
- 3.78×
- Total profit
- $75,532
- Equity at exit
- $8,387
Cash invested: $27,160 (down + closing). Projections, not guarantees.
Landlord ↔ Tenant lean methodology
- Overall (STATE)
- 62 Landlord-Friendly
- State Pennsylvania
- 62 Landlord-Friendly · EVEN
- County
- — inherits STATE
- City
- — inherits STATE
ZIP-level market 17560
- Home prices YoY
- -15.0%
- Active inventory
- 25
- Price-to-rent
- 5.2×
Monthly cashflow live
- Estimated rent
- $1,565 medium interval (Pro) →
- Mortgage (P&I)
- −$509
- Tax from tax record
- −$38 /mo · $452/yr
- Insurance
- −$40
- HOA
- −$0
- Vacancy / Maint / Mgmt
- −$329
- Net cashflow
- $650
Break-even live
UW: 25.0% down · 7.5% · 30yr · 1.5% tax · 5.0% vac · 8.0% maint · 8.0% mgmt
Financing live
Cash to close
- Down payment
- $24,250
- Closing costs
- $2,910
- Reserves months
- —
- Total cash needed
- —
Loan-product check · same deal, 3 products live
Conventional
25% down · 7.5% · 30yr
- Down + closing
- —
- Monthly P&I
- —
- Monthly cashflow
- —
- DSCR
- —
- Eligible?
- —
Personal DTI + credit; lowest rate.
DSCR
20% down · 8.5% · 30yr
- Down + closing
- —
- Monthly P&I
- —
- Monthly cashflow
- —
- DSCR
- —
- Eligible?
- —
No personal income docs; deal must DSCR.
Hard money
10% down · 12.0% · 12mo
- Down + closing
- —
- Monthly P&I
- —
- Monthly cashflow
- —
- DSCR
- —
- Eligible?
- —
Short-term bridge; refi at stabilization.
Rent comps 3 comps
| Address | Beds | Baths | Sqft | Rent | $/sqft | DOM | Units | Dist |
|---|---|---|---|---|---|---|---|---|
| 309 Groffdale Rd Quarryville, PA | 3.0 | 1.5 | 1232 | $1,600 | $1.30 | 21d | 1 | 0.82mi |
| 405 Groffdale Rd Quarryville, PA | 3.0 | 1.5 | 1176 | $1,700 | $1.45 | 14d | 1 | 0.90mi |
| 115 E State St Apt C Quarryville, PA | 2.0 | 1.0 | 900 | $1,250 | $1.39 | 23d | 1 | 1.32mi |
Listing history 2 events
-
2026-06-18remarks 699-char remark
-
2026-06-18$97,000 Active 1 DOM
ⓘ Source: listings_history table (triggers on properties + properties_extension) + one-shot
backfill from property_details.listing_events for pre-trigger history.
Tax reassessment forecast PA · Partial reset (capped growth)
- Current annual tax
- $452 · $38/mo
- Projected year-2 tax
- $992 · $83/mo
- Expected delta
- +$540/yr (+$45/mo · 119.7%)
ⓘ Screening estimate from a state-policy table — verify with the county assessor before closing.
Nearby sold comps map
Loading sold comps map…
Walkable amenities ~0.75 mi
Loading nearby amenities…
Taxation est. · year 1
- Rental income
- $18,786
- − Mortgage interest
- −$5,434
- − Property taxes
- −$452
- − Insurance
- −$485
- − Repairs & maintenance
- −$1,503
- − Management
- −$1,503
- − Depreciation
- −$2,822
- Taxable income
- $6,588
- Est. tax owed @ 24.0%
- −$1,581
- After-tax cash flow
- $6,219/yr
For passive investors: Depreciation is non-cash, so a rental often shows a tax loss while cash-flowing — sheltering income. Rental losses are passive: they offset passive income freely, and up to $25,000/yr can offset ordinary (W-2) income if you actively participate and your MAGI is under $100k (phasing out to $0 by $150k); unused losses carry forward. On sale, claimed depreciation is recaptured at up to 25%, and gains may owe capital-gains tax (a 1031 exchange can defer both). Figures are a year-1 estimate at your 24.0% rate — not tax advice; consult a CPA.
Schools (NCES district)
- District
- Solanco SD
- NCES district ID
- 4221810
- Math proficiency
- 31% ▼ -10.00%
- Reading proficiency
- 57% ▼ -4.00%
- Median HH income
- $57,326
- Composite
- 38.41/100
- National rank
- #4205
- State rank
- #272 of 539 in PA
Livability — Providence
No livability data for this city. (Only ~50 U.S. cities are tracked.)
Census & demographics
- Population (ZIP)
- 5,452
Population outlook (Lancaster County) Hauer SSP2
- Today (2025)
- 561,011 people
- By 2030
- 570,969 · +1.8%
- By 2040
- 585,929 · +4.4%
- By 2050
- 591,056 · +5.4%
- By 2075
- 594,747 · +6.0%
- By 2100
- 558,850 · -0.4%
Race, ethnicity, and origin ACS 2023
- Neighborhood character
- Predominantly White (92%)
- Race & ethnicity
- White 92% Two or more races 8% Hispanic / Latino 3%
- Common ancestry
- Polish 6% Lithuanian 4% Serbian 2%
- Foreign-born
- 2% · Canada
- Languages at home
- 86% English-only · German/W. Germanic 12% Spanish 2%
Political lean MEDSL · Lancaster
- 2024 margin
- R (+15.9) · D 41.5% · R 57.5%
- 2008→2024 swing
- -4.1pp toward R · 2008: -11.8pp · 2024: -15.9pp
- All cycles
- 2024: R+15.9 2020: R+15.8 2016: R+19.7 2012: R+19.2 2008: R+11.8
Not yet ingested
- Civics
- —
Market trends
- HPI YoY
- ▼ -47.65%
- Current HPI
- 270.262
- Rent YoY
- —
- Metro
- —
- State GDP YoY
- ▲ 1.68%
- F500 in state
- 34
Industry mix (Fortune 500 HQ in PA)
| Industry | F500 HQs | Revenue |
|---|---|---|
| Healthcare | 2 | $309B |
|
||
| Insurance | 2 | $27B |
|
||
| Telecommunications / Media | 1 | $124B |
|
||
| Industrial Distribution | 1 | $22B |
|
||
| Financial Services | 1 | $20B |
|
||
| Chemicals / Materials | 1 | $18B |
|
||
Price history
+42.6% since first listed4 events — show timeline
- 2026-06-18 Listed $97,000 BRIGHT MLS
- 2023-08-30 Sold (MLS) $75,000 BRIGHT MLS
- 2023-07-24 Pending — BRIGHT MLS
- 2023-07-21 Listed $68,000 BRIGHT MLS
Property tax history
-0.8%/yrLatest (2026): $452 · +5.0% YoY. Source: county tax records.
Cash-flow waterfall
monthlySold comps — $/sqft
last 12 mo · ≤1 miLoading sold comps…