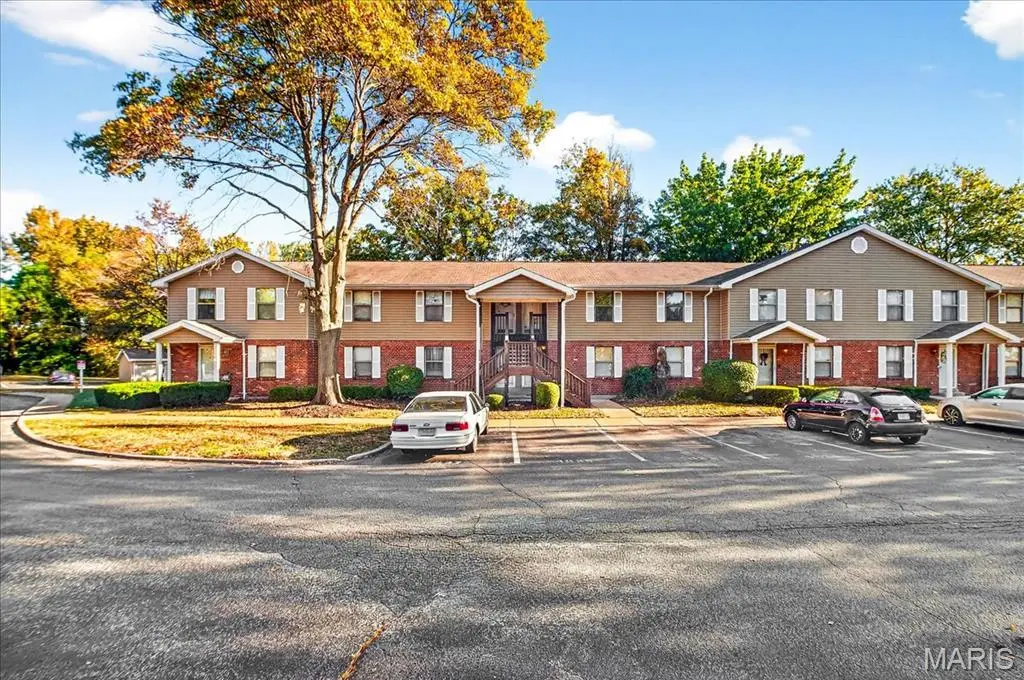
1831 New Sun Ct · Florissant, MO
Flood risk 1/10 · Minimal
- FEMA flood zone
- X (unshaded)
- Chance of flooding over 30 yrs
- 0.0%
- Est. flood insurance / yr
- $473 – $860
Fire risk 1/10 · Minimal
- Est. fire insurance / yr
- $1,054 – $1,958
Heat risk 5/10 · Moderate
- Hot days now (above 106°F)
- 7 days/yr
- Hot days in 30 yrs
- 21 days/yr
Wind risk 2/10 · Minimal
- Chance of severe wind over 30 yrs
- 1.0%
Air-quality risk 3/10 · Minor
- Unhealthy air days now
- 3 days/yr
- Unhealthy air days in 30 yrs
- 5 days/yr
Risk factors via First Street. Map © Google.
Why this score? — see what drove the C+ grade
The composite is a weighted blend of 9 inputs, each scored 0–100. Each bar is that input's sub-score; the figure is the points it added to the 100-point composite (weight × sub-score).
- Cash flow +30.0/30.0
- 1% rule +10.0/10.0
- DSCR +10.0/10.0
- Livability +3.7/5.0
- Rent growth +3.6/5.0
- Condition / age +2.5/5.0
- Schools +1.7/10.0
- ARV discount +1.1/15.0
- Appreciation +0.0/10.0
$84,000
🖨 Deal sheet 📄 Offer letter ✓ Due diligence
Listing remarks MLS
Welcome to this beautifully updated and spacious condo located near the vibrant Sunset Park. Enjoy the peace of mind that this move-in ready unit offers. Upon walking in, you are greeted by the vast open-concept living room/dining room combo that makes gathering with family or friends simple. Following the luxury vinyl flooring throughout the unit, you will find a kitchen equipped with stainless steel appliances replaced in 2023, and countertops in 2024. The TWO bedrooms boast a generous amount of space to make your own. Other updates include washer/dryer (2024), water heater (2022), Furnace (2018), AC (2019). Do not miss the opportunity to appreciate living with ease at 1831 New Sun Ct.
Key facts
- $73 HOA
- Built 1987
- Listed 103 days
Neighborhood map
What this means for you Summary
Snapshot
- This is a 2-bed/1.0-bath condo listed at $84k.
Deal economics
- At list price, monthly cash flow is $577 ($7k/yr) — positive.
- The deal already cash-flows at list — no discount required.
- Meets the 1% rule at list price ($2k rent vs $84k).
- Recommended offer: $76k (9.0% below list) — sets the bar for market timing.
- Cap rate 14.5% vs local median 6.3% in Florissant — top-decile yield for the area; either an underpriced asset or a hidden risk that comps aren't pricing in. Stress-test before assuming the spread holds.
Location & tenants
- Location reads 73/100 on livability (#82 in MO) — a middle-class / working-renter tenant base. Strengths: cost of living A+, housing A+, health & safety B+; Watch: crime C-, amenities D+, schools D.
- Hazelwood (suburban): math 11% / reading 26% proficiency, ranked #306 of 324 in MO (top 94%) — low school quality limits family demand, transient renter base, plan for 1-2y turnover.
- Market conditions: Rents rising fast (+4.3%/yr); 271 active listings in the ZIP; 19 comparable units currently listed for rent nearby; rentals leasing fast (median 13d on market — plan ~1-2 weeks tenant-placement turnaround); 920 units permitted in St. Louis County in 2024 (250 in 5+ unit buildings).
Forward outlook
- Local home prices are declining (-3.0%/yr); year-one equity from $581 of loan paydown is wiped out by about $3k of value loss. Plan a longer hold.
- At projected returns (-3.0% appreciation + 4.3% rent growth), your $24k cash investment doubles in ~4 years — after that, you're playing with house money.
Negotiation context
- It's been on market 104 days — a 9% lower offer ($76k) is reasonable based on typical stale-listing flexibility.
- 6 sale attempts since 13y ago with the ask held roughly flat each time — persistent listings suggest the price (not the market) is what's stuck; bring a comps-based counter.
- Current owner paid $62k; 35% above their basis — modest negotiation headroom, anchor on the comps not their cost.
Risks & watch-outs
- Climate carrying-cost: extreme-heat days projected 7→21/yr by 2055 (HVAC capex compounding) — expect insurance premiums to compound above CPI over the hold.
Questions for the listing agent
- It's been on market 104 days. Have you received any prior offers? Is the seller open to a 9% concession, seller financing, or rate buy-down credit?
- What does the HOA fee cover, when was the last increase, and are there any pending special assessments or reserve-fund shortfalls?
- Any open or pending special assessments — roof, HVAC, plumbing, elevator, façade? What's the per-unit balance and payoff schedule, and is the seller paying it off at close or rolling it to the buyer?
- Why hasn't it sold? Are there any deal-killer items the seller is aware of (foundation, flood, title, zoning, code violations)?
- Is there a deadline driving the sale (1031 exchange, divorce, estate, relocation)? That informs how much negotiation room exists.
- Schools are D-rated, which usually means shorter tenancies and higher turnover. Who's the typical renter profile here, and what's been the actual vacancy rate?
- What's the average days-on-market for RENTAL listings here right now (not sales)? A rising rental-DOM trend means longer vacancies and softer asking-rent achievability than the comps imply.
- What's the recent tenant-quality profile in this submarket — average credit score on applications, eviction rate, late-payment / NSF rate, and stable-employment percentage? A property-management company in the area should have these aggregated.
- How much new apartment / multifamily construction is in the pipeline within 1–3 miles? Heavy new supply (>2% of stock underway) typically softens rents 12–24 months out; light construction supports rent growth.
Investment metrics
- 1% rule
- 1.80% ✓
- Cap rate
- 14.53%
- Cash-on-cash
- 29.42%
- DSCR
- 2.31
- GRM
- 4.6
CMA / ARV
- ARV (median comp)
- $73,514
- List price
- $84,000
- Delta
- 14.26%
- Verdict
- OVERPRICED
- Comps
- 20 within 1.0 mi
Projected returns pro-forma
-3.0% appreciation · 4.27% rent growth · sell at horizon
- IRR
- 25.4%
- Equity multiple
- 2.07×
- Total profit
- $25,120
- Equity at exit
- $12,525
- IRR
- 33.9%
- Equity multiple
- 4.30×
- Total profit
- $77,590
- Equity at exit
- $7,263
Cash invested: $23,520 (down + closing). Projections, not guarantees.
Landlord ↔ Tenant lean methodology
- Overall (STATE)
- 81 Strongly Landlord-Friendly
- State Missouri
- 81 Strongly Landlord-Friendly · R+10
- County
- — inherits STATE
- City
- — inherits STATE
ZIP-level market 63031
- Rents YoY
- 4.3%
- Active inventory
- 271
- Price-to-rent
- 4.6×
Monthly cashflow live
- Estimated rent
- $1,511 high interval (Pro) →
- Mortgage (P&I)
- −$441
- Tax from tax record
- −$69 /mo · $826/yr
- Insurance
- −$35
- HOA
- −$73
- Vacancy / Maint / Mgmt
- −$317
- Net cashflow
- $577
Break-even live
UW: 25.0% down · 7.5% · 30yr · 1.5% tax · 5.0% vac · 8.0% maint · 8.0% mgmt
Financing live
Cash to close
- Down payment
- $21,000
- Closing costs
- $2,520
- Reserves months
- —
- Total cash needed
- —
Loan-product check · same deal, 3 products live
Conventional
25% down · 7.5% · 30yr
- Down + closing
- —
- Monthly P&I
- —
- Monthly cashflow
- —
- DSCR
- —
- Eligible?
- —
Personal DTI + credit; lowest rate.
DSCR
20% down · 8.5% · 30yr
- Down + closing
- —
- Monthly P&I
- —
- Monthly cashflow
- —
- DSCR
- —
- Eligible?
- —
No personal income docs; deal must DSCR.
Hard money
10% down · 12.0% · 12mo
- Down + closing
- —
- Monthly P&I
- —
- Monthly cashflow
- —
- DSCR
- —
- Eligible?
- —
Short-term bridge; refi at stabilization.
Rent comps 19 comps
| Address | Beds | Baths | Sqft | Rent | $/sqft | DOM | Units | Dist |
|---|---|---|---|---|---|---|---|---|
| 2160 Splendor Dr Florissant, MO | 3.0 | 2.0 | 1100 | $1,800 | $1.64 | 3d | 1 | 0.16mi |
| 1902 High Sun Dr Unit 1 Florissant, MO | 1.0 | 1.0 | 795 | $1,035 | $1.30 | 17d | 1 | 0.17mi |
| 1315 Bobolink Dr Florissant, MO | 3.0 | 2.0 | 1025 | $1,700 | $1.66 | 12d | 1 | 0.44mi |
| 1545 Swan Dr Florissant, MO | 3.0 | 1.0 | 1064 | $1,590 | $1.49 | 7d | 1 | 0.45mi |
| 1095 Humes Ln Florissant, MO | 3.0 | 1.5 | 1100 | $1,650 | $1.50 | 4d | 1 | 0.56mi |
| 1540 Aspen Dr Florissant, MO | 3.0 | 2.0 | 912 | $1,395 | $1.53 | 7d | 1 | 0.58mi |
| 1095 Cedar Pl Florissant, MO | 3.0 | 1.5 | 1107 | $1,710 | $1.54 | 1d | 1 | 0.76mi |
| 1015 Lindsay Ln Florissant, MO | 3.0 | 2.0 | 988 | $1,600 | $1.62 | 23d | 1 | 0.96mi |
| 855 Daniel Boone Dr Florissant, MO | 3.0 | 1.0 | 964 | $1,400 | $1.45 | 43d | 1 | 0.97mi |
| 2857 Dawnview Dr Florissant, MO | 3.0 | 1.0 | 890 | $1,325 | $1.49 | 7d | 1 | 0.97mi |
| 840 Dawnview Ct Florissant, MO | 3.0 | 1.5 | 750 | $900 | $1.20 | 23d | 1 | 0.99mi |
| 775 Sherwood Dr Florissant, MO | 3.0 | 1.0 | 1023 | $1,690 | $1.65 | 43d | 1 | 1.02mi |
| 3015 Matlock Dr Florissant, MO | 3.0 | 1.0 | 950 | $1,475 | $1.55 | 43d | 1 | 1.03mi |
| 765 Babler Dr Florissant, MO | 3.0 | 2.0 | 888 | $1,700 | $1.91 | 7d | 1 | 1.06mi |
| 2485 Jenkee Dr Florissant, MO | 3.0 | 1.0 | 960 | $1,376 | $1.43 | 1d | 1 | 1.11mi |
| 2942 Chance Dr Florissant, MO | 3.0 | 1.0 | 912 | $1,700 | $1.86 | 12d | 1 | 1.17mi |
| 470 Hundley Dr Florissant, MO | 3.0 | 2.0 | 962 | $1,595 | $1.66 | 43d | 1 | 1.21mi |
| 4 Sharon Ct Florissant, MO | 3.0 | 2.0 | 1108 | $1,800 | $1.62 | 2d | 1 | 1.24mi |
| 330 Moule Dr Florissant, MO | 3.0 | 1.0 | 1014 | $1,575 | $1.55 | 43d | 1 | 1.32mi |
HOA detail condo
- Monthly dues
- $73 · $876/yr
- Likely covers
- water
- Assessments
- None detected in remarks — confirm with the listing agent.
Listing history 38 events
-
2026-06-18days on market $84,000 Active 104 DOM
-
2026-06-17status $84,000 Active 103 DOM
-
2026-06-17days on market $84,000 Active Under Contract 103 DOM
-
2026-06-16days on market $84,000 Active Under Contract 102 DOM
-
2026-06-15days on market $84,000 Active Under Contract 101 DOM
-
2026-06-13days on market $84,000 Active Under Contract 99 DOM
-
2026-06-13statusdays on market $84,000 Active Under Contract 98 DOM
-
2026-06-09days on market $84,000 Active 95 DOM
-
2026-06-08days on market $84,000 Active 94 DOM
-
2026-06-07days on market $84,000 Active 93 DOM
-
2026-06-05days on market $84,000 Active 90 DOM
-
2026-06-03days on market $84,000 Active 89 DOM
-
2026-06-02days on market $84,000 Active 88 DOM
-
2026-06-01days on market $84,000 Active 87 DOM
-
2026-05-31days on market $84,000 Active 86 DOM
-
2026-03-07$84,000 Active 697-char remark
Show marketing remark (697 chars)
Welcome to this beautifully updated and spacious condo located near the vibrant Sunset Park. Enjoy the peace of mind that this move-in ready unit offers. Upon walking in, you are greeted by the vast open-concept living room/dining room combo that makes gathering with family or friends simple. Following the luxury vinyl flooring throughout the unit, you will find a kitchen equipped with stainless steel appliances replaced in 2023, and countertops in 2024. The TWO bedrooms boast a generous amount of space to make your own. Other updates include washer/dryer (2024), water heater (2022), Furnace (2018), AC (2019). Do not miss the opportunity to appreciate living with ease at 1831 New Sun Ct.
-
2026-03-06historical $84,000 697-char remark
Show marketing remark (697 chars)
Welcome to this beautifully updated and spacious condo located near the vibrant Sunset Park. Enjoy the peace of mind that this move-in ready unit offers. Upon walking in, you are greeted by the vast open-concept living room/dining room combo that makes gathering with family or friends simple. Following the luxury vinyl flooring throughout the unit, you will find a kitchen equipped with stainless steel appliances replaced in 2023, and countertops in 2024. The TWO bedrooms boast a generous amount of space to make your own. Other updates include washer/dryer (2024), water heater (2022), Furnace (2018), AC (2019). Do not miss the opportunity to appreciate living with ease at 1831 New Sun Ct.
-
2025-10-23$90,000 Active
-
2025-10-23historical
-
2024-08-28historical
-
2024-06-27status Active
-
2024-06-24historical
-
2024-06-15historical Active Under Contract
-
2024-05-29price $90,000
-
2024-05-03$95,000 Active
-
2021-06-28soldstatus $62,000
-
2021-06-18soldstatus Closed
-
2021-04-25status Pending
-
2021-04-21price $69,900
-
2021-04-21$60,000 Active
-
2013-05-10soldstatus
-
2013-02-08$34,900
-
2004-10-06soldstatus $67,900
-
2004-03-05soldstatus
-
2002-10-02soldstatus $158,250
-
1995-11-21soldstatus $40,500
-
1987-12-01soldstatus $48,170
-
1987-12-01soldstatus
ⓘ Source: listings_history table (triggers on properties + properties_extension) + one-shot
backfill from property_details.listing_events for pre-trigger history.
Tax reassessment forecast MO · Resets to sale price
- Current annual tax
- $826 · $69/mo
- Projected year-2 tax
- $826 · $69/mo
- Expected delta
- $0/yr ($0/mo · 0.0%)
ⓘ Screening estimate from a state-policy table — verify with the county assessor before closing.
Climate risk First Street
- Flood 1/10 Low FEMA zone X (unshaded) · 0% chance over 30 yrs
- Wildfire 1/10 Low
- Heat 5/10 Major 7 d/yr ≥106°F today · 21 d/yr by 30 yrs out
- Wind 2/10 Low 100% chance of damaging wind over 30 yrs
- Air quality 3/10 Moderate 3 unhealthy d/yr today · 5 by 30 yrs out
Nearby sold comps map
Loading sold comps map…
Walkable amenities ~0.75 mi
Loading nearby amenities…
Taxation est. · year 1
- Rental income
- $18,138
- − Mortgage interest
- −$4,705
- − Property taxes
- −$826
- − Insurance
- −$420
- − Repairs & maintenance
- −$1,451
- − Management
- −$1,451
- − HOA
- −$876
- − Depreciation
- −$2,444
- Taxable income
- $5,964
- Est. tax owed @ 24.0%
- −$1,431
- After-tax cash flow
- $5,489/yr
For passive investors: Depreciation is non-cash, so a rental often shows a tax loss while cash-flowing — sheltering income. Rental losses are passive: they offset passive income freely, and up to $25,000/yr can offset ordinary (W-2) income if you actively participate and your MAGI is under $100k (phasing out to $0 by $150k); unused losses carry forward. On sale, claimed depreciation is recaptured at up to 25%, and gains may owe capital-gains tax (a 1031 exchange can defer both). Figures are a year-1 estimate at your 24.0% rate — not tax advice; consult a CPA.
Schools (NCES district)
- District
- Hazelwood
- NCES district ID
- 2913830
- Math proficiency
- 11% ▼ -13.00%
- Reading proficiency
- 26% ▼ -6.00%
- Median HH income
- $51,621
- Composite
- 16.77/100
- National rank
- #9156
- State rank
- #306 of 324 in MO
Livability — Florissant
- Score
- 73/100
- State rank
- #82
- US rank
- #5406
Category grades
Schools grade is shown separately in the Schools card above.
Census & demographics
- County
- Saint Louis County · 888,823 people
- City population
- 69,104
- Metro
- St. Louis, MO-IL
- Population (ZIP)
- 50,196
- Household income
- $70,811
- Rent vs Own
- Severe rent burden
- 1279.0
Population outlook (St. Louis County) Hauer SSP2
- Today (2025)
- 1,025,227 people
- By 2030
- 1,028,023 · +0.3%
- By 2040
- 1,020,940 · -0.4%
- By 2050
- 1,007,280 · -1.8%
- By 2075
- 987,277 · -3.7%
- By 2100
- 921,984 · -10.1%
Race, ethnicity, and origin ACS 2023
- Neighborhood character
- Diverse neighborhood (Simpson 0.58)
- Race & ethnicity
- White 49% Black 41% Two or more races 7% Hispanic / Latino 2%
- Common ancestry
- Romanian 3% Lithuanian 3% Swedish 1%
- Foreign-born
- 5% · Canada, Jamaica
- Languages at home
- 94% English-only · Spanish 2% Arabic 1%
Political lean MEDSL · St. Louis
- 2024 margin
- Strong D (+23.4) · D 60.8% · R 37.4% · Other 1.7%
- 2008→2024 swing
- +3.5pp toward D · 2008: 19.9pp · 2024: 23.4pp
- All cycles
- 2024: D+23.4 2020: D+24.0 2016: D+16.2 2012: D+13.7 2008: D+19.9
Not yet ingested
- Civics
- —
Market trends
- HPI YoY
- ▼ -223.57%
- Current HPI
- 202.7192
- Rent YoY
- ▲ 4.27%
- Metro
- St. Louis, MO-IL
- State GDP YoY
- ▲ 1.84%
- F500 in state
- 20
Industry mix (Fortune 500 HQ in MO)
| Industry | F500 HQs | Revenue |
|---|---|---|
| Healthcare | 1 | $163B |
|
||
| Insurance | 1 | $21B |
|
||
| Industrial Technology | 1 | $17B |
|
||
| Retail | 1 | $16B |
|
||
| Industrial Distribution | 1 | $10B |
|
||
| Utilities | 1 | $9B |
|
||
Price history
+74.4% since first listed23 events — show timeline
- 2026-03-07 Listed $84,000 MARIS as Distributed by MLS Grid
- 2026-03-06 Coming Soon $84,000 MARIS as Distributed by MLS Grid
- 2025-10-23 Listed $90,000 MARIS as Distributed by MLS Grid
- 2025-10-23 Coming Soon — MARIS as Distributed by MLS Grid
- 2024-08-28 Delisted — MARIS as Distributed by MLS Grid
- 2024-06-27 Relisted — MARIS as Distributed by MLS Grid
- 2024-06-24 Delisted — MARIS as Distributed by MLS Grid
- 2024-06-15 Contingent — MARIS as Distributed by MLS Grid
- 2024-05-29 Price Changed $90,000 MARIS as Distributed by MLS Grid
- 2024-05-03 Listed $95,000 MARIS as Distributed by MLS Grid
- 2021-06-28 Sold (Public Records) $62,000 Public Records
- 2021-06-18 Sold (MLS) — MARIS as Distributed by MLS Grid
- 2021-04-25 Pending — MARIS as Distributed by MLS Grid
- 2021-04-21 Price Changed $69,900 MARIS as Distributed by MLS Grid
- 2021-04-21 Listed $60,000 MARIS as Distributed by MLS Grid
- 2013-05-10 Sold (MLS) — MARIS as Distributed by MLS Grid
- 2013-02-08 Listed $34,900 MARIS as Distributed by MLS Grid
- 2004-10-06 Sold (Public Records) $67,900 Public Records
- 2004-03-05 Sold (Public Records) — Public Records
- 2002-10-02 Sold (Public Records) $158,250 Public Records
- 1995-11-21 Sold (Public Records) $40,500 Public Records
- 1987-12-01 Sold (Public Records) — Public Records
- 1987-12-01 Sold (Public Records) $48,170 Public Records
Property tax history
-1.1%/yrLatest (2022): $826 · +1.5% YoY. Source: county tax records.
Cash-flow waterfall
monthlySold comps — $/sqft
last 12 mo · ≤1 miLoading sold comps…