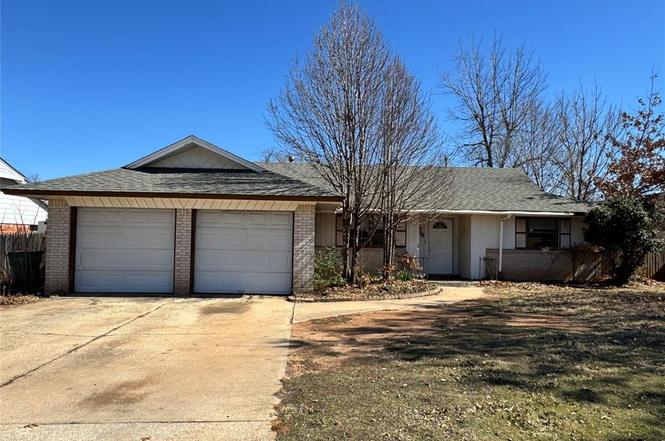
6416 N Nicklas Ave · Oklahoma City, OK
Flood risk 1/10 · Minimal
- FEMA flood zone
- X (unshaded)
- Chance of flooding over 30 yrs
- 0.0%
- Est. flood insurance / yr
- $507 – $1,088
Fire risk 1/10 · Minimal
- Est. fire insurance / yr
- $2,463 – $4,575
Heat risk 6/10 · Moderate
- Hot days now (above 106°F)
- 7 days/yr
- Hot days in 30 yrs
- 19 days/yr
Wind risk 2/10 · Minimal
- Chance of severe wind over 30 yrs
- 2.0%
Air-quality risk 2/10 · Minimal
- Unhealthy air days now
- 1 days/yr
- Unhealthy air days in 30 yrs
- 2 days/yr
Risk factors via First Street. Map © Google.
Why this score? — see what drove the C- grade
The composite is a weighted blend of 9 inputs, each scored 0–100. Each bar is that input's sub-score; the figure is the points it added to the 100-point composite (weight × sub-score).
- Cash flow +15.5/30.0
- ARV discount +15.0/15.0
- DSCR +4.8/10.0
- 1% rule +4.6/10.0
- Livability +4.0/5.0
- Rent growth +2.9/5.0
- Condition / age +2.5/5.0
- Schools +1.3/10.0
- Appreciation +0.0/10.0
$150,000
🖨 Deal sheet (PDF) 📄 Offer letter ✓ Due diligence
Listing remarks
Opportunity is knocking with this 3-bedroom, 1.5-bath home full of potential. Featuring a functional floor plan with spacious living areas and a layout that makes everyday living easy. Situated in a highly desirable location close to shopping, dining, and major conveniences, this home offers the perfect chance for investors, renovators, or buyers looking to build sweat equity. With solid bones and a layout that maximizes space, the possibilities here are endless. * * Multiple Offers Received, Best and Final Due Feb 24th by 8PM, Buyer to make decision On Feb 25th * *
Key facts
- Major conveniences
- Close to dining
- Close to shopping
Tags
Neighborhood map
What this means for you Summary
Snapshot
- This is a 3-bed/2.0-bath single-family listed at $150k.
Deal economics
- At list price, monthly cash flow is $62 ($741/yr) — positive.
- The deal already cash-flows at list — no discount required.
- To meet the 1% rule (rent ≥ 1% of price), the offer needs to be $144k (3.9% below list).
- Recommended offer: $144k (3.9% below list) — sets the bar for 1% rule.
- Cap rate 6.8% vs local median 3.7% in Oklahoma City — top-decile yield for the area; either an underpriced asset or a hidden risk that comps aren't pricing in. Stress-test before assuming the spread holds.
Location & tenants
- Location reads 80/100 on livability (#3 in OK, #1,635 nationally) — a professional / high-income tenant draw. Strengths: amenities A+, commute A+, cost of living A+; Watch: crime F.
- Putnam City (urban): math 12% / reading 16% proficiency, ranked #227 of 270 in OK (top 84%) — low school quality limits family demand, transient renter base, plan for 1-2y turnover; 65% free/reduced lunch — lower-income household profile, screen leases tightly.
- Zoned schools: Rollingwood Es (math 16% / reading 16%, grade F, #582 of 845 statewide, top 69%, 513 students, 0% FRL); James L. Capps Ms (math 9% / reading 18%, grade F, #252 of 345 statewide, top 74%, 975 students, 0% FRL); Putnam City Hs (math 12% / reading 23%, grade F, #307 of 447 statewide, top 69%, 2,014 students, 0% FRL) — zoned schools average 0% FRL vs 65% district-wide (65 pts lower); this property's tenant base skews higher-income than the district average.
- Market conditions: Rents rising (+1.5%/yr); 194 active listings in the ZIP; 30 comparable units currently listed for rent nearby; rentals leasing fast (median 14d on market — plan ~1-2 weeks tenant-placement turnaround); 5,365 units permitted in Oklahoma County in 2024 (569 in 5+ unit buildings).
Forward outlook
- Local home prices are declining (-3.0%/yr); year-one equity from $1k of loan paydown is wiped out by about $4k of value loss. Plan a longer hold.
- Oklahoma County population projected at +41% by 2050 — long-run rental-demand tailwind backs the buy-and-hold thesis.
Negotiation context
- Only 3 days on market — expect competitive offers; lowballing is unlikely to land.
- 10 sale attempts since 22y ago with the ask held roughly flat each time — persistent listings suggest the price (not the market) is what's stuck; bring a comps-based counter.
- Current owner paid $66k; list at $150k implies a 127% gain — meaningful room to come down on a strong offer.
Risks & watch-outs
- Climate carrying-cost: extreme-heat days projected 7→19/yr by 2055 (HVAC capex compounding) — expect insurance premiums to compound above CPI over the hold.
Questions for the listing agent
- Built in 1963 — when were the roof, HVAC, electrical panel, plumbing, and water heater last replaced?
- Is there a deadline driving the sale (1031 exchange, divorce, estate, relocation)? That informs how much negotiation room exists.
- Schools are F-rated, which usually means shorter tenancies and higher turnover. Who's the typical renter profile here, and what's been the actual vacancy rate?
- Crime grade is F in this area — have there been break-ins, vandalism, or insurance claims at this property in the last 3 years? What carrier currently insures it and at what premium?
- What's the average days-on-market for RENTAL listings here right now (not sales)? A rising rental-DOM trend means longer vacancies and softer asking-rent achievability than the comps imply.
- What's the recent tenant-quality profile in this submarket — average credit score on applications, eviction rate, late-payment / NSF rate, and stable-employment percentage? A property-management company in the area should have these aggregated.
- How much new for-sale + rental construction is in the pipeline within 1–3 miles? Heavy new supply typically softens prices + rents 12–24 months out; constrained supply supports both.
Investment metrics
- 1% rule
- 0.96% ✗
- Cap rate
- 6.79%
- Cash-on-cash
- 1.76%
- DSCR
- 1.08
- GRM
- 8.7
CMA / ARV
- ARV (on-the-fly)
- $228,198
- Comps found
- 12
Show comp detail 12 sales within ~0.75 mi
| Address | Dist | Beds/Ba | Sqft | Sold | Price | $/sf | Match |
|---|---|---|---|---|---|---|---|
| 6700 Saint Marys Pl | 0.32mi | 3/2.0 | 1,593 (+2%) | 4mo | $237,400 | $149 | 78 |
| 6104 Kingston Rd | 0.37mi | 4/2.0 (+1) | 1,560 (-0%) | 2mo | $234,900 | $151 | 76 |
| 5421 NW 65th St | 0.44mi | 3/2.0 | 1,532 (-2%) | 3mo | $215,500 | $141 | 74 |
| 4317 NW 61st Ter | 0.45mi | 3/2.0 | 1,574 (+1%) | 5mo | $245,000 | $156 | 74 |
| 4700 NW 59th Ter | 0.42mi | 3/2.5 | 1,528 (-2%) | 3mo | $155,000 | $101 | 72 |
| 6705 N Barr Ave | 0.28mi | 3/2.0 | 1,729 (+11%) | 3mo | $255,000 | $147 | 67 |
| 5824 Harvard Dr | 0.50mi | 3/2.0 | 1,436 (-8%) | 1mo | $175,824 | $122 | 62 |
| 7031 E Cherokee Xing | 0.63mi | 3/2.0 | 1,712 (+10%) | 0mo | $275,000 | $161 | 55 |
| 5408 NW 66th St | 0.41mi | 3/2.0 | 1,334 (-15%) | 3mo | $194,400 | $146 | 54 |
| 4124 NW 61st Ter | 0.65mi | 3/2.0 | 1,680 (+8%) | 5mo | $235,000 | $140 | 53 |
| 5800 N Meridian Pl | 0.57mi | 3/2.0 | 1,744 (+12%) | 5mo | $230,000 | $132 | 50 |
| 4405 NW 59th St | 0.59mi | 4/2.0 (+1) | 1,790 (+14%) | 2mo | $257,000 | $144 | 42 |
Match score weights: distance 35% · size 25% · config 20% · recency 20%. Top-matched comps best support the ARV.
Projected returns pro-forma
-3.0% appreciation · 1.53% rent growth · sell at horizon
- IRR
- -15.2%
- Equity multiple
- 0.47×
- Total profit
- $-22,430
- Equity at exit
- $22,365
- IRR
- -9.4%
- Equity multiple
- 0.46×
- Total profit
- $-22,651
- Equity at exit
- $12,969
Cash invested: $42,000 (down + closing). Projections, not guarantees.
Landlord ↔ Tenant lean methodology
- Overall (STATE)
- 83 Strongly Landlord-Friendly
- State Oklahoma
- 83 Strongly Landlord-Friendly · R+20
- County
- — inherits STATE
- City
- — inherits STATE
ZIP-level market 73132
- Rents YoY
- 1.5%
- Active inventory
- 194
- Price-to-rent
- 8.7×
Monthly cashflow live
- Estimated rent
- $1,442 high interval (Pro) →
- Mortgage (P&I)
- −$787
- Tax from tax record
- −$228 /mo · $2,737/yr
- Insurance
- −$62
- HOA
- −$0
- Vacancy / Maint / Mgmt
- −$303
- Net cashflow
- $62
Break-even live
Sensitivity live
| Price | -10% $147 | -5% $104 | +0% $62 | +5% $19 | +10% $-23 |
|---|---|---|---|---|---|
| Rent | -10% $-52 | -5% $5 | +0% $62 | +5% $119 | +10% $176 |
| Rate | -1.0pp $137 | -0.5pp $100 | base $62 | +0.5pp $23 | +1.0pp $-17 |
UW: 25.0% down · 7.5% · 30yr · 1.5% tax · 5.0% vac · 8.0% maint · 8.0% mgmt
Financing live
Cash to close
- Down payment
- $37,500
- Closing costs
- $4,500
- Reserves months
- —
- Total cash needed
- —
Loan-product check · same deal, 3 products live
Conventional
25% down · 7.5% · 30yr
- Down + closing
- —
- Monthly P&I
- —
- Monthly cashflow
- —
- DSCR
- —
- Eligible?
- —
Personal DTI + credit; lowest rate.
DSCR
20% down · 8.5% · 30yr
- Down + closing
- —
- Monthly P&I
- —
- Monthly cashflow
- —
- DSCR
- —
- Eligible?
- —
No personal income docs; deal must DSCR.
Hard money
10% down · 12.0% · 12mo
- Down + closing
- —
- Monthly P&I
- —
- Monthly cashflow
- —
- DSCR
- —
- Eligible?
- —
Short-term bridge; refi at stabilization.
Rent comps 30 comps
| Address | Beds | Baths | Sqft | Rent | $/sqft | DOM | Units | Dist |
|---|---|---|---|---|---|---|---|---|
| 4707 NW 63rd St Oklahoma City, OK | 2.0 | 2.0 | 1150 | $1,150 | $1.00 | 19d | 1 | 0.16mi |
| 6554 N Meridian Ave #109 Oklahoma City, OK | 2.0 | 2.0 | 1275 | $1,199 | $0.94 | 3d | 1 | 0.23mi |
| 6728 N Meridian Ave Oklahoma City, OK | 2.0 | 2.0 | 1196 | $925 | $0.77 | 25d | 1 | 0.28mi |
| 6100 N Meridian Ave Oklahoma City, OK | 2.0 | 3.0 | 1260 | $1,125 | $0.89 | 25d | 1 | 0.36mi |
| 6020 N Meridian Pl Oklahoma City, OK | 3.0 | 2.0 | 1580 | $1,550 | $0.98 | 13d | 1 | 0.39mi |
| 7020 Labelle Dr Warr Acres, OK | 3.0 | 2.0 | 1365 | $1,845 | $1.35 | 3d | 1 | 0.52mi |
| 7021 Labelle Dr Warr Acres, OK | 3.0 | 2.0 | 1365 | $1,845 | $1.35 | 21d | 1 | 0.53mi |
| 7021 Labelle Dr Warr Acres, OK | 3.0 | 2.0 | 1365 | $1,845 | $1.35 | 17d | 1 | 0.53mi |
| 4727 NW 72nd St Unit 4727 Oklahoma City, OK | 2.0 | 2.0 | 1280 | $2,499 | $1.95 | 3d | 1 | 0.55mi |
| 6505 Cherokee Dr Warr Acres, OK | 3.0 | 1.5 | 1455 | $1,390 | $0.96 | 4d | 1 | 0.56mi |
| 4018 NW 68th St Oklahoma City, OK | 2.0 | 2.0 | 1395 | $1,450 | $1.04 | 25d | 1 | 0.73mi |
| 6913 N Spinnaker Ln Oklahoma City, OK | 3.0 | 2.0 | 2046 | $1,695 | $0.83 | 3d | 1 | 0.74mi |
| 4020 Versailles Blvd Oklahoma City, OK | 2.0–3.0 | 2.0–2.5 | 1500 | $2,070 | $1.38 | 3d | 5 | 0.74mi |
| 5633 Norman Rd Warr Acres, OK | 3.0 | 2.0 | 1225 | $1,375 | $1.12 | 4d | 1 | 0.76mi |
| 3908 NW 68th St Oklahoma City, OK | 3.0 | 2.0 | 1935 | $1,695 | $0.88 | 23d | 1 | 0.83mi |
| 4406 NW 54th St Oklahoma City, OK | 3.0 | 2.0 | 1710 | $1,495 | $0.87 | 25d | 1 | 0.88mi |
| 5304 Willow Cliff Rd Oklahoma City, OK | 3.0 | 3.0 | 1505 | $1,330 | $0.88 | 16d | 1 | 0.99mi |
| 5304 Willow Cliff Rd Oklahoma City, OK | 2.0 | 2.0 | 1060 | $1,086 | $1.02 | 6d | 1 | 0.99mi |
| 5929 NW 62nd St Oklahoma City, OK | 3.0 | 1.0 | 1103 | $1,550 | $1.41 | 4d | 1 | 1.00mi |
| 6103 NW 63rd St Oklahoma City, OK | 3.0 | 2.0 | 1300 | $1,325 | $1.02 | 4d | 1 | 1.10mi |
| 3729 NW 60th St Oklahoma City, OK | 3.0 | 1.5 | 1424 | $1,500 | $1.05 | 21d | 1 | 1.11mi |
| 6419 NW 63rd St Unit 1 Warr Acres, OK | 3.0 | 2.5 | 1748 | $1,425 | $0.82 | 4d | 1 | 1.33mi |
| 6056 Northwest Expy Unit 1 Warr Acres, OK | 2.0 | 1.5 | 1122 | $995 | $0.89 | 25d | 1 | 1.33mi |
| 6054 Northwest Expy Oklahoma City, OK | 2.0 | 1.5 | 1122 | $995 | $0.89 | 25d | 1 | 1.34mi |
| 6004 Northwest Expy Oklahoma City, OK | 3.0 | 2.5 | 1400 | $1,195 | $0.85 | 25d | 1 | 1.36mi |
| 4608 N Libby Ave Warr Acres, OK | 4.0 | 2.0 | 1290 | $1,595 | $1.24 | 4d | 1 | 1.37mi |
| 6066 Northwest Expy Warr Acres, OK | 2.0 | 1.5 | 1122 | $1,145 | $1.02 | 25d | 1 | 1.38mi |
| 5560 N Portland Ave Oklahoma City, OK | 1.0–2.0 | 1.0–2.0 | 955 | $1,249 | $1.31 | 3d | 50 | 1.39mi |
| 7333 Edenborough Dr Oklahoma City, OK | 3.0 | 2.0 | 1993 | $1,950 | $0.98 | 5d | 1 | 1.42mi |
| 7333 Edenborough Dr Oklahoma City, OK | 3.0 | 2.0 | 1993 | $1,895 | $0.95 | 12d | 1 | 1.42mi |
Listing history 20 events
-
2026-02-25status Pending
-
2026-02-22$150,000 Active
-
2026-02-01status Active
-
2026-01-31historical
-
2025-12-25status Active
-
2025-11-15status Active
-
2025-11-01status Active
-
2025-10-09$149,000 Active
-
2022-07-01soldstatus $66,000
-
2007-05-09historical
-
2006-11-26$131,500
-
2006-10-03soldstatus $81,000
-
2006-09-29soldstatus $81,000
-
2006-09-13$95,000
-
2006-09-12historical
-
2006-07-09$95,000
-
2005-08-24historical
-
2004-12-09$96,777
-
1989-04-17soldstatus $63,500
-
1979-06-01soldstatus $59,000
ⓘ Source: listings_history table (triggers on properties + properties_extension) + one-shot
backfill from property_details.listing_events for pre-trigger history.
Tax reassessment forecast OK · Resets to sale price
- Current annual tax
- $2,737 · $228/mo
- Projected year-2 tax
- $2,737 · $228/mo
- Expected delta
- $0/yr ($0/mo · 0.0%)
ⓘ Screening estimate from a state-policy table — verify with the county assessor before closing.
Climate risk First Street
- Flood 1/10 Low FEMA zone X (unshaded) · 0% chance over 30 yrs
- Wildfire 1/10 Low
- Heat 6/10 Major 7 d/yr ≥106°F today · 19 d/yr by 30 yrs out
- Wind 2/10 Low 2% chance of damaging wind over 30 yrs
- Air quality 2/10 Low 1 unhealthy d/yr today · 2 by 30 yrs out
Nearby sold comps map
Loading sold comps map…
Walkable amenities ~0.75 mi
Loading nearby amenities…
Taxation est. · year 1
- Rental income
- $17,300
- − Mortgage interest
- −$8,402
- − Property taxes
- −$2,737
- − Insurance
- −$750
- − Repairs & maintenance
- −$1,384
- − Management
- −$1,384
- − Depreciation
- −$4,364
- Taxable loss
- −$1,721
- Est. tax savings @ 24.0%
- +$413
- After-tax cash flow
- $1,154/yr
For passive investors: Depreciation is non-cash, so a rental often shows a tax loss while cash-flowing — sheltering income. Rental losses are passive: they offset passive income freely, and up to $25,000/yr can offset ordinary (W-2) income if you actively participate and your MAGI is under $100k (phasing out to $0 by $150k); unused losses carry forward. On sale, claimed depreciation is recaptured at up to 25%, and gains may owe capital-gains tax (a 1031 exchange can defer both). Figures are a year-1 estimate at your 24.0% rate — not tax advice; consult a CPA.
Schools (NCES district)
- District
- Putnam City
- NCES district ID
- 4025290
- Math proficiency
- 12% ▼ -18.00%
- Reading proficiency
- 16% ▼ -14.00%
- Median HH income
- $46,657
- Composite
- 12.61/100
- National rank
- #9614
- State rank
- #227 of 270 in OK
Livability — Oklahoma City
- Score
- 80/100
- State rank
- #3
- US rank
- #1635
Category grades
Schools grade is shown separately in the Schools card above.
Census & demographics
- Census place
- Oklahoma City, OK
- County
- Oklahoma County · 771,644 people
- City population
- 498,656
- Metro
- Oklahoma City, OK
- Population (ZIP)
- 27,834
- Household income
- $60,419
- Rent vs Own
- Severe rent burden
- 1610.0
Population outlook (Oklahoma County) Hauer SSP2
- Today (2025)
- 911,875 people
- By 2030
- 982,413 · +7.7%
- By 2040
- 1,130,468 · +24.0%
- By 2050
- 1,288,422 · +41.3%
- By 2075
- 1,711,482 · +87.7%
- By 2100
- 2,088,448 · +129.0%
Race, ethnicity, and origin ACS 2023
- Neighborhood character
- Diverse neighborhood (Simpson 0.68)
- Race & ethnicity
- White 51% Black 17% Hispanic / Latino 16% Two or more races 12% Asian 5% Native American 2%
- Hispanic origin (detail)
- Mexican 10% Puerto Rican 1%
- Common ancestry
- Serbian 2% Slovak 2% Lithuanian 1%
- Foreign-born
- 11% · Canada, Vietnam, Philippines
- Languages at home
- 84% English-only · Spanish 10% Other Asian/Pacific 1% Vietnamese 1%
Political lean MEDSL · Oklahoma
- 2024 margin
- Toss-up / Even · D 48.0% · R 49.7% · Other 2.3%
- 2008→2024 swing
- +15.1pp toward D · 2008: -16.8pp · 2024: -1.7pp
- All cycles
- 2024: R+1.7 2020: R+1.1 2016: R+10.5 2012: R+16.7 2008: R+16.8
Not yet ingested
- Civics
- —
Market trends
- HPI YoY
- ▼ -196.70%
- Current HPI
- 214.9695
- Rent YoY
- ▲ 1.53%
- Metro
- Oklahoma City, OK
- State GDP YoY
- ▲ 1.55%
- F500 in state
- 6
Industry mix (Fortune 500 HQ in OK)
| Industry | F500 HQs | Revenue |
|---|---|---|
| Energy | 3 | $48B |
|
||
Price history
+154.2% since first listed20 events — show timeline
- 2026-02-25 Pending — MLSOK
- 2026-02-22 Listed $150,000 MLSOK
- 2026-02-01 Relisted — MLSOK
- 2026-01-31 Listing Removed — MLSOK
- 2025-12-25 Relisted — MLSOK
- 2025-11-15 Relisted — MLSOK
- 2025-11-01 Relisted — MLSOK
- 2025-10-09 Listed $149,000 MLSOK
- 2022-07-01 Sold (Public Records) $66,000 Public Records
- 2007-05-09 Listing Removed — MLSOK
- 2006-11-26 Listed $131,500 MLSOK
- 2006-10-03 Sold (Public Records) $81,000 Public Records
- 2006-09-29 Sold (MLS) $81,000 MLSOK
- 2006-09-13 Listed $95,000 MLSOK
- 2006-09-12 Listing Removed — MLSOK
- 2006-07-09 Listed $95,000 MLSOK
- 2005-08-24 Listing Removed — MLSOK
- 2004-12-09 Listed $96,777 MLSOK
- 1989-04-17 Sold (Public Records) $63,500 Public Records
- 1979-06-01 Sold (Public Records) $59,000 Public Records
Property tax history
+6.0%/yrLatest (2025): $2,737 · +4.4% YoY. Source: county tax records.
Cash-flow waterfall
monthlySold comps — $/sqft
last 12 mo · ≤1 miLoading sold comps…