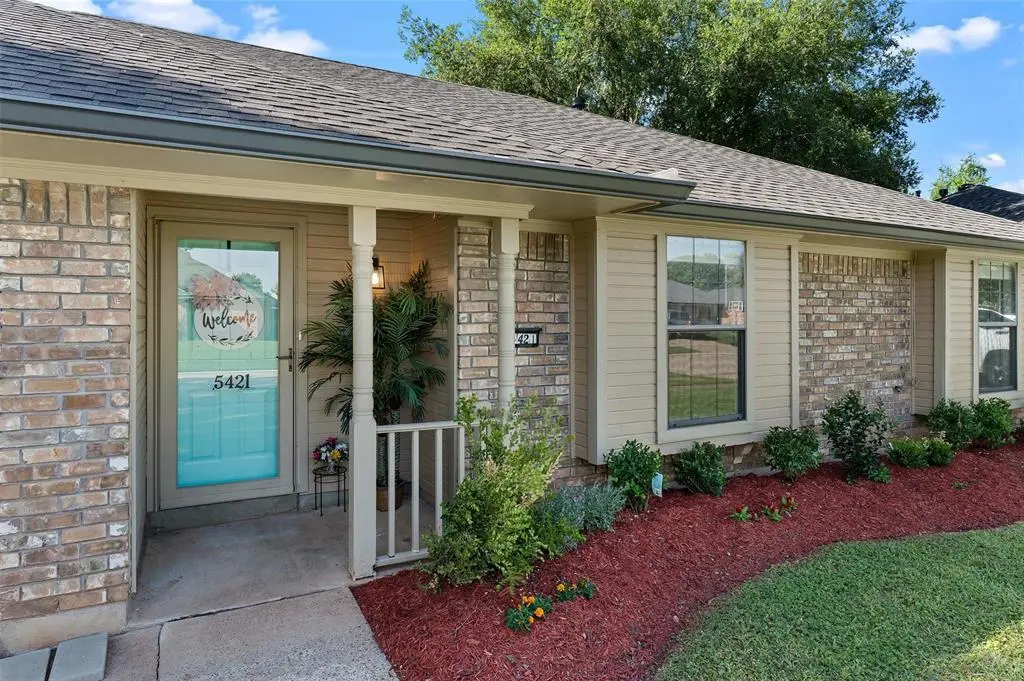
5421 Mulberry Dr · Bossier City, LA
Flood risk 3/10 · Minor
- FEMA flood zone
- X
- Chance of flooding over 30 yrs
- 0.2%
- Est. flood insurance / yr
- $507 – $1,088
Fire risk 3/10 · Minor
- Est. fire insurance / yr
- $1,269 – $2,357
Heat risk 8/10 · Major
- Hot days now (above 110°F)
- 7 days/yr
- Hot days in 30 yrs
- 23 days/yr
Wind risk 6/10 · Moderate
- Chance of severe wind over 30 yrs
- 68.0%
Air-quality risk 2/10 · Minimal
- Unhealthy air days now
- 0 days/yr
- Unhealthy air days in 30 yrs
- 1 days/yr
Risk factors via First Street. Map © Google.
Why this score? — see what drove the D grade
The composite is a weighted blend of 9 inputs, each scored 0–100. Each bar is that input's sub-score; the figure is the points it added to the 100-point composite (weight × sub-score).
- Cash flow +13.2/30.0
- ARV discount +7.2/15.0
- DSCR +4.0/10.0
- Schools +3.8/10.0
- Livability +3.6/5.0
- Rent growth +3.4/5.0
- 1% rule +3.0/10.0
- Condition / age +2.5/5.0
- Appreciation +0.0/10.0
$225,000
🖨 Deal sheet 📄 Offer letter ✓ Due diligence
Listing remarks
Some houses just feel right the moment you walk through the door - and this South Bossier gem is exactly that kind of house. The charming brick exterior and welcoming front entry set the tone before you even step inside. Once you do, the living room opens up in the best way - vaulted ceilings with an exposed wood beam, a soaring stone corner fireplace, and built-in bookshelves that make the whole space feel like it was designed for real life. Whether it's a lazy Sunday morning with coffee or a Friday night with friends, this room sets the mood effortlessly. The kitchen means business. White cabinetry, stone countertops, a classic subway tile backsplash, stainless steel appliances, and stora
Key facts
- 8,925 sq ft lot
- 2 garage spots
- Built 1988
Property features AI
Finance
- Other: Property listed as residential single family; Subdivision: Golden Mdws 10; County: Bossier; Municipal utility district: No
- Financial info: No second mortgage indicated; Loan type treated as clear
- HOA & community: No association (no HOA)
Exterior
- Parking: Attached 2-car garage; 2 covered parking spaces; Off-street parking
- Security: Smoke detectors; Carbon monoxide detectors
- Utilities: City water; City sewer; Electric service available; Natural gas easement; Water lines easement
- Home design: Single family residence; One level; Residential property; Built in 1988; Brick and vinyl siding exterior; Shingle roof
- Construction: Built in 1988; Brick and vinyl siding construction; Shingle roof
- Exterior features: Covered porch; Gutters; Wood fencing; Covered patio/porch
Interior
- Kitchen: Dishwasher; Disposal; Electric range; Microwave; Refrigerator; Other appliances included
- Bedrooms: Primary bedroom on main level; Total of 3 bedrooms
- Flooring: Ceramic tile
- Bathrooms: 2 full bathrooms
- Heating & cooling: Central heating; Central air conditioning; Gas fireplace in living room
- Interior features: Cathedral ceilings; Decorative lighting; Cable TV available; High-speed internet available; Bay window
- Laundry & utility: Utility room; Electric dryer hookup
Neighborhood map
What this means for you Summary
Snapshot
- This is a 3-bed/2.0-bath single-family listed at $225k.
Deal economics
- At list price, monthly cash flow is $-3 ($-30/yr) — negative.
- To cash-flow at today's rent, offer at most $225k (0.2% below list).
- To meet the 1% rule (rent ≥ 1% of price), the offer needs to be $179k (20.2% below list).
- Recommended offer: $179k (20.2% below list) — sets the bar for 1% rule.
- Cap rate 6.3% vs local median 4.7% in Bossier City — top-decile yield for the area; either an underpriced asset or a hidden risk that comps aren't pricing in. Stress-test before assuming the spread holds.
Location & tenants
- Location reads 71/100 on livability (#47 in LA) — a middle-class / working-renter tenant base. Strengths: commute A+, cost of living A+, housing A+; Watch: employment D+, crime F, amenities F.
- Bossier Parish (urban): math 40% / reading 47% proficiency, ranked #17 of 98 in LA (top 17%) — families likely to look elsewhere, expect single-tenant / working-renter base with shorter leases.
- Zoned schools: Bossier Elementary School (math 8% / reading 17%, grade F, #550 of 646 statewide, top 88%, 222 students, 93% FRL) — zoned schools average 93% FRL vs 41% district-wide (52 pts higher); higher-poverty schools than district average — tighter screening recommended.
- Zoned-school proficiency averages 12% at this address vs 44% district-wide (-31 pts) — the specific schools serving this property underperform the Bossier Parish average; the district grade overstates school quality for this exact location.
- Market conditions: Rents rising (+3.6%/yr); 145 active listings in the ZIP; 12 comparable units currently listed for rent nearby; rentals at typical pace (median 21d on market — plan ~3-4 weeks tenant-placement turnaround); 42% of comp listings sitting > 30 days — soft ceiling on asking rent; 716 units permitted in Bossier Parish in 2024 (0 in 5+ unit buildings).
- This rent runs 35% of the median local income ($62k/yr) — at the standard rent-burdened threshold; future hikes will face affordability resistance.
Forward outlook
- Local home prices are declining (-3.0%/yr); year-one equity from $2k of loan paydown is wiped out by about $7k of value loss. Plan a longer hold.
- Bossier County population projected at +28% by 2050 — long-run rental-demand tailwind backs the buy-and-hold thesis.
Negotiation context
- It's been on market 21 days — a 2% lower offer ($222k) is reasonable based on typical stale-listing flexibility.
- Current owner paid $132k; list at $225k implies a 71% gain — meaningful room to come down on a strong offer.
Risks & watch-outs
- Climate carrying-cost: major wind risk, 68% chance of damaging wind over 30y; extreme-heat days projected 7→23/yr by 2055 (HVAC capex compounding) — expect insurance premiums to compound above CPI over the hold.
Questions for the listing agent
- What do current leases actually rent for vs. the listed asking? Can we see a recent rent roll and the last 12 months of T-12 income?
- Is there a deadline driving the sale (1031 exchange, divorce, estate, relocation)? That informs how much negotiation room exists.
- Schools are B-rated — typically a magnet for longer-tenancy family renters. What's the average tenant stay here, and is there a school-zone premium baked into asking?
- Crime grade is F in this area — have there been break-ins, vandalism, or insurance claims at this property in the last 3 years? What carrier currently insures it and at what premium?
- The area grade is low — what's the realistic commute time and amenity access for the typical tenant pool here? Any planned neighborhood developments (good or bad) we should know about?
- What's the average days-on-market for RENTAL listings here right now (not sales)? A rising rental-DOM trend means longer vacancies and softer asking-rent achievability than the comps imply.
- What's the recent tenant-quality profile in this submarket — average credit score on applications, eviction rate, late-payment / NSF rate, and stable-employment percentage? A property-management company in the area should have these aggregated.
- How much new for-sale + rental construction is in the pipeline within 1–3 miles? Heavy new supply typically softens prices + rents 12–24 months out; constrained supply supports both.
Investment metrics
- 1% rule
- 0.80% ✗
- Cap rate
- 6.28%
- Cash-on-cash
- -0.05%
- DSCR
- 1.00
- GRM
- 10.4
CMA / ARV
- ARV (median comp)
- $223,503
- List price
- $225,000
- Delta
- 0.67%
- Verdict
- FAIR
- Comps
- 20 within 1.0 mi
Show comp detail 12 sales within ~0.75 mi
| Address | Dist | Beds/Ba | Sqft | Sold | Price | $/sf | Match |
|---|---|---|---|---|---|---|---|
| 5310 Susanna Dr | 0.15mi | 3/2.0 | 1,307 (+3%) | 7mo | $219,900 | $168 | 83 |
| 5505 Hollyhock Ln | 0.11mi | 3/2.0 | 1,327 (+4%) | 7mo | $214,999 | $162 | 82 |
| 5606 Kristen Ave | 0.22mi | 3/2.0 | 1,326 (+4%) | 3mo | $179,900 | $136 | 81 |
| 5725 Bluebonnett Dr | 0.10mi | 3/2.0 | 1,400 (+10%) | 1mo | $210,000 | $150 | 78 |
| 5018 Ames Pl | 0.41mi | 3/2.0 | 1,285 (+1%) | 3mo | $240,000 | $187 | 76 |
| 5521 E Meadow Dr | 0.34mi | 3/2.0 | 1,216 (-4%) | 1mo | $200,000 | $164 | 76 |
| 5303 Susanna Dr | 0.21mi | 3/2.0 | 1,364 (+7%) | 5mo | $189,900 | $139 | 74 |
| 5005 Ames Pl | 0.37mi | 3/2.0 | 1,330 (+4%) | 3mo | $232,000 | $174 | 73 |
| 5016 Ames Place Pl | 0.44mi | 3/2.0 | 1,330 (+4%) | 0mo | $248,500 | $187 | 72 |
| 5605 James Scott Cir | 0.31mi | 3/2.0 | 1,390 (+9%) | 6mo | $194,900 | $140 | 65 |
| 5214 Lauri Ln | 0.61mi | 2/2.0 (-1) | 1,316 (+3%) | 5mo | $193,500 | $147 | 56 |
| 5302 Iris Cir | 0.50mi | 3/2.0 | 1,402 (+10%) | 6mo | $204,900 | $146 | 55 |
Match score weights: distance 35% · size 25% · config 20% · recency 20%. Top-matched comps best support the ARV.
Projected returns pro-forma
-3.0% appreciation · 3.6% rent growth · sell at horizon
- IRR
- -15.8%
- Equity multiple
- 0.44×
- Total profit
- $-35,587
- Equity at exit
- $33,548
- IRR
- -6.5%
- Equity multiple
- 0.57×
- Total profit
- $-26,896
- Equity at exit
- $19,454
Cash invested: $63,000 (down + closing). Projections, not guarantees.
Landlord ↔ Tenant lean methodology
- Overall (STATE)
- 90 Strongly Landlord-Friendly
- State Louisiana
- 90 Strongly Landlord-Friendly · R+12
- County
- — inherits STATE
- City
- — inherits STATE
ZIP-level market 71112
- Rents YoY
- 3.6%
- Active inventory
- 145
- Price-to-rent
- 10.4×
Monthly cashflow live
- Estimated rent
- $1,794 high interval (Pro) →
- Mortgage (P&I)
- −$1,180
- Tax from tax record
- −$146 /mo · $1,758/yr
- Insurance
- −$94
- HOA
- −$0
- Vacancy / Maint / Mgmt
- −$377
- Net cashflow
- $-3
Break-even live
UW: 25.0% down · 7.5% · 30yr · 1.5% tax · 5.0% vac · 8.0% maint · 8.0% mgmt
Financing live
Cash to close
- Down payment
- $56,250
- Closing costs
- $6,750
- Reserves months
- —
- Total cash needed
- —
Loan-product check · same deal, 3 products live
Conventional
25% down · 7.5% · 30yr
- Down + closing
- —
- Monthly P&I
- —
- Monthly cashflow
- —
- DSCR
- —
- Eligible?
- —
Personal DTI + credit; lowest rate.
DSCR
20% down · 8.5% · 30yr
- Down + closing
- —
- Monthly P&I
- —
- Monthly cashflow
- —
- DSCR
- —
- Eligible?
- —
No personal income docs; deal must DSCR.
Hard money
10% down · 12.0% · 12mo
- Down + closing
- —
- Monthly P&I
- —
- Monthly cashflow
- —
- DSCR
- —
- Eligible?
- —
Short-term bridge; refi at stabilization.
Rent comps 12 comps
| Address | Beds | Baths | Sqft | Rent | $/sqft | DOM | Units | Dist |
|---|---|---|---|---|---|---|---|---|
| 5415 Bayou Dr Bossier City, LA | 3.0 | 2.0 | 1800 | $1,700 | $0.94 | 20d | 1 | 0.23mi |
| 5403 Bayou Dr Bossier City, LA | 3.0 | 2.0 | 1786 | $1,800 | $1.01 | 13d | 1 | 0.30mi |
| 5410 Mary Dr Bossier City, LA | 3.0 | 2.0 | 1345 | $1,650 | $1.23 | 43d | 1 | 0.38mi |
| 5814 Gold Crest Dr Bossier City, LA | 4.0 | 2.0 | 1820 | $2,100 | $1.15 | 43d | 1 | 0.55mi |
| 1943 Valdemar Pl Bossier City, LA | 3.0 | 2.0 | 1814 | $2,100 | $1.16 | 13d | 1 | 0.57mi |
| 1801 Andy Cir Bossier City, LA | 3.0 | 2.0 | 1650 | $1,750 | $1.06 | 13d | 1 | 0.59mi |
| 5400 Barksdale Blvd Bossier City, LA | 1.0–3.0 | 1.0–2.0 | 1059 | $1,972 | $1.86 | 13d | 34 | 0.62mi |
| 530 Antietam Dr Bossier City, LA | 3.0 | 2.0 | 1654 | $2,300 | $1.39 | 20d | 1 | 0.75mi |
| 5005 Longstreet Pl #72 Bossier City, LA | 3.0 | 2.0 | 1309 | $1,650 | $1.26 | 43d | 1 | 0.86mi |
| 5005 Longstreet Pl Unit 19 Bossier City, LA | 2.0 | 2.0 | 1200 | $1,500 | $1.25 | 20d | 1 | 0.86mi |
| 4720 Longstreet Pl Bossier City, LA | 3.0 | 2.0 | 1407 | $1,500 | $1.07 | 44d | 1 | 1.37mi |
| 4708 Longstreet Pl Bossier City, LA | 3.0 | 1.5 | 1108 | $1,500 | $1.35 | 43d | 1 | 1.40mi |
Listing history 7 events
-
2026-05-12historical Active Contingent 1920-char remark
-
2026-05-06$225,000 Active 1920-char remark
-
2022-01-20soldstatus $131,720
-
2015-03-26soldstatus $131,720
-
2004-10-28soldstatus $122,000
-
1998-09-23soldstatus $94,000
-
1994-12-23soldstatus $85,000
ⓘ Source: listings_history table (triggers on properties + properties_extension) + one-shot
backfill from property_details.listing_events for pre-trigger history.
Tax reassessment forecast LA · Resets to sale price
- Current annual tax
- $1,758 · $146/mo
- Projected year-2 tax
- $1,758 · $146/mo
- Expected delta
- $0/yr ($0/mo · 0.0%)
ⓘ Screening estimate from a state-policy table — verify with the county assessor before closing.
Climate risk First Street
- Flood 3/10 Moderate FEMA zone X · 20% chance over 30 yrs
- Wildfire 3/10 Moderate
- Heat 8/10 Severe 7 d/yr ≥110°F today · 23 d/yr by 30 yrs out
- Wind 6/10 Major 68% chance of damaging wind over 30 yrs
- Air quality 2/10 Low 0 unhealthy d/yr today · 1 by 30 yrs out
Nearby sold comps map
Loading sold comps map…
Walkable amenities ~0.75 mi
Loading nearby amenities…
Taxation est. · year 1
- Rental income
- $21,533
- − Mortgage interest
- −$12,603
- − Property taxes
- −$1,758
- − Insurance
- −$1,125
- − Repairs & maintenance
- −$1,723
- − Management
- −$1,723
- − Depreciation
- −$6,545
- Taxable loss
- −$3,944
- Est. tax savings @ 24.0%
- +$946
- After-tax cash flow
- $916/yr
For passive investors: Depreciation is non-cash, so a rental often shows a tax loss while cash-flowing — sheltering income. Rental losses are passive: they offset passive income freely, and up to $25,000/yr can offset ordinary (W-2) income if you actively participate and your MAGI is under $100k (phasing out to $0 by $150k); unused losses carry forward. On sale, claimed depreciation is recaptured at up to 25%, and gains may owe capital-gains tax (a 1031 exchange can defer both). Figures are a year-1 estimate at your 24.0% rate — not tax advice; consult a CPA.
Schools (NCES district)
- District
- Bossier Parish
- NCES district ID
- 2200270
- Math proficiency
- 40% ▼ -32.00%
- Reading proficiency
- 47% ▼ -28.00%
- Median HH income
- $51,326
- Composite
- 37.5/100
- National rank
- #4402
- State rank
- #17 of 98 in LA
Livability — Bossier City
- Score
- 71/100
- State rank
- #47
- US rank
- #7044
Category grades
Schools grade is shown separately in the Schools card above.
Census & demographics
- Census place
- Bossier City, LA
- County
- Bossier Parish · 98,704 people
- City population
- 91,925
- Metro
- Shreveport-Bossier City, LA
- Population (ZIP)
- 33,587
- Household income
- $61,760
- Rent vs Own
- Severe rent burden
- 1391.0
Population outlook (Bossier County) Hauer SSP2
- Today (2025)
- 143,247 people
- By 2030
- 151,802 · +6.0%
- By 2040
- 168,194 · +17.4%
- By 2050
- 183,533 · +28.1%
- By 2075
- 217,009 · +51.5%
- By 2100
- 230,091 · +60.6%
Race, ethnicity, and origin ACS 2023
- Neighborhood character
- Diverse neighborhood (Simpson 0.57)
- Race & ethnicity
- White 59% Black 24% Hispanic / Latino 12% Two or more races 8% Asian 2%
- Hispanic origin (detail)
- Mexican 9%
- Common ancestry
- Lithuanian 2% Slovak 1% Scottish 1%
- Foreign-born
- 5% · Canada, Vietnam
- Languages at home
- 89% English-only · Spanish 7% Other Indo-European 1% Tagalog/Filipino 1%
Political lean MEDSL · Bossier
- 2024 margin
- Solid R (+43.3) · D 27.7% · R 71.0% · Other 1.3%
- 2008→2024 swing
- +0.3pp no change · 2008: -43.7pp · 2024: -43.3pp
- All cycles
- 2024: R+43.3 2020: R+41.0 2016: R+45.8 2012: R+45.4 2008: R+43.7
Not yet ingested
- Civics
- —
Market trends
- HPI YoY
- ▼ -77.48%
- Current HPI
- 127.9821
- Rent YoY
- ▲ 3.60%
- Metro
- Shreveport-Bossier City, LA
- State GDP YoY
- ▲ 3.29%
- F500 in state
- 10
Industry mix (Fortune 500 HQ in LA)
| Industry | F500 HQs | Revenue |
|---|---|---|
| Telecommunications | 2 | $23B |
|
||
| Utilities | 1 | $12B |
|
||
| Wholesale / Distribution | 1 | $5B |
|
||
| Advertising | 1 | $2B |
|
||
Price history
+164.7% since first listed8 events — show timeline
- 2026-05-27 Pending — NTREIS
- 2026-05-12 Contingent — NTREIS
- 2026-05-06 Listed $225,000 NTREIS
- 2022-01-20 Sold (Public Records) $131,720 Public Records
- 2015-03-26 Sold (Public Records) $131,720 Public Records
- 2004-10-28 Sold (Public Records) $122,000 Public Records
- 1998-09-23 Sold (Public Records) $94,000 Public Records
- 1994-12-23 Sold (Public Records) $85,000 Public Records
Property tax history
+6.6%/yrLatest (2025): $1,758 · -1.3% YoY. Source: county tax records.
Cash-flow waterfall
monthlySold comps — $/sqft
last 12 mo · ≤1 miLoading sold comps…