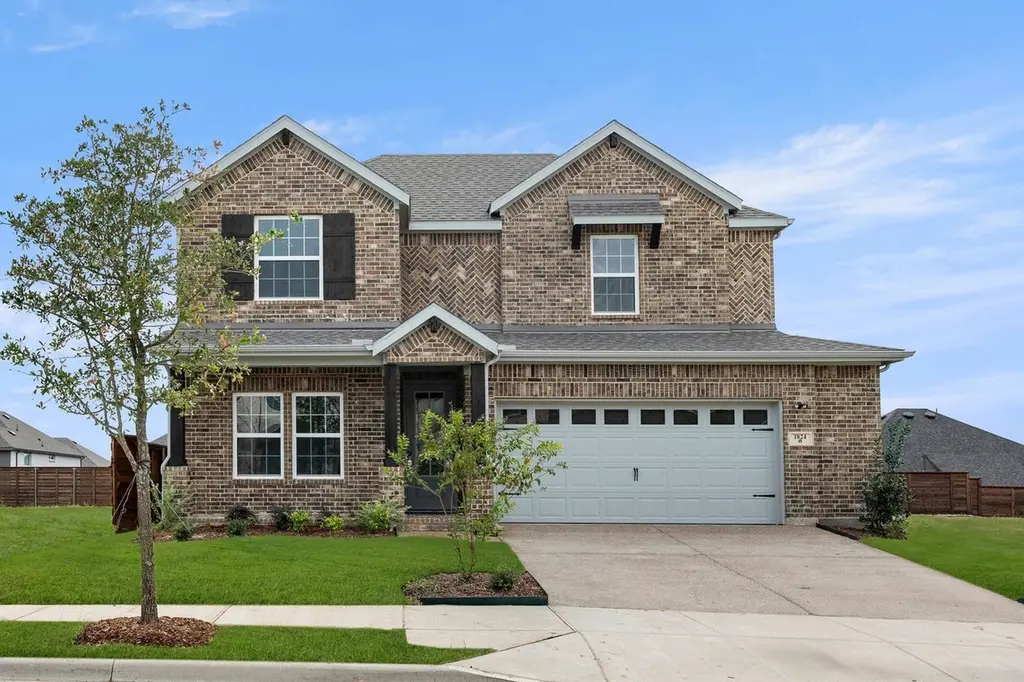
1824 Solterra Blvd · Mesquite, TX
Flood risk No data
- FEMA flood zone
- —
- Chance of flooding over 30 yrs
- —
- Est. flood insurance / yr
- —
Fire risk No data
- Est. fire insurance / yr
- —
Heat risk No data
- Hot days now (above threshold)
- —
- Hot days in 30 yrs
- —
Wind risk No data
- Chance of severe wind over 30 yrs
- —
Air-quality risk No data
- Unhealthy air days now
- —
- Unhealthy air days in 30 yrs
- —
Risk factors via First Street. Map © Google.
Why this score? — see what drove the D- grade
The composite is a weighted blend of 9 inputs, each scored 0–100. Each bar is that input's sub-score; the figure is the points it added to the 100-point composite (weight × sub-score).
- ARV discount +13.4/15.0
- Cash flow +8.2/30.0
- Livability +3.5/5.0
- Schools +2.9/10.0
- 1% rule +2.6/10.0
- Rent growth +2.5/5.0
- Condition / age +2.5/5.0
- DSCR +2.2/10.0
- Appreciation +0.0/10.0
$424,350
🖨 Deal sheet 📄 Offer letter ✓ Due diligence
Listing remarks MLS
The Tyler is an incredible two-story floorplan featuring a stunning foyer and picturesque high ceilings that carry through to the rear of the home, creating a dramatic and open feel. Just off the entry, a private study offers the perfect space for work or quiet focus. The gourmet kitchen is a true centerpiece, showcasing a large island ideal for meal prep, casual dining, or entertaining. The primary suite is thoughtfully designed with upgraded flooring, additional lighting, and an elegant box ceiling that adds architectural interest. The ensuite bath includes a separate shower with a step-in mud pan and a sleek glass enclosure. Upstairs, an oversized game room provides a flexible space for relaxation, play, or gathering with family and friends-completing this thoughtfully crafted home built for modern living.
Key facts
- Gourmet kitchen
- Two-story floorplan
- Large island
Tags
Neighborhood map
What this means for you Summary
Snapshot
- This is a 4-bed/3.0-bath single-family listed at $424k.
Deal economics
- At list price, monthly cash flow is $-394 ($-5k/yr) — negative.
- To cash-flow at today's rent, offer at most $367k (13.4% below list).
- To meet the 1% rule (rent ≥ 1% of price), the offer needs to be $321k (24.3% below list).
- Recommended offer: $321k (24.3% below list) — sets the bar for 1% rule.
Location & tenants
- Location reads 70/100 on livability (#358 in TX) — a middle-class / working-renter tenant base. Strengths: cost of living A+, housing A+, health & safety A-; Watch: schools C-, crime F, commute F.
- Mesquite ISD (suburban): math 35% / reading 32% proficiency, ranked #536 of 826 in TX (top 65%) — families likely to look elsewhere, expect single-tenant / working-renter base with shorter leases; 63% free/reduced lunch — lower-income household profile, screen leases tightly.
- Market conditions: Rents flat; 590 active listings in the ZIP; 19 comparable units currently listed for rent nearby; rentals at typical pace (median 25d on market — plan ~3-4 weeks tenant-placement turnaround); high-income renter base; 12,577 units permitted in Dallas County in 2024 (6,829 in 5+ unit buildings).
- This rent runs 35% of the median local income ($111k/yr) — at the standard rent-burdened threshold; future hikes will face affordability resistance.
Forward outlook
- Local home prices are declining (-3.0%/yr); year-one equity from $3k of loan paydown is wiped out by about $13k of value loss. Plan a longer hold.
- Dallas County population projected at +35% by 2050 — long-run rental-demand tailwind backs the buy-and-hold thesis.
Negotiation context
- It's been on market 324 days — a 12% lower offer ($373k) is reasonable based on typical stale-listing flexibility.
- 2 sale attempts with the ask held roughly flat each time — persistent listings suggest the price (not the market) is what's stuck; bring a comps-based counter.
Questions for the listing agent
- What do current leases actually rent for vs. the listed asking? Can we see a recent rent roll and the last 12 months of T-12 income?
- It's been on market 324 days. Have you received any prior offers? Is the seller open to a 24% concession, seller financing, or rate buy-down credit?
- Why hasn't it sold? Are there any deal-killer items the seller is aware of (foundation, flood, title, zoning, code violations)?
- Is there a deadline driving the sale (1031 exchange, divorce, estate, relocation)? That informs how much negotiation room exists.
- Crime grade is F in this area — have there been break-ins, vandalism, or insurance claims at this property in the last 3 years? What carrier currently insures it and at what premium?
- The area grade is low — what's the realistic commute time and amenity access for the typical tenant pool here? Any planned neighborhood developments (good or bad) we should know about?
- What's the average days-on-market for RENTAL listings here right now (not sales)? A rising rental-DOM trend means longer vacancies and softer asking-rent achievability than the comps imply.
- What's the recent tenant-quality profile in this submarket — average credit score on applications, eviction rate, late-payment / NSF rate, and stable-employment percentage? A property-management company in the area should have these aggregated.
- How much new for-sale + rental construction is in the pipeline within 1–3 miles? Heavy new supply typically softens prices + rents 12–24 months out; constrained supply supports both.
Investment metrics
- 1% rule
- 0.76% ✗
- Cap rate
- 5.18%
- Cash-on-cash
- -3.98%
- DSCR
- 0.82
- GRM
- 11.0
CMA / ARV
- ARV (median comp)
- $488,870
- List price
- $424,350
- Delta
- -13.20%
- Verdict
- UNDERPRICED
- Comps
- 20 within 1.0 mi
Show comp detail 12 sales within ~0.75 mi
| Address | Dist | Beds/Ba | Sqft | Sold | Price | $/sf | Match |
|---|---|---|---|---|---|---|---|
| 1816 Morning Mist Way | 0.24mi | 4/2.5 | 2,574 (+1%) | 0mo | $516,901 | $201 | 85 |
| 1825 Jasmine June | 0.02mi | 5/4.0 (+1) | 2,683 (+5%) | 2mo | $529,950 | $198 | 80 |
| 2028 Jasper Mdws | 0.32mi | 5/3.0 (+1) | 2,538 (-0%) | 2mo | $464,373 | $183 | 78 |
| 2101 Hazel Lily Run | 0.36mi | 4/2.5 | 2,495 (-2%) | 2mo | $474,000 | $190 | 76 |
| 1801 Jade Forest Ln | 0.39mi | 4/2.5 | 2,495 (-2%) | 3mo | $487,955 | $196 | 74 |
| 2225 Hazel Lily Run | 0.32mi | 4/3.0 | 2,358 (-7%) | 0mo | $414,990 | $176 | 72 |
| 1933 Jade Forest Ln | 0.39mi | 3/2.5 (-1) | 2,500 (-2%) | 3mo | $409,990 | $164 | 69 |
| 1813 Forest Wood Ln | 0.51mi | 4/2.5 | 2,630 (+3%) | 1mo | $414,990 | $158 | 68 |
| 2500 Redfield Dr | 0.70mi | 4/3.5 | 2,531 (-1%) | 3mo | $360,000 | $142 | 62 |
| 1806 Cedar Ridge Dr | 0.64mi | 4/2.5 | 2,686 (+6%) | 2mo | $345,000 | $128 | 57 |
| 1837 Rustic Vine Rd | 0.23mi | 5/3.5 (+1) | 2,925 (+15%) | 3mo | $473,000 | $162 | 55 |
| 1909 Sapphire Run | 0.37mi | 5/3.0 (+1) | 2,894 (+14%) | 2mo | $469,099 | $162 | 53 |
Match score weights: distance 35% · size 25% · config 20% · recency 20%. Top-matched comps best support the ARV.
Projected returns pro-forma
-3.0% appreciation · 0.07% rent growth · sell at horizon
- IRR
- -26.3%
- Equity multiple
- 0.13×
- Total profit
- $-103,026
- Equity at exit
- $63,272
- IRR
- -37.1%
- Equity multiple
- -0.33×
- Total profit
- $-157,463
- Equity at exit
- $36,690
Cash invested: $118,818 (down + closing). Projections, not guarantees.
Landlord ↔ Tenant lean methodology
- Overall (STATE)
- 87 Strongly Landlord-Friendly
- State Texas
- 87 Strongly Landlord-Friendly · R+5
- County
- — inherits STATE
- City
- — inherits STATE
ZIP-level market 75181
- Home prices YoY
- -9.4%
- Rents YoY
- 0.1%
- Active inventory
- 590
- Price-to-rent
- 11.0×
Monthly cashflow live
- Estimated rent
- $3,213 high interval (Pro) →
- Mortgage (P&I)
- −$2,225
- Tax est. 1.5%
- −$530 /mo · $6,365/yr
- Insurance
- −$177
- HOA
- −$0
- Vacancy / Maint / Mgmt
- −$675
- Net cashflow
- $-394
Break-even live
UW: 25.0% down · 7.5% · 30yr · 1.5% tax · 5.0% vac · 8.0% maint · 8.0% mgmt
Financing live
Cash to close
- Down payment
- $106,088
- Closing costs
- $12,730
- Reserves months
- —
- Total cash needed
- —
Loan-product check · same deal, 3 products live
Conventional
25% down · 7.5% · 30yr
- Down + closing
- —
- Monthly P&I
- —
- Monthly cashflow
- —
- DSCR
- —
- Eligible?
- —
Personal DTI + credit; lowest rate.
DSCR
20% down · 8.5% · 30yr
- Down + closing
- —
- Monthly P&I
- —
- Monthly cashflow
- —
- DSCR
- —
- Eligible?
- —
No personal income docs; deal must DSCR.
Hard money
10% down · 12.0% · 12mo
- Down + closing
- —
- Monthly P&I
- —
- Monthly cashflow
- —
- DSCR
- —
- Eligible?
- —
Short-term bridge; refi at stabilization.
Rent comps 19 comps
| Address | Beds | Baths | Sqft | Rent | $/sqft | DOM | Units | Dist |
|---|---|---|---|---|---|---|---|---|
| 1908 Twisted Tree Ln Mesquite, TX | 5.0 | 2.5 | 2750 | $3,670 | $1.33 | 24d | 1 | 0.29mi |
| 1817 Cedarbriar Dr Mesquite, TX | 5.0 | 3.5 | 2538 | $3,495 | $1.38 | 44d | 1 | 0.65mi |
| 2439 Whitetail Dr Mesquite, TX | 4.0 | 2.5 | 2484 | $2,800 | $1.13 | 24d | 1 | 0.76mi |
| 1809 Osage Trl Mesquite, TX | 4.0 | 2.0 | 2022 | $2,599 | $1.29 | 17d | 1 | 0.83mi |
| 732 Creekview Ct Mesquite, TX | 5.0 | 3.0 | 2313 | $3,495 | $1.51 | 44d | 1 | 0.94mi |
| 1332 Nimitz Way Mesquite, TX | 4.0 | 2.0 | 2109 | $2,280 | $1.08 | 21d | 1 | 0.98mi |
| 1309 Dawson Way Mesquite, TX | 4.0 | 2.0 | 1952 | $2,222 | $1.14 | 8d | 1 | 1.03mi |
| 815 Valleycreek Rd Mesquite, TX | 3.0 | 2.0 | 1788 | $2,500 | $1.40 | 44d | 1 | 1.04mi |
| 1308 Dawson Way Mesquite, TX | 4.0 | 2.5 | 2476 | $3,573 | $1.44 | 24d | 1 | 1.05mi |
| 2749 Ingram Cir Mesquite, TX | 3.0 | 2.0 | 1791 | $2,119 | $1.18 | 3d | 1 | 1.22mi |
| 2637 Austin Dr Mesquite, TX | 4.0 | 2.5 | 2291 | $3,350 | $1.46 | 44d | 1 | 1.32mi |
| 716 Elm Falls Pl Mesquite, TX | 3.0 | 2.0 | 2444 | $2,300 | $0.94 | 21d | 1 | 1.34mi |
| 1226 Rivercrest Dr Mesquite, TX | 5.0 | 3.0 | 3221 | $3,970 | $1.23 | 1d | 1 | 1.35mi |
| 2302 Highbank Dr Mesquite, TX | 3.0 | 2.0 | 1783 | $2,145 | $1.20 | 44d | 1 | 1.36mi |
| 2621 Ash Crk Mesquite, TX | 3.0 | 2.0 | 1843 | $2,299 | $1.25 | 44d | 1 | 1.36mi |
| 2829 Kerrville Dr Mesquite, TX | 4.0 | 2.5 | 2349 | $2,700 | $1.15 | 4d | 1 | 1.39mi |
| 1626 Rancho Dr Mesquite, TX | 4.0 | 2.0 | 2562 | $2,419 | $0.94 | 24d | 1 | 1.42mi |
| 2725 Stillwater Dr Mesquite, TX | 5.0 | 2.5 | 2228 | $3,199 | $1.44 | 1d | 1 | 1.45mi |
| 1704 Bent Brook Dr Mesquite, TX | 5.0 | 3.0 | 2726 | $2,900 | $1.06 | 18d | 1 | 1.48mi |
Listing history 19 events
-
2026-06-18days on market $424,350 Active 324 DOM
-
2026-06-17days on market $424,350 Active 323 DOM
-
2026-06-16days on market $424,350 Active 322 DOM
-
2026-06-15days on market $424,350 Active 321 DOM
-
2026-06-13days on market $424,350 Active 319 DOM
-
2026-06-13days on market $424,350 Active 318 DOM
-
2026-06-09days on market $424,350 Active 315 DOM
-
2026-06-08days on market $424,350 Active 314 DOM
-
2026-06-07days on market $424,350 Active 313 DOM
-
2026-06-04days on market $424,350 Active 310 DOM
-
2026-06-03days on market $424,350 Active 309 DOM
-
2026-06-02days on market $424,350 Active 308 DOM
-
2026-06-01days on market $424,350 Active 307 DOM
-
2026-05-31days on market $424,350 Active 306 DOM
-
2026-01-21price $424,350 820-char remark
Show marketing remark (820 chars)
The Tyler is an incredible two-story floorplan featuring a stunning foyer and picturesque high ceilings that carry through to the rear of the home, creating a dramatic and open feel. Just off the entry, a private study offers the perfect space for work or quiet focus. The gourmet kitchen is a true centerpiece, showcasing a large island ideal for meal prep, casual dining, or entertaining. The primary suite is thoughtfully designed with upgraded flooring, additional lighting, and an elegant box ceiling that adds architectural interest. The ensuite bath includes a separate shower with a step-in mud pan and a sleek glass enclosure. Upstairs, an oversized game room provides a flexible space for relaxation, play, or gathering with family and friends-completing this thoughtfully crafted home built for modern living.
-
2026-01-20price $424,950 820-char remark
Show marketing remark (820 chars)
The Tyler is an incredible two-story floorplan featuring a stunning foyer and picturesque high ceilings that carry through to the rear of the home, creating a dramatic and open feel. Just off the entry, a private study offers the perfect space for work or quiet focus. The gourmet kitchen is a true centerpiece, showcasing a large island ideal for meal prep, casual dining, or entertaining. The primary suite is thoughtfully designed with upgraded flooring, additional lighting, and an elegant box ceiling that adds architectural interest. The ensuite bath includes a separate shower with a step-in mud pan and a sleek glass enclosure. Upstairs, an oversized game room provides a flexible space for relaxation, play, or gathering with family and friends-completing this thoughtfully crafted home built for modern living.
-
2026-01-16historical
-
2025-07-31$424,350 Active
-
2025-07-30$424,350 Active 820-char remark
Show marketing remark (820 chars)
The Tyler is an incredible two-story floorplan featuring a stunning foyer and picturesque high ceilings that carry through to the rear of the home, creating a dramatic and open feel. Just off the entry, a private study offers the perfect space for work or quiet focus. The gourmet kitchen is a true centerpiece, showcasing a large island ideal for meal prep, casual dining, or entertaining. The primary suite is thoughtfully designed with upgraded flooring, additional lighting, and an elegant box ceiling that adds architectural interest. The ensuite bath includes a separate shower with a step-in mud pan and a sleek glass enclosure. Upstairs, an oversized game room provides a flexible space for relaxation, play, or gathering with family and friends-completing this thoughtfully crafted home built for modern living.
ⓘ Source: listings_history table (triggers on properties + properties_extension) + one-shot
backfill from property_details.listing_events for pre-trigger history.
Nearby sold comps map
Loading sold comps map…
Walkable amenities ~0.75 mi
Loading nearby amenities…
Taxation est. · year 1
- Rental income
- $38,557
- − Mortgage interest
- −$23,770
- − Property taxes
- −$6,365
- − Insurance
- −$2,122
- − Repairs & maintenance
- −$3,085
- − Management
- −$3,085
- − Depreciation
- −$12,345
- Taxable loss
- −$12,214
- Est. tax savings @ 24.0%
- +$2,931
- After-tax cash flow
- $-1,799/yr
For passive investors: Depreciation is non-cash, so a rental often shows a tax loss while cash-flowing — sheltering income. Rental losses are passive: they offset passive income freely, and up to $25,000/yr can offset ordinary (W-2) income if you actively participate and your MAGI is under $100k (phasing out to $0 by $150k); unused losses carry forward. On sale, claimed depreciation is recaptured at up to 25%, and gains may owe capital-gains tax (a 1031 exchange can defer both). Figures are a year-1 estimate at your 24.0% rate — not tax advice; consult a CPA.
Schools (NCES district)
- District
- Mesquite ISD
- NCES district ID
- 4830390
- Math proficiency
- 35% ▼ -11.00%
- Reading proficiency
- 32% ▼ -7.00%
- Median HH income
- $49,372
- Composite
- 29.06/100
- National rank
- #6606
- State rank
- #536 of 826 in TX
Livability — Mesquite
- Score
- 70/100
- State rank
- #358
- US rank
- #7743
Category grades
Schools grade is shown separately in the Schools card above.
Census & demographics
- Census place
- Mesquite, TX
- County
- Dallas County · 2,612,404 people
- City population
- 150,788
- Metro
- Dallas-Fort Worth-Arlington, TX
- Population (ZIP)
- 29,788
- Household income
- $111,052
- Rent vs Own
- Severe rent burden
- 857.0
Population outlook (Dallas County) Hauer SSP2
- Today (2025)
- 2,979,839 people
- By 2030
- 3,191,823 · +7.1%
- By 2040
- 3,619,611 · +21.5%
- By 2050
- 4,026,915 · +35.1%
- By 2075
- 4,957,073 · +66.4%
- By 2100
- 5,508,725 · +84.9%
Race, ethnicity, and origin ACS 2023
- Neighborhood character
- Highly diverse neighborhood (Simpson 0.71)
- Race & ethnicity
- Black 39% Hispanic / Latino 32% Two or more races 21% White 16% Asian 5% Native American 1%
- Hispanic origin (detail)
- Mexican 27% Puerto Rican 1%
- Common ancestry
- Slovak 2% Italian 1%
- Foreign-born
- 22% · Canada, Vietnam
- Languages at home
- 64% English-only · Spanish 27% Tagalog/Filipino 3% Other Asian/Pacific 1%
Political lean MEDSL · Dallas
- 2024 margin
- Strong D (+22.2) · D 60.2% · R 38.0% · Other 1.8%
- 2008→2024 swing
- +6.9pp toward D · 2008: 15.3pp · 2024: 22.2pp
- All cycles
- 2024: D+22.2 2020: D+31.6 2016: D+26.2 2012: D+15.4 2008: D+15.3
Not yet ingested
- Civics
- —
Market trends
- HPI YoY
- ▼ -26.63%
- Current HPI
- 257.0959
- Rent YoY
- ▲ 0.07%
- Metro
- Dallas-Fort Worth-Arlington, TX
- State GDP YoY
- ▲ 3.95%
- F500 in state
- 110
Industry mix (Fortune 500 HQ in TX)
| Industry | F500 HQs | Revenue |
|---|---|---|
| Energy | 16 | $1,198B |
|
||
| Technology | 5 | $198B |
|
||
| Engineering / Construction | 4 | $72B |
|
||
| Energy Services | 3 | $60B |
|
||
| Utilities | 3 | $41B |
|
||
| Healthcare | 2 | $330B |
|
||
Price history
+0.0% since first listed5 events — show timeline
- 2026-01-21 Price Changed $424,350 Zillow
- 2026-01-20 Price Changed $424,950 Zillow
- 2026-01-16 Listing Removed — NTREIS
- 2025-07-31 Listed $424,350 NTREIS
- 2025-07-30 Listed $424,350 Zillow
Cash-flow waterfall
monthlySold comps — $/sqft
last 12 mo · ≤1 miLoading sold comps…