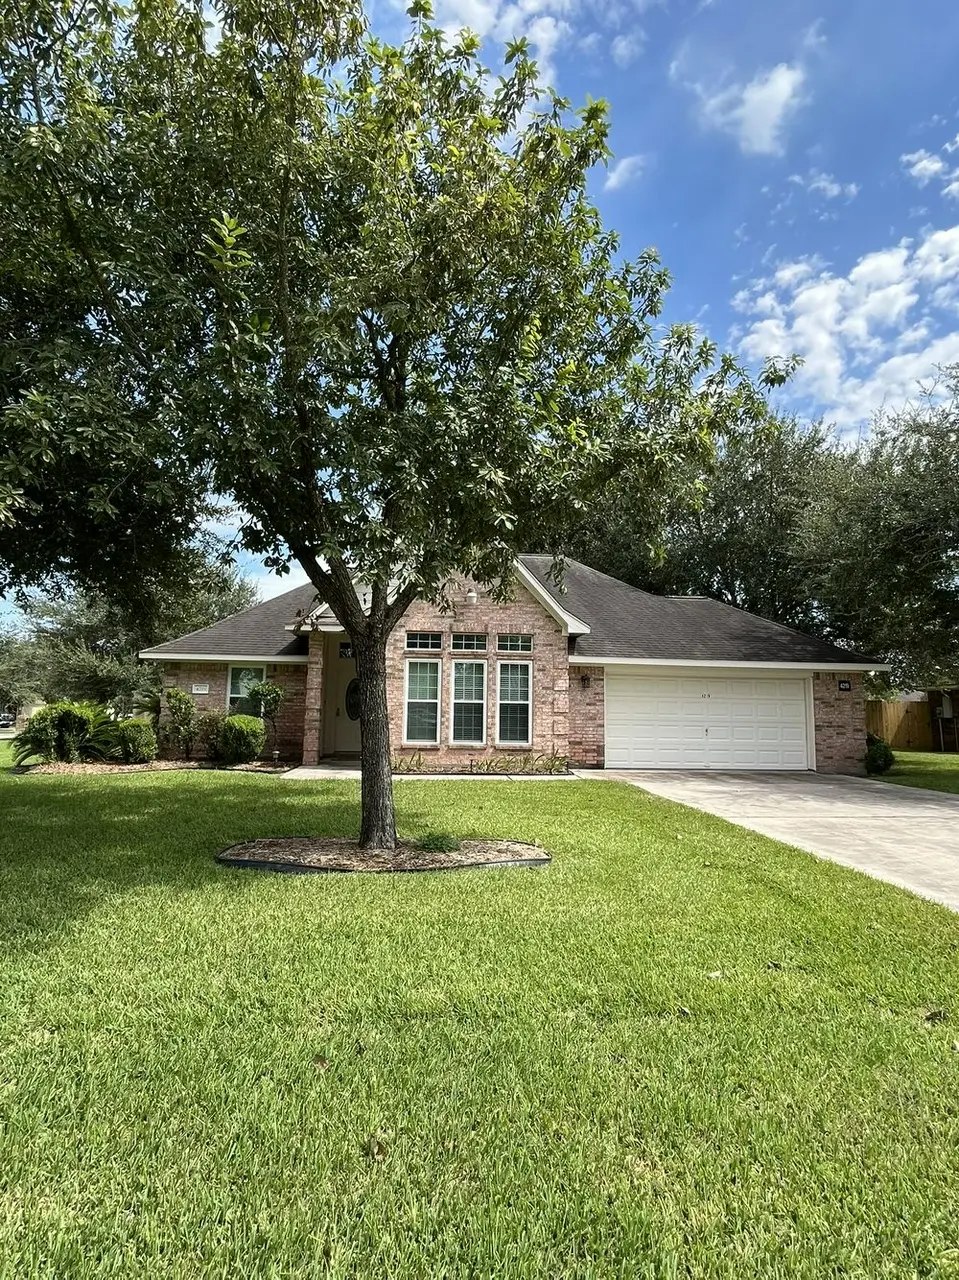
4219 Avenue J · Santa Fe, TX
Flood risk 4/10 · Minor
- FEMA flood zone
- X (shaded)
- Chance of flooding over 30 yrs
- 0.22%
- Est. flood insurance / yr
- $507 – $1,088
Fire risk 3/10 · Minor
- Est. fire insurance / yr
- $1,222 – $2,270
Heat risk 10/10 · Severe
- Hot days now (above 110°F)
- 7 days/yr
- Hot days in 30 yrs
- 26 days/yr
Wind risk 9/10 · Severe
- Chance of severe wind over 30 yrs
- 99.0%
Air-quality risk 2/10 · Minimal
- Unhealthy air days now
- 1 days/yr
- Unhealthy air days in 30 yrs
- 1 days/yr
Risk factors via First Street. Map © Google.
Why this score? — see what drove the D grade
The composite is a weighted blend of 9 inputs, each scored 0–100. Each bar is that input's sub-score; the figure is the points it added to the 100-point composite (weight × sub-score).
- Cash flow +15.0/30.0
- 1% rule +5.0/10.0
- DSCR +5.0/10.0
- ARV discount +3.5/15.0
- Schools +3.5/10.0
- Livability +3.4/5.0
- Rent growth +2.5/5.0
- Condition / age +2.5/5.0
- Appreciation +0.0/10.0
$299,130
🖨 Deal sheet 📄 Offer letter ✓ Due diligence
Listing remarks MLS
Charming 3 bedroom, 2 bath home situated on an oversized corner lot in the heart of Santa Fe. This well maintained home offers a spacious, functional layout, a welcoming living area, and plenty of natural light throughout. The primary suite features a private ensuite bath and a generous walk-in closet. Enjoy the large fenced backyard complete with a 13x13 workshop building, perfect for hobbies, projects, or extra storage. An oversized 2 car garage provides additional convenience and workspace. Conveniently located with easy access to schools, shopping, and commuting routes, while still offering a quiet small town feel.
Key facts
- Updated appliances
- Walk-in closet
- Shop for projects
Tags
Neighborhood map
What this means for you Summary
Snapshot
- This is a 3-bed/2.0-bath single-family listed at $299k.
Deal economics
- At list price, monthly cash flow is $15k ($185k/yr) — positive.
- The deal already cash-flows at list — no discount required.
- Meets the 1% rule at list price ($22k rent vs $299k).
- Recommended offer: $263k (12.0% below list) — sets the bar for market timing.
- Cap rate 68.1% vs local median 4.5% in Santa Fe — top-decile yield for the area; either an underpriced asset or a hidden risk that comps aren't pricing in. Stress-test before assuming the spread holds.
Location & tenants
- Location reads 67/100 on livability (#550 in TX) — a middle-class / working-renter tenant base. Strengths: crime A+, cost of living A+, housing A+; Watch: amenities F, commute F, health & safety F.
- Santa Fe ISD (suburban): math 38% / reading 39% proficiency, ranked #385 of 826 in TX (top 47%) — families likely to look elsewhere, expect single-tenant / working-renter base with shorter leases.
- Market conditions: 233 active listings in the ZIP; 2 comparable units currently listed for rent nearby; 3,258 units permitted in Galveston County in 2024 (0 in 5+ unit buildings).
Forward outlook
- Local home prices are declining (-3.0%/yr); year-one equity from $2k of loan paydown is wiped out by about $9k of value loss. Plan a longer hold.
- Galveston County population projected at +43% by 2050 — long-run rental-demand tailwind backs the buy-and-hold thesis.
- At projected returns (-3.0% appreciation + 3.0% rent growth), your $84k cash investment doubles in ~1 year — after that, you're playing with house money.
Negotiation context
- It's been on market 180 days — a 12% lower offer ($263k) is reasonable based on typical stale-listing flexibility.
- 2 sale attempts with the ask held roughly flat each time — persistent listings suggest the price (not the market) is what's stuck; bring a comps-based counter.
Risks & watch-outs
- Climate carrying-cost: severe wind risk, 99% chance of damaging wind over 30y; extreme-heat days projected 7→26/yr by 2055 (HVAC capex compounding) — expect insurance premiums to compound above CPI over the hold.
Questions for the listing agent
- It's been on market 180 days. Have you received any prior offers? Is the seller open to a 12% concession, seller financing, or rate buy-down credit?
- Why hasn't it sold? Are there any deal-killer items the seller is aware of (foundation, flood, title, zoning, code violations)?
- Is there a deadline driving the sale (1031 exchange, divorce, estate, relocation)? That informs how much negotiation room exists.
- The area grade is low — what's the realistic commute time and amenity access for the typical tenant pool here? Any planned neighborhood developments (good or bad) we should know about?
- What's the average days-on-market for RENTAL listings here right now (not sales)? A rising rental-DOM trend means longer vacancies and softer asking-rent achievability than the comps imply.
- What's the recent tenant-quality profile in this submarket — average credit score on applications, eviction rate, late-payment / NSF rate, and stable-employment percentage? A property-management company in the area should have these aggregated.
- How much new for-sale + rental construction is in the pipeline within 1–3 miles? Heavy new supply typically softens prices + rents 12–24 months out; constrained supply supports both.
Investment metrics
- 1% rule
- 7.49% ✓
- Cap rate
- 68.11%
- Cash-on-cash
- 220.77%
- DSCR
- 10.82
- GRM
- 1.1
CMA / ARV
- ARV (median comp)
- $274,970
- List price
- $299,130
- Delta
- 8.79%
- Verdict
- FAIR
- Comps
- 20 within 1.0 mi
Show comp detail 12 sales within ~0.75 mi
| Address | Dist | Beds/Ba | Sqft | Sold | Price | $/sf | Match |
|---|---|---|---|---|---|---|---|
| 4238 Chisholm Trl | 0.11mi | 3/2.0 | 1,555 (+1%) | 5mo | $295,000 | $190 | 88 |
| 11806 Oregon Trl | 0.18mi | 3/2.0 | 1,446 (-6%) | 2mo | $299,900 | $207 | 80 |
| 11814 Santa Fe Trl | 0.19mi | 3/2.0 | 1,584 (+3%) | 7mo | $278,000 | $176 | 80 |
| 4433 Avenue L | 0.34mi | 3/2.0 | 1,500 (-2%) | 10mo | $289,900 | $193 | 72 |
| 11826 Old Spanish Trl | 0.14mi | 3/2.0 | 1,374 (-10%) | 10mo | $269,999 | $197 | 68 |
| 11837 12th St | 0.36mi | 3/2.0 | 1,639 (+7%) | 7mo | $317,500 | $194 | 66 |
| 11731 Santa Fe Trl | 0.28mi | 3/2.0 | 1,356 (-12%) | 4mo | $257,500 | $190 | 64 |
| 11811 15th St | 0.55mi | 3/2.0 | 1,511 (-2%) | 13mo | $245,000 | $162 | 61 |
| 12423 A Bar Dr | 0.60mi | 3/2.0 | 1,443 (-6%) | 1mo | $269,000 | $186 | 61 |
| 12111 Wooden Mill Ln | 0.68mi | 3/2.0 | 1,651 (+8%) | 8mo | $321,424 | $195 | 48 |
| 11905 15th St | 0.53mi | 2/2.0 (-1) | 1,370 (-11%) | 10mo | $200,000 | $146 | 44 |
| 3815 Mulberry Farms Dr | 0.61mi | 3/2.0 | 1,760 (+15%) | 12mo | $340,000 | $193 | 37 |
Match score weights: distance 35% · size 25% · config 20% · recency 20%. Top-matched comps best support the ARV.
Projected returns pro-forma
-3.0% appreciation · 3.0% rent growth · sell at horizon
- IRR
- —
- Equity multiple
- 12.14×
- Total profit
- $933,428
- Equity at exit
- $44,601
- IRR
- —
- Equity multiple
- 25.82×
- Total profit
- $2,078,475
- Equity at exit
- $25,863
Cash invested: $83,756 (down + closing). Projections, not guarantees.
Landlord ↔ Tenant lean methodology
- Overall (STATE)
- 87 Strongly Landlord-Friendly
- State Texas
- 87 Strongly Landlord-Friendly · R+5
- County
- — inherits STATE
- City
- — inherits STATE
ZIP-level market 77510
- Home prices YoY
- -15.3%
- Active inventory
- 233
- Price-to-rent
- 1.1×
Monthly cashflow live
- Estimated rent
- $22,398 medium interval (Pro) →
- Mortgage (P&I)
- −$1,569
- Tax from tax record
- −$592 /mo · $7,105/yr
- Insurance
- −$125
- HOA
- −$0
- Vacancy / Maint / Mgmt
- −$4,704
- Net cashflow
- $15,409
Break-even live
UW: 25.0% down · 7.5% · 30yr · 1.5% tax · 5.0% vac · 8.0% maint · 8.0% mgmt
Financing live
Cash to close
- Down payment
- $74,782
- Closing costs
- $8,974
- Reserves months
- —
- Total cash needed
- —
Loan-product check · same deal, 3 products live
Conventional
25% down · 7.5% · 30yr
- Down + closing
- —
- Monthly P&I
- —
- Monthly cashflow
- —
- DSCR
- —
- Eligible?
- —
Personal DTI + credit; lowest rate.
DSCR
20% down · 8.5% · 30yr
- Down + closing
- —
- Monthly P&I
- —
- Monthly cashflow
- —
- DSCR
- —
- Eligible?
- —
No personal income docs; deal must DSCR.
Hard money
10% down · 12.0% · 12mo
- Down + closing
- —
- Monthly P&I
- —
- Monthly cashflow
- —
- DSCR
- —
- Eligible?
- —
Short-term bridge; refi at stabilization.
Rent comps 2 comps
| Address | Beds | Baths | Sqft | Rent | $/sqft | DOM | Units | Dist |
|---|---|---|---|---|---|---|---|---|
| 11844 13th St Santa Fe, TX | 3.0 | 2.0 | 1472 | $1,750 | $1.19 | 22d | 1 | 0.39mi |
| 4120 Avenue O #10 Santa Fe, TX | 3.0 | 2.0 | 1280 | $74,621 | $58.30 | 43d | 1 | 0.86mi |
Listing history 16 events
-
2026-06-18days on market $299,130 Active 180 DOM
-
2026-06-17days on market $299,130 Active 179 DOM
-
2026-06-16days on market $299,130 Active 178 DOM
-
2026-06-15days on market $299,130 Active 177 DOM
-
2026-06-13pricestatusdays on market $299,130 Active 175 DOM
-
2026-06-09days on market $292,000 Active Under Contract 22 DOM
-
2026-06-08days on market $292,000 Active Under Contract 21 DOM
-
2026-06-07days on market $292,000 Active Under Contract 20 DOM
-
2026-06-04days on market $292,000 Active Under Contract 17 DOM
-
2026-06-03days on market $292,000 Active Under Contract 16 DOM
-
2026-06-02days on market $292,000 Active Under Contract 15 DOM
-
2026-06-01days on market $292,000 Active Under Contract 14 DOM
-
2026-05-31days on market $292,000 Active Under Contract 13 DOM
-
2026-05-19historical Active Under Contract 626-char remark
Show marketing remark (626 chars)
Charming 3 bedroom, 2 bath home situated on an oversized corner lot in the heart of Santa Fe. This well maintained home offers a spacious, functional layout, a welcoming living area, and plenty of natural light throughout. The primary suite features a private ensuite bath and a generous walk-in closet. Enjoy the large fenced backyard complete with a 13x13 workshop building, perfect for hobbies, projects, or extra storage. An oversized 2 car garage provides additional convenience and workspace. Conveniently located with easy access to schools, shopping, and commuting routes, while still offering a quiet small town feel.
-
2026-05-18$292,000 Active 626-char remark
Show marketing remark (626 chars)
Charming 3 bedroom, 2 bath home situated on an oversized corner lot in the heart of Santa Fe. This well maintained home offers a spacious, functional layout, a welcoming living area, and plenty of natural light throughout. The primary suite features a private ensuite bath and a generous walk-in closet. Enjoy the large fenced backyard complete with a 13x13 workshop building, perfect for hobbies, projects, or extra storage. An oversized 2 car garage provides additional convenience and workspace. Conveniently located with easy access to schools, shopping, and commuting routes, while still offering a quiet small town feel.
-
2025-12-20$299,130 Active 621-char remark
Show marketing remark (621 chars)
Step into comfort in this charming 3-bedroom, 2-bath home set on an extra-large corner lot. From the moment you arrive, you'll appreciate the space and warmth this home offers. The large, fenced backyard is perfect for weekend gatherings, gardening, or quiet evenings, complete with a shop for projects or extra storage. An oversized two-car garage adds even more convenience. Inside, updated appliances and a cozy, well-planned layout make it easy to settle in. The primary bedroom feels like a true retreat with a generous walk-in closet and a private ensuite bath. This is a home where memories are waiting to be made.
ⓘ Source: listings_history table (triggers on properties + properties_extension) + one-shot
backfill from property_details.listing_events for pre-trigger history.
Tax reassessment forecast TX · Resets to sale price
- Current annual tax
- $7,105 · $592/mo
- Projected year-2 tax
- $7,105 · $592/mo
- Expected delta
- $0/yr ($0/mo · 0.0%)
ⓘ Screening estimate from a state-policy table — verify with the county assessor before closing.
Climate risk First Street
- Flood 4/10 Moderate FEMA zone X (shaded) · 22% chance over 30 yrs
- Wildfire 3/10 Moderate
- Heat 10/10 Extreme 7 d/yr ≥110°F today · 26 d/yr by 30 yrs out
- Wind 9/10 Extreme 99% chance of damaging wind over 30 yrs
- Air quality 2/10 Low 1 unhealthy d/yr today · 1 by 30 yrs out
Nearby sold comps map
Loading sold comps map…
Walkable amenities ~0.75 mi
Loading nearby amenities…
Taxation est. · year 1
- Rental income
- $268,781
- − Mortgage interest
- −$16,756
- − Property taxes
- −$7,105
- − Insurance
- −$1,496
- − Repairs & maintenance
- −$21,502
- − Management
- −$21,502
- − Depreciation
- −$8,702
- Taxable income
- $191,717
- Est. tax owed @ 24.0%
- −$46,012
- After-tax cash flow
- $138,900/yr
For passive investors: Depreciation is non-cash, so a rental often shows a tax loss while cash-flowing — sheltering income. Rental losses are passive: they offset passive income freely, and up to $25,000/yr can offset ordinary (W-2) income if you actively participate and your MAGI is under $100k (phasing out to $0 by $150k); unused losses carry forward. On sale, claimed depreciation is recaptured at up to 25%, and gains may owe capital-gains tax (a 1031 exchange can defer both). Figures are a year-1 estimate at your 24.0% rate — not tax advice; consult a CPA.
Schools (NCES district)
- District
- Santa Fe ISD
- NCES district ID
- 4839270
- Math proficiency
- 38% ▼ -10.00%
- Reading proficiency
- 39% ▼ -2.00%
- Median HH income
- $66,769
- Composite
- 34.86/100
- National rank
- #5091
- State rank
- #385 of 826 in TX
Livability — Santa Fe
- Score
- 67/100
- State rank
- #550
- US rank
- #10637
Category grades
Schools grade is shown separately in the Schools card above.
Census & demographics
- Census place
- Santa Fe, TX
- Population (ZIP)
- 13,938
Population outlook (Galveston County) Hauer SSP2
- Today (2025)
- 390,640 people
- By 2030
- 425,226 · +8.9%
- By 2040
- 493,765 · +26.4%
- By 2050
- 559,698 · +43.3%
- By 2075
- 719,260 · +84.1%
- By 2100
- 819,628 · +109.8%
Race, ethnicity, and origin ACS 2023
- Neighborhood character
- Predominantly White (72%)
- Race & ethnicity
- White 72% Hispanic / Latino 21% Two or more races 17% Asian 2%
- Hispanic origin (detail)
- Mexican 14% Puerto Rican 3% Cuban 1%
- Common ancestry
- Lithuanian 4% Italian 3% Slovak 1%
- Foreign-born
- 5% · Canada
- Languages at home
- 89% English-only · Spanish 10% Tagalog/Filipino 1%
Political lean MEDSL · Galveston
- 2024 margin
- Strong R (+27.4) · D 35.7% · R 63.1% · Other 1.2%
- 2008→2024 swing
- -7.9pp toward R · 2008: -19.5pp · 2024: -27.4pp
- All cycles
- 2024: R+27.4 2020: R+22.6 2016: R+22.6 2012: R+26.9 2008: R+19.5
Not yet ingested
- Civics
- —
Market trends
- HPI YoY
- ▼ -54.15%
- Current HPI
- 299.2228
- Rent YoY
- —
- Metro
- —
- State GDP YoY
- ▲ 3.95%
- F500 in state
- 110
Industry mix (Fortune 500 HQ in TX)
| Industry | F500 HQs | Revenue |
|---|---|---|
| Energy | 16 | $1,198B |
|
||
| Technology | 5 | $198B |
|
||
| Engineering / Construction | 4 | $72B |
|
||
| Energy Services | 3 | $60B |
|
||
| Utilities | 3 | $41B |
|
||
| Healthcare | 2 | $330B |
|
||
Price history
-2.4% since first listed3 events — show timeline
- 2026-05-19 Contingent — HARMLS
- 2026-05-18 Listed $292,000 HARMLS
- 2025-12-20 Listed $299,130 ForSaleByOwner.com
Property tax history
+3.9%/yrLatest (2025): $7,105 · +7.0% YoY. Source: county tax records.
Cash-flow waterfall
monthlySold comps — $/sqft
last 12 mo · ≤1 miLoading sold comps…