3150 Excelsior Blvd #207 · Minneapolis, MN
Flood risk 1/10 · Minimal
- FEMA flood zone
- X (unshaded)
- Chance of flooding over 30 yrs
- 0.0%
- Est. flood insurance / yr
- $507 – $1,088
Fire risk 1/10 · Minimal
- Est. fire insurance / yr
- $888 – $1,650
Heat risk 2/10 · Minimal
- Hot days now (above 99°F)
- 7 days/yr
- Hot days in 30 yrs
- 14 days/yr
Wind risk 2/10 · Minimal
- Chance of severe wind over 30 yrs
- —
Air-quality risk 2/10 · Minimal
- Unhealthy air days now
- 1 days/yr
- Unhealthy air days in 30 yrs
- 1 days/yr
Risk factors via First Street. Map © Google.
Why this score? — see what drove the D grade
The composite is a weighted blend of 9 inputs, each scored 0–100. Each bar is that input's sub-score; the figure is the points it added to the 100-point composite (weight × sub-score).
- ARV discount +15.0/15.0
- Cash flow +7.1/30.0
- 1% rule +6.1/10.0
- Livability +3.9/5.0
- Schools +3.5/10.0
- Rent growth +3.1/5.0
- Condition / age +2.5/5.0
- DSCR +1.3/10.0
- Appreciation +0.0/10.0
$150,000
🖨 Deal sheet 📄 Offer letter ✓ Due diligence
Listing remarks
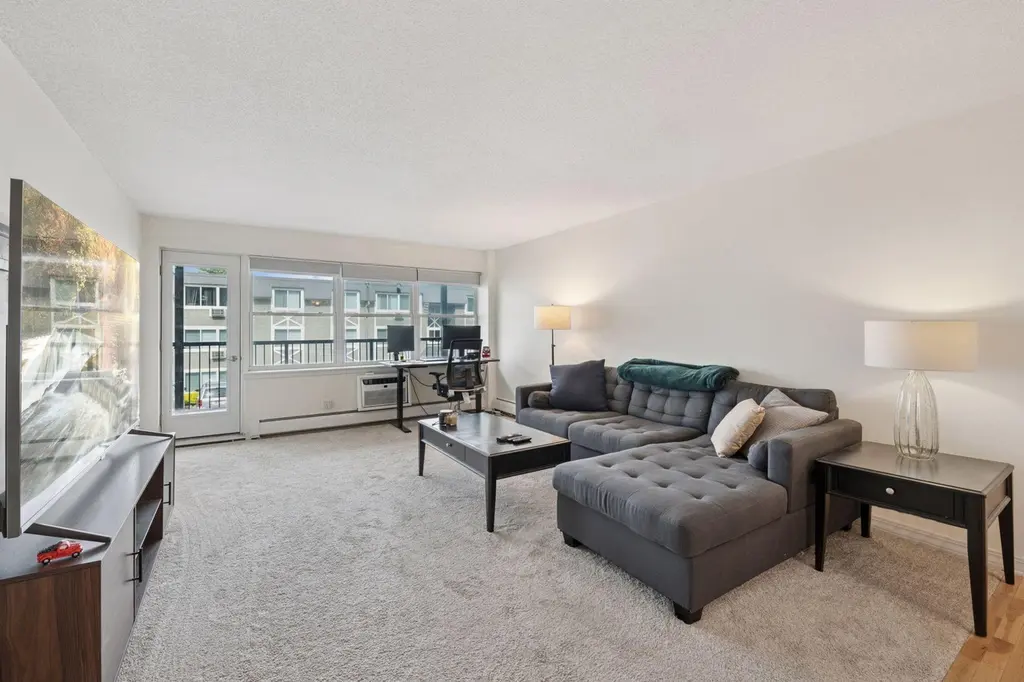
Location doesn't get much better than this. Tucked just steps from Lake Bde Maka Ska, the Greenway, and some of the best dining and shopping along the chain of lakes, this one-bedroom condo puts you right in the middle of everything worth being close to. Inside, the layout is smart and efficient — updated kitchen and bath, in-unit laundry, and underground parking. Step outside onto your large private balcony when you want fresh air without going anywhere. The building adds a rooftop deck, fitness room, and party room for when you do. Low-maintenance living in a neighborhood people genuinely love.
Key facts
- Rooftop deck
- Party room
- Updated kitchen
Tags
Property features AI
Finance
- Other: Shared building rooms include amusement/party room, exercise room, and other shared spaces
- HOA & community: Association: Cities Management; Monthly association fee of $511; Association amenities include coin-op laundry (owned), lobby entrance, shared amenities, parking, professional management, controlled access, heating, water, sewer, cable TV, hazard insurance, lawn care, grounds maintenance, snow removal
Exterior
- Parking: Underground parking; Guest parking; One garage space (stall #16)
- Security: Intercom system; Security system; Controlled access (included in association)
- Utilities: City water; City sewer (in street); Natural gas; Electric with circuit breakers
- Home design: Attached residential property; One-story layout; Main entry level is main floor
- Construction: Block foundation; Block foundation area
- Exterior features: Deck (26 x 6); Stone exterior; Public transit within six blocks; City street frontage; Publicly maintained road
Interior
- Kitchen: Dishwasher; Range; Refrigerator; Microwave; Stainless steel appliances; Eat-in kitchen
- Bedrooms: One bedroom on the main level (12 x 17)
- Flooring: Hardwood floors
- Bathrooms: One full bathroom on the main level (7 x 8)
- Heating & cooling: Baseboard heating; No central cooling
- Interior features: Hardwood floors; Intercom system; Security system; Eat-in kitchen; Storage/locker; Accessible elevator installed
- Laundry & utility: In-unit laundry (washer and dryer); Laundry room on main level; Washer/dryer hookup
Neighborhood map
What this means for you Summary
Snapshot
- This is a 1-bed/1.0-bath condo listed at $150k.
Deal economics
- At list price, monthly cash flow is $-211 ($-3k/yr) — negative.
- To cash-flow at today's rent, offer at most $113k (24.8% below list).
- Meets the 1% rule at list price ($2k rent vs $150k).
- Recommended offer: $113k (24.8% below list) — sets the bar for cash-flow.
- Cap rate 4.6% vs local median 3.1% in Minneapolis — top-decile yield for the area; either an underpriced asset or a hidden risk that comps aren't pricing in. Stress-test before assuming the spread holds.
Location & tenants
- Location reads 78/100 on livability (#110 in MN, #2,525 nationally) — a middle-class / working-renter tenant base. Strengths: amenities A+, commute A+, housing A+; Watch: cost of living C-, crime F.
- Minneapolis Public School District (urban): math 35% / reading 46% proficiency, ranked #217 of 301 in MN (top 72%) — families likely to look elsewhere, expect single-tenant / working-renter base with shorter leases.
- Market conditions: Rents rising (+2.3%/yr); 205 active listings in the ZIP; 40 comparable units currently listed for rent nearby; rentals leasing fast (median 8d on market — plan ~1-2 weeks tenant-placement turnaround); solid renter incomes; 4,651 units permitted in Hennepin County in 2024 (2,443 in 5+ unit buildings).
Forward outlook
- Local home prices are declining (-3.0%/yr); year-one equity from $1k of loan paydown is wiped out by about $4k of value loss. Plan a longer hold.
- Hennepin County population projected at +30% by 2050 — long-run rental-demand tailwind backs the buy-and-hold thesis.
Negotiation context
- It's been on market 37 days — a 3% lower offer ($146k) is reasonable based on typical stale-listing flexibility.
- 10 sale attempts since 21y ago with the ask held roughly flat each time — persistent listings suggest the price (not the market) is what's stuck; bring a comps-based counter.
Risks & watch-outs
- Watch-outs: HOA is 31% of rent.
Questions for the listing agent
- What do current leases actually rent for vs. the listed asking? Can we see a recent rent roll and the last 12 months of T-12 income?
- It's been on market 37 days. Have you received any prior offers? Is the seller open to a 25% concession, seller financing, or rate buy-down credit?
- Built in 1966 — when were the roof, HVAC, electrical panel, plumbing, and water heater last replaced?
- What does the HOA fee cover, when was the last increase, and are there any pending special assessments or reserve-fund shortfalls?
- Any open or pending special assessments — roof, HVAC, plumbing, elevator, façade? What's the per-unit balance and payoff schedule, and is the seller paying it off at close or rolling it to the buyer?
- Is there a deadline driving the sale (1031 exchange, divorce, estate, relocation)? That informs how much negotiation room exists.
- Crime grade is F in this area — have there been break-ins, vandalism, or insurance claims at this property in the last 3 years? What carrier currently insures it and at what premium?
- The area grade is low — what's the realistic commute time and amenity access for the typical tenant pool here? Any planned neighborhood developments (good or bad) we should know about?
- What's the average days-on-market for RENTAL listings here right now (not sales)? A rising rental-DOM trend means longer vacancies and softer asking-rent achievability than the comps imply.
- What's the recent tenant-quality profile in this submarket — average credit score on applications, eviction rate, late-payment / NSF rate, and stable-employment percentage? A property-management company in the area should have these aggregated.
- How much new apartment / multifamily construction is in the pipeline within 1–3 miles? Heavy new supply (>2% of stock underway) typically softens rents 12–24 months out; light construction supports rent growth.
Investment metrics
- 1% rule
- 1.11% ✓
- Cap rate
- 4.61%
- Cash-on-cash
- -6.02%
- DSCR
- 0.73
- GRM
- 7.5
CMA / ARV
- ARV (median comp)
- $192,632
- List price
- $150,000
- Delta
- -22.13%
- Verdict
- UNDERPRICED
- Comps
- 5 within 2.0 mi
Projected returns pro-forma
-3.0% appreciation · 2.26% rent growth · sell at horizon
- IRR
- -27.6%
- Equity multiple
- 0.08×
- Total profit
- $-38,633
- Equity at exit
- $22,365
- IRR
- -29.5%
- Equity multiple
- -0.30×
- Total profit
- $-54,578
- Equity at exit
- $12,969
Cash invested: $42,000 (down + closing). Projections, not guarantees.
Landlord ↔ Tenant lean methodology
- Overall (CITY)
- 34 Tenant-Leaning
- State Minnesota
- 46 Balanced · D+2
- County
- — inherits STATE
- City Minneapolis
- 34 Tenant-Leaning · D+50
ZIP-level market 55416
- Rents YoY
- 2.3%
- Active inventory
- 205
- Price-to-rent
- 7.5×
Monthly cashflow live
- Estimated rent
- $1,669 high interval (Pro) →
- Mortgage (P&I)
- −$787
- Tax from tax record
- −$169 /mo · $2,031/yr
- Insurance
- −$62
- HOA
- −$511
- Vacancy / Maint / Mgmt
- −$351
- Net cashflow
- $-211
Break-even live
UW: 25.0% down · 7.5% · 30yr · 1.5% tax · 5.0% vac · 8.0% maint · 8.0% mgmt
Financing live
Cash to close
- Down payment
- $37,500
- Closing costs
- $4,500
- Reserves months
- —
- Total cash needed
- —
Loan-product check · same deal, 3 products live
Conventional
25% down · 7.5% · 30yr
- Down + closing
- —
- Monthly P&I
- —
- Monthly cashflow
- —
- DSCR
- —
- Eligible?
- —
Personal DTI + credit; lowest rate.
DSCR
20% down · 8.5% · 30yr
- Down + closing
- —
- Monthly P&I
- —
- Monthly cashflow
- —
- DSCR
- —
- Eligible?
- —
No personal income docs; deal must DSCR.
Hard money
10% down · 12.0% · 12mo
- Down + closing
- —
- Monthly P&I
- —
- Monthly cashflow
- —
- DSCR
- —
- Eligible?
- —
Short-term bridge; refi at stabilization.
Rent comps 40 comps
| Address | Beds | Baths | Sqft | Rent | $/sqft | DOM | Units | Dist |
|---|---|---|---|---|---|---|---|---|
| 3420 List Pl Minneapolis, MN | 2.0 | 1.0–2.0 | 846 | $2,220 | $2.62 | 1d | 23 | 0.06mi |
| 3430 List Pl Minneapolis, MN | 1.0–3.0 | 1.0–2.0 | 1118 | $1,435 | $1.28 | 7d | 1 | 0.11mi |
| 3140 Chowen Ave S Minneapolis, MN | 2.0 | 1.0–2.0 | 760 | $1,650 | $2.17 | 2d | 19 | 0.13mi |
| 3050 Abbott Ave S Minneapolis, MN | 2.0 | 1.0–2.0 | 823 | $2,218 | $2.69 | 7d | 1 | 0.14mi |
| 3144 Chowen Ave S Minneapolis, MN | 2.0 | 1.0–2.0 | 828 | $2,952 | $3.56 | 1d | 5 | 0.17mi |
| 3708 W 32nd St Minneapolis, MN | 1.0 | 1.0 | 615 | $1,138 | $1.85 | 20d | 2 | 0.18mi |
| 3031 Ewing Ave S Minneapolis, MN | 1.0 | 1.0 | 587 | $1,245 | $2.12 | 3d | 3 | 0.23mi |
| 3820 W 31st St Minneapolis, MN | 1.0 | 1.0 | 690 | $1,670 | $2.42 | 10d | 3 | 0.30mi |
| 3029 France Ave S Minneapolis, MN | 1.0–2.0 | 1.0 | 875 | $1,195 | $1.37 | 3d | 11 | 0.32mi |
| 3036 W Lake St Minneapolis, MN | 2.0 | 1.0–2.0 | 919 | $1,970 | $2.14 | 2d | 15 | 0.35mi |
| 3118 W Lake St Minneapolis, MN | 3.0 | 1.0–2.0 | 1005 | $2,083 | $2.07 | 1d | 15 | 0.35mi |
| 3100 W Lake St Minneapolis, MN | 1.0–2.0 | 1.0–2.0 | 844 | $1,715 | $2.03 | 1d | 15 | 0.37mi |
| 3030 France Ave S Minneapolis, MN | 1.0 | 1.0 | 593 | $2,199 | $3.71 | 3d | 4 | 0.38mi |
| 3026 W Lake St Unit 201 Minneapolis, MN | 1.0 | 1.0 | 650 | $1,395 | $2.15 | 24d | 1 | 0.38mi |
| 3920 Excelsior Blvd Minneapolis, MN | 2.0 | 1.0–2.0 | 1050 | $2,267 | $2.16 | 1d | 16 | 0.46mi |
| 4301 Park Glen Rd Minneapolis, MN | 2.0 | 1.0–2.0 | 781 | $1,604 | $2.05 | 2d | 11 | 0.56mi |
| 2900 Thomas Ave S Minneapolis, MN | 4.0 | 1.0–3.0 | 1933 | $2,908 | $1.50 | 2d | 47 | 0.57mi |
| 4300 Minnesota 7 St Louis Park, MN | 1.0–2.0 | 1.0 | 607 | $1,095 | $1.80 | 43d | 5 | 0.59mi |
| 3504 Minikahda Ct St Louis Park, MN | 2.0 | 1.0 | 565 | $1,270 | $2.25 | 3d | 9 | 0.61mi |
| 3016 Lynn Ave Apt 3B Minneapolis, MN | 1.0 | 1.0 | 650 | $1,115 | $1.72 | 43d | 1 | 0.69mi |
| 2888 Joppa Ave S St Louis Park, MN | 1.0–2.0 | 1.0–1.5 | 900 | $1,275 | $1.42 | 2d | 13 | 0.69mi |
| 4450 Minnetonka Blvd Minneapolis, MN | 1.0–2.0 | 1.0 | 1000 | $1,295 | $1.29 | 5d | 7 | 0.72mi |
| 4501 Park Glen Rd St Louis Park, MN | 1.0–2.0 | 1.0–2.0 | 904 | $1,434 | $1.59 | 2d | 23 | 0.74mi |
| 4320 W 36 1/2 St Minneapolis, MN | 1.0–2.0 | 1.0 | 685 | $1,050 | $1.53 | 15d | 3 | 0.78mi |
| 4320 W 36th 1/2 St Unit 102 Minneapolis, MN | 1.0 | 1.0 | 550 | $975 | $1.77 | 24d | 1 | 0.80mi |
| 4320 W 36th 1/2 St Unit 204 Minneapolis, MN | 1.0 | 1.0 | 550 | $1,000 | $1.82 | 24d | 1 | 0.80mi |
| 3440 Belt Line Blvd Minneapolis, MN | 1.0 | 1.0 | 706 | $1,856 | $2.63 | 2d | 14 | 0.88mi |
| 4531 W 36th St Unit 44-21 St Louis Park, MN | — | 1.0 | 400 | $1,099 | $2.75 | 24d | 1 | 0.88mi |
| 3624 Lynn Ave St Louis Park, MN | 2.0 | 1.0–2.0 | 687 | $1,085 | $1.58 | 24d | 7 | 0.89mi |
| 4820 MN-7 St Louis Park, MN | 1.0–2.0 | 1.0–1.5 | 875 | $1,340 | $1.53 | 2d | 13 | 0.92mi |
| 4505 W 36th St St Louis Park, MN | 1.0 | 1.0 | 700 | $1,269 | $1.81 | 3d | 3 | 0.95mi |
| 3510 Belt Line Blvd Minneapolis, MN | 1.0 | 1.0 | 809 | $2,254 | $2.78 | 22d | 7 | 0.96mi |
| 1715 Lagoon Ave Unit 7 Minneapolis, MN | 1.0 | 1.0 | 720 | $1,175 | $1.63 | 14d | 1 | 0.97mi |
| 1715 Lagoon Ave Minneapolis, MN | 1.0 | 1.0 | 720 | $1,175 | $1.63 | 43d | 1 | 0.97mi |
| 1709 Lagoon Ave Minneapolis, MN | 1.0 | 1.0 | 610 | $1,195 | $1.96 | 43d | 1 | 0.98mi |
| 3033 James Ave S Unit 301 Minneapolis, MN | 1.0 | 1.0 | 650 | $1,075 | $1.65 | 43d | 1 | 0.99mi |
| 3027 James Ave S Minneapolis, MN | 1.0–2.0 | 1.0 | 796 | $1,581 | $1.99 | 7d | 3 | 0.99mi |
| 3027 James Ave S Unit 102 Minneapolis, MN | 1.0 | 1.0 | 680 | $1,581 | $2.33 | 17d | 1 | 0.99mi |
| 2880 James Ave S Minneapolis, MN | — | 1.0 | 461 | $795 | $1.72 | 43d | 1 | 1.00mi |
| 1619 Lagoon Ave Unit 203 Minneapolis, MN | — | 1.0 | 450 | $925 | $2.06 | 43d | 1 | 1.02mi |
HOA detail condo
- Monthly dues
- $511 · $6,132/yr
- Assessments
- None detected in remarks — confirm with the listing agent.
Listing history 47 events
-
2026-06-18days on market $150,000 Active 37 DOM
-
2026-06-17days on market $150,000 Active 36 DOM
-
2026-06-16days on market $150,000 Active 35 DOM
-
2026-06-15days on market $150,000 Active 34 DOM
-
2026-06-13days on market $150,000 Active 32 DOM
-
2026-06-09days on market $150,000 Active 28 DOM
-
2026-06-08days on market $150,000 Active 27 DOM
-
2026-06-07days on market $150,000 Active 26 DOM
-
2026-06-04days on market $150,000 Active 23 DOM
-
2026-06-03days on market $150,000 Active 22 DOM
-
2026-06-02days on market $150,000 Active 21 DOM
-
2026-06-01days on market $150,000 Active 20 DOM
-
2026-05-31days on market $150,000 Active 19 DOM
-
2026-05-12$150,000 Active 609-char remark
-
2026-05-02historical
-
2025-11-12$150,000 Active
-
2025-11-12historical
-
2025-07-24$150,000 Active
-
2024-10-04historical
-
2024-04-04$169,900 Active
-
2024-04-02historical
-
2019-05-13soldstatus $159,000
-
2019-05-09soldstatus $159,000 Sold
-
2019-03-20historical
-
2019-02-27historical
-
2019-02-27$161,500 Active
-
2019-02-18price $165,000
-
2019-01-28$169,400 Active
-
2016-09-06soldstatus $155,000
-
2016-07-22soldstatus $155,000 Sold
-
2016-07-18status Pending
-
2016-06-30historical Contingent - Inspection
-
2016-06-23$158,900 Active
-
2016-06-22historical
-
2016-06-15historical Contingent - Inspection
-
2016-05-11status Pending
-
2016-05-09historical Contingent - Inspection
-
2016-05-05$158,900 Active
-
2013-09-23soldstatus $110,000
-
2013-08-26soldstatus $110,000
-
2013-08-15historical
-
2013-06-17$119,000
-
2006-07-06soldstatus $135,000
-
2006-07-06soldstatus $195,500
-
2005-08-02soldstatus $197,000
-
2005-05-11$192,400
-
2005-05-11historical
ⓘ Source: listings_history table (triggers on properties + properties_extension) + one-shot
backfill from property_details.listing_events for pre-trigger history.
Tax reassessment forecast MN · Partial reset (capped growth)
- Current annual tax
- $2,031 · $169/mo
- Projected year-2 tax
- $2,031 · $169/mo
- Expected delta
- $0/yr ($0/mo · 0.0%)
ⓘ Screening estimate from a state-policy table — verify with the county assessor before closing.
Climate risk First Street
- Flood 1/10 Low FEMA zone X (unshaded) · 0% chance over 30 yrs
- Wildfire 1/10 Low
- Heat 2/10 Low 7 d/yr ≥99°F today · 14 d/yr by 30 yrs out
- Wind 2/10 Low
- Air quality 2/10 Low 1 unhealthy d/yr today · 1 by 30 yrs out
Nearby sold comps map
Loading sold comps map…
Walkable amenities ~0.75 mi
Loading nearby amenities…
Taxation est. · year 1
- Rental income
- $20,030
- − Mortgage interest
- −$8,402
- − Property taxes
- −$2,031
- − Insurance
- −$750
- − Repairs & maintenance
- −$1,602
- − Management
- −$1,602
- − HOA
- −$6,132
- − Depreciation
- −$4,364
- Taxable loss
- −$4,854
- Est. tax savings @ 24.0%
- +$1,165
- After-tax cash flow
- $-1,364/yr
For passive investors: Depreciation is non-cash, so a rental often shows a tax loss while cash-flowing — sheltering income. Rental losses are passive: they offset passive income freely, and up to $25,000/yr can offset ordinary (W-2) income if you actively participate and your MAGI is under $100k (phasing out to $0 by $150k); unused losses carry forward. On sale, claimed depreciation is recaptured at up to 25%, and gains may owe capital-gains tax (a 1031 exchange can defer both). Figures are a year-1 estimate at your 24.0% rate — not tax advice; consult a CPA.
Schools (NCES district)
- District
- Minneapolis Public School District
- NCES district ID
- 2721240
- Math proficiency
- 35% ▼ -7.00%
- Reading proficiency
- 46% ▼ -1.00%
- Median HH income
- $50,521
- Composite
- 34.92/100
- National rank
- #5067
- State rank
- #217 of 301 in MN
Livability — Minneapolis
- Score
- 78/100
- State rank
- #110
- US rank
- #2525
Category grades
Schools grade is shown separately in the Schools card above.
Census & demographics
- Census place
- Minneapolis, MN
- County
- Hennepin County · 1,150,272 people
- City population
- 417,555
- Metro
- Minneapolis-St. Paul-Bloomington, MN-WI
- Population (ZIP)
- 35,015
- Household income
- $105,958
- Rent vs Own
- Severe rent burden
- 1213.0
Population outlook (Hennepin County) Hauer SSP2
- Today (2025)
- 1,405,227 people
- By 2030
- 1,492,650 · +6.2%
- By 2040
- 1,660,157 · +18.1%
- By 2050
- 1,823,498 · +29.8%
- By 2075
- 2,221,283 · +58.1%
- By 2100
- 2,509,976 · +78.6%
Race, ethnicity, and origin ACS 2023
- Neighborhood character
- Predominantly White (79%)
- Race & ethnicity
- White 79% Two or more races 9% Hispanic / Latino 8% Black 5% Asian 4%
- Hispanic origin (detail)
- Mexican 4%
- Common ancestry
- Portuguese 12% Romanian 5% Lithuanian 4%
- Foreign-born
- 8% · Canada, China, South Korea
- Languages at home
- 89% English-only · Spanish 4% Other Indo-European 1% Other Asian/Pacific 1%
Political lean MEDSL · Hennepin
- 2024 margin
- Solid D (+42.6) · D 70.2% · R 27.5% · Other 2.3%
- 2008→2024 swing
- +14.0pp toward D · 2008: 28.6pp · 2024: 42.6pp
- All cycles
- 2024: D+42.6 2020: D+43.2 2016: D+35.3 2012: D+27.1 2008: D+28.6
Not yet ingested
- Civics
- —
Market trends
- HPI YoY
- ▼ -490.63%
- Current HPI
- 230.651
- Rent YoY
- ▲ 2.26%
- Metro
- Minneapolis-St. Paul-Bloomington, MN-WI
- State GDP YoY
- ▲ 2.41%
- F500 in state
- 34
Industry mix (Fortune 500 HQ in MN)
| Industry | F500 HQs | Revenue |
|---|---|---|
| Healthcare | 2 | $407B |
|
||
| Retail | 2 | $150B |
|
||
| Consumer Goods | 2 | $32B |
|
||
| Industrial Machinery | 2 | $6B |
|
||
| Agriculture | 1 | $40B |
|
||
| Healthcare / Medical Devices | 1 | $32B |
|
||
Price history
-22.0% since first listed34 events — show timeline
- 2026-05-12 Listed $150,000 NORTHSTARMLS as Distributed by MLS Grid
- 2026-05-02 Listing Removed — NORTHSTARMLS as Distributed by MLS Grid
- 2025-11-12 Listing Removed — NORTHSTARMLS as Distributed by MLS Grid
- 2025-11-12 Listed $150,000 NORTHSTARMLS as Distributed by MLS Grid
- 2025-07-24 Listed $150,000 NORTHSTARMLS as Distributed by MLS Grid
- 2024-10-04 Listing Removed — NORTHSTARMLS as Distributed by MLS Grid
- 2024-04-04 Listed $169,900 NORTHSTARMLS as Distributed by MLS Grid
- 2024-04-02 Coming Soon — NORTHSTARMLS as Distributed by MLS Grid
- 2019-05-13 Sold (Public Records) $159,000 Public Records
- 2019-05-09 Sold (MLS) $159,000 NORTHSTARMLS as Distributed by MLS Grid
- 2019-03-20 Listing Removed — NORTHSTARMLS as Distributed by MLS Grid
- 2019-02-27 Listing Removed — NORTHSTARMLS as Distributed by MLS Grid
- 2019-02-27 Listed $161,500 NORTHSTARMLS as Distributed by MLS Grid
- 2019-02-18 Price Changed $165,000 NORTHSTARMLS as Distributed by MLS Grid
- 2019-01-28 Listed $169,400 NORTHSTARMLS as Distributed by MLS Grid
- 2016-09-06 Sold (Public Records) $155,000 Public Records
- 2016-07-22 Sold (MLS) $155,000 NORTHSTARMLS as Distributed by MLS Grid
- 2016-07-18 Pending — NORTHSTARMLS as Distributed by MLS Grid
- 2016-06-30 Contingent — NORTHSTARMLS as Distributed by MLS Grid
- 2016-06-23 Listed $158,900 NORTHSTARMLS as Distributed by MLS Grid
- 2016-06-22 Listing Removed — NORTHSTARMLS as Distributed by MLS Grid
- 2016-06-15 Contingent — NORTHSTARMLS as Distributed by MLS Grid
- 2016-05-11 Pending — NORTHSTARMLS as Distributed by MLS Grid
- 2016-05-09 Contingent — NORTHSTARMLS as Distributed by MLS Grid
- 2016-05-05 Listed $158,900 NORTHSTARMLS as Distributed by MLS Grid
- 2013-09-23 Sold (Public Records) $110,000 Public Records
- 2013-08-26 Sold (MLS) $110,000 NORTHSTARMLS as Distributed by MLS Grid
- 2013-08-15 Listing Removed — NORTHSTARMLS as Distributed by MLS Grid
- 2013-06-17 Listed $119,000 NORTHSTARMLS as Distributed by MLS Grid
- 2006-07-06 Sold (Public Records) $195,500 Public Records
- 2006-07-06 Sold (Public Records) $135,000 Public Records
- 2005-08-02 Sold (MLS) $197,000 NORTHSTARMLS as Distributed by MLS Grid
- 2005-05-11 Listing Removed — NORTHSTARMLS as Distributed by MLS Grid
- 2005-05-11 Listed $192,400 NORTHSTARMLS as Distributed by MLS Grid
Property tax history
+0.7%/yrLatest (2025): $2,031 · +19.9% YoY. Source: county tax records.
Cash-flow waterfall
monthlySold comps — $/sqft
last 12 mo · ≤1 miLoading sold comps…